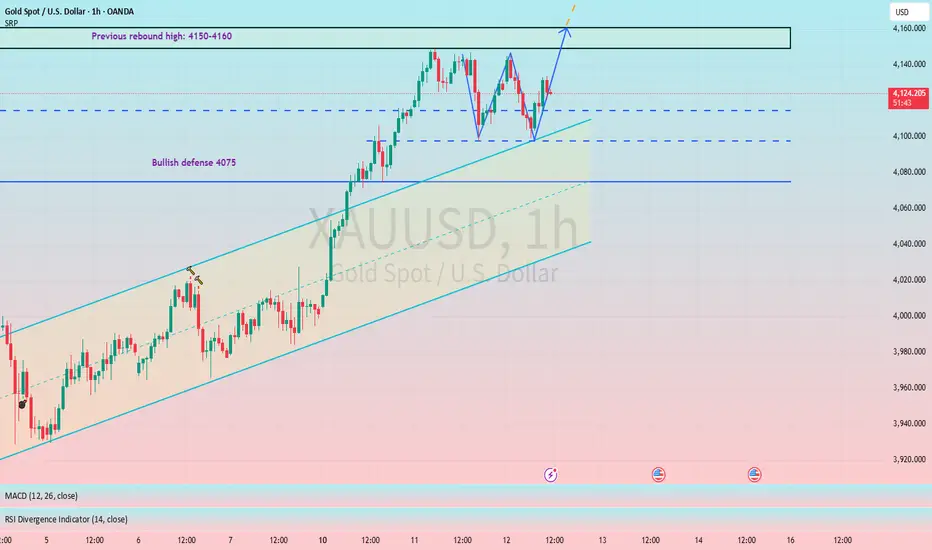
A W-shaped pattern is emerging, indicating a bullish outlook.#XAUUSD TVC:GOLD OANDA:XAUUSD
Gold prices trended downwards during the Asian session, leading many to believe the market has begun to reverse. However, I disagree. As I clearly stated yesterday, as long as the key support level of 4075 is not broken, we will maintain our bullish outlook, and we will continue to follow this strategy today.
From the hourly chart, gold prices are showing signs of forming a W pattern. If the neckline is broken, gold prices will continue to rise, testing the 4150-4160 range. A strong breakout could see prices reach 4180, or even 4200.
Gold
GOLD | RSI Hidden bull divs | GTradingMethodHello Traders,
It’s been a while since my last post — I’ve been focusing more on trading execution than building the brand.
But what a chart to come back with… who went long on Gold today?
🧐 Market Overview:
Gold has been consolidating since the strong leg up on the 5th of November, forming a textbook bull flag. Today’s breakout came with a great piece of confluence - Hidden bullish RSI divergence. Price created higher lows while RSI printed lower lows (check the red markings on RSI and price).
📊 Trade Plan:
Already long from this setup.
If price pulls back for a clean retest of the flag breakout, I’ll be adding more longs.
💡 GTradingMethod Tip:
Hidden divergence is one of the strongest continuation signals. It doesn’t predict reversal — it confirms trend strength. Pair it with a pattern like a bull flag and you’ve got a high-probability structure.
🙏 Thanks for checking out my post!
Make sure to follow me to catch the next idea and please share your thoughts — I’d love to hear what your thoughts on gold are?
📌 Please note:
This is not financial advice. This content is to track my trading journey and for educational purposes only.

GOLD (XAU) Outlook - Prediction (12 NOV)GOLD (XAU) Outlook - Prediction
📊 Market Sentiment
Market sentiment for GOLD remains strongly bullish, primarily driven by central bank accumulation. Since 2023, global central banks led by China have been purchasing gold aggressively, creating a durable demand base. With the FED preparing to initiate QE while inflation remains elevated, I think risk assets like GOLD could outperform as the USD (DXY) weakens. This macro setup continues to support a long term bullish narrative.
📈 Technical Analysis
Price has been retracing since October 20, which I think was a healthy correction following a strong expansion. As mentioned in my previous GOLD outlook, price appeared to be retesting the Weekly Value Gap and accumulating within that zone. In my opinion, this accumulation phase seems to have ended, and the market looks ready to continue higher.
📌 Game Plan - Prediction
Price has broken out of the accumulation zone and started expanding upward. I plan to enter after a retest near the key zone around $4060. It may dip toward $4027, which I consider a discount zone. I intend to scale in between $4060 and $3950, with invalidation if the daily candle closes below $3900.
💬 Follow my Substack profile for detailed insights and extended analysis.
⚠️ Disclaimer: For educational purposes only. This is not financial advice.

XAUUSD: Market Analysis and Strategy for November 12Gold Technical Analysis:
Daily Resistance: 4192, Support: 4030
4-Hour Resistance: 4155, Support: 4080
1-Hour Resistance: 4150, Support: 4100
From a technical perspective, the monthly/weekly charts clearly indicate a short-term upward trend. The "rounded bottom" pattern on the daily candlestick chart is essentially confirmed. The previous pullback highs of 4155/4162 are key resistance levels in the short term, potentially leading to a downward technical correction. Short-term caution is advised regarding a test of the previous support/resistance level in the 4185-4180 area. Pay attention to the 4100/4080 support levels; if these levels hold, continue to buy on dips, while also monitoring the continuation of the upward trend after a breakout.
Looking at the 1-hour chart, the moving averages are converging, and the candlestick pattern forms a range-bound trading pattern between 4100 and 4150. The MACD/KDJ indicators provide upward momentum, but the short-term market continuity remains to be seen. During the European and American sessions, watch for potential resistance and a pullback around 4145/4150.
Trading Strategy:
BUY: 4105~4100
SELL: 4145~4150
More Analysis →

XAUUSD XAUUSD Sell Short Call
After first TP1 move SL to Entry and book partial pofits. TP2 is possible selling pressure contniue.
4h Hour candle was bearish , retrcement has been done 0.5. now bearish momentum should reflect on price action with bearish canlde.
CPI news tommorow will clear the Gold direction further.
Always manage risk reward!

Gold H1 – 5-Wave Complete Amid Fed Rate Hopes & Dollar Rebound🟡 XAUUSD – Elliott Wave Intraday Outlook | 12/11 | by Ryan_TitanTrader
📈 Elliott Wave Context
Gold appears to have completed a clear 5-wave impulsive advance on the H1 chart, with wave 5 reaching into the premium zone around 4,149–4,151. Concurrently, macro news is supporting bullion: weaker US labour data and rising expectations of a Federal Reserve rate cut have bolstered safe-haven flows.
Now price is retracing from the highs, suggesting that a classic corrective ABC sequence may be forming.
🔎 Technical Breakdown (Wave Structure)
• Wave 1: Initiation rally from ~3,965
• Wave 2: Shallow pull-back to near ~4,000
• Wave 3: Strong impulse past ~4,080 → extended
• Wave 4: Controlled correction holding trend-line support
• Wave 5: Final push topping near ~4,149–4,151 (SELL ZONE)
With the 5-wave impulse complete, the market is likely shifting into:
Wave A → bear leg
Wave B → corrective rebound
Wave C → deeper decline
📉 Expected Elliott Wave Path (ABC)
Wave A projection:
• Likely break below the 2-4 trend-line
• First reaction zone: ~4,081 (Fibonacci 0.382)
• Main downside target: ~4,059 (BUY ZONE)
Wave B projection:
• Corrective rebound toward either ~4,108 or ~4,149 (upper premium)
Wave C projection:
• Key downside targets:
o ~4,037 (Fibo 0.618)
o ~4,025–4,010 (trend-line support)
Wave C often equals Wave A in length → aligns with ~4,059 zone for potential cycle end.
Intraday Trade Plan (Elliott-based)
Scenario 1 – SELL the corrective wave (A–B–C)
Preferred strategy given completed impulse.
Entry: After H1 candle breaks below 2-4 trend-line, or on Wave B retest into ~4,149–4,151 (SELL ZONE)
Stop Loss: Above wave-5 high: ~4,155
Take Profit zones:
• TP1: ~4,081
• TP2: ~4,059
• TP3: ~4,037
Scenario 2 – BUY only if correction invalidates
If gold refuses to break the 2-4 trend-line and pushes above ~4,155 → wave 5 may extend.
Entry: Above ~4,155
SL: ~4,149
TP: ~4,175–4,200
📌 Summary
For 12/11, gold has completed a textbook 5-wave impulse and is now ripe for a corrective ABC pattern. With macro forces (Fed rate-cut expectations, weaker dollar) providing backdrop, the highest-probability trade is to sell the Wave B retest and ride Wave C toward deeper support near ~4,059. Stay patient, let the structure confirm the impulse → correction transition before committing.

Gold H1 – Liquidity swept, time for the next bullish legAfter a strong impulsive rally, Gold (XAUUSD) is currently consolidating within a premium zone, showing clear signs of accumulation before continuation.
The structure remains bullish after multiple CHoCH → BMS sequences, confirming Smart Money’s intent to maintain control above the 4,073–4,090 range.
The recent liquidity sweep formed a double-tap reaction near 4,090–4,085, creating a clean H1 Demand / Mitigation zone.
This area aligns perfectly with the 0.618–0.786 retracement, where I’ll be watching for confirmation to rejoin the bullish leg toward 4,148 — the current Buy-Side Liquidity (BSL) target.
💎 Technical View
BUY ZONE: 4,090 – 4,085 (SL 4,080)
→ M15 CHoCH confirmation preferred before entry.
TARGET: 4,148
→ BSL / equal highs above the previous expansion.
INVALIDATION: below 4,080 = short-term bias neutralized.
The market is offering a textbook SMC structure — liquidity sweep, retrace, and continuation.
I’ll remain patient for entry confirmation within the Buy Zone, as chasing price at premium levels rarely pays off. 🌙
💭 Karina’s Note
In Smart Money trading, precision isn’t about prediction — it’s about patience.
Wait for the story to unfold; liquidity will always reveal the next move. 💛
This is my personal view based on SMC principles – not financial advice.
✨ Like & Follow for daily London session updates ✨

Gold maintains its upward trend.Gold continued its upward trend, with the New York closing price holding above the 5-day moving average (MA5). The 10-day and 7-day moving averages (MA10/MA7) remain upward-sloping, and the Bollinger Bands on the 4-hour and hourly charts are also widening upwards, with the price remaining within the upper half of the Bollinger Bands. The moving average system continues its upward trend, and the MACD indicator shows a golden cross. The technical outlook for gold remains bullish, and the trading strategy remains to wait for support levels to buy.
On the upside, watch for resistance at the 0.618 Fibonacci retracement level (4190) and the psychological level of 4200. Overall, barring unforeseen events, the likelihood of gold prices breaking new highs for the remainder of the year is low. A wide-range, back-and-forth movement is expected, but the fundamental bullish trend remains unchanged, and the bull market is expected to continue next year. Therefore, any subsequent dips should be used as buying opportunities. A break below the 4381 high is only a matter of time. Short-term support lies at 4100-4080; buy on dips to these levels is a good entry point. However, avoid hasty purchases after significant short-term gains; a sustained upward trend should be characterized by gradual, stepped increases.
Key Levels:
First Support: 4122, Second Support: 4102, Third Support: 4083
First Resistance: 4160, Second Resistance: 4177, Third Resistance: 4200
Gold Intraday Trading Strategy:
Buy: 4105-4110, SL: 4095, TP: 4125-4135;
Sell: 4185-4190, SL: 4200, TP: 4170-4160;
More Analysis →

4130-4150 Resistace Test for GoldGold has reached the 4130-4150 resistance zone, now it is time to cool off a bit. I was a little late writing this here, my entry is close to 4135 half size but it it get 4145 again i plan to buy the other half. If 4150 broken, the idea will fail so I will place my stops accordingly. I also plan to enter long from the take profit level but not 100% sure yet.

Stop!Loss|Market View: SILVER🙌 Stop!Loss team welcomes you❗️
In this post, we're going to talk about the near-term outlook for SILVER ☝️
Potential trade setup:
🔔Entry level: 50.07771
💰TP: 45.90144
⛔️SL: 51.62853
"Market View" - a brief analysis of trading instruments, covering the most important aspects of the FOREX market.
👇 In the comments 👇 you can type the trading instrument you'd like to analyze, and we'll talk about it in our next posts.
💬 Description: As noted earlier regarding gold, despite the aggressive short-term strengthening of metals, medium- and long-term selling pressure remains. Both gold and silver are trading near key resistance levels, indicating a potential reversal. A further approach to 52 is not ruled out for silver, so shorter-term selling is looked for if the price approaches 50, and it's best to wait for the price to close below 50.
Thanks for your support 🚀
Profits for all ✅
❗️ Updates on this idea can be found below 👇

Gold Consolidating Above 4,110$: The Next Wave Is Loading📊 Technical Overview (H1)
Gold is holding firm around the 4,110$ zone, where a clear liquidity pocket has formed after a short-term correction from last week’s rally. The market continues to build a higher-low structure, showing that bulls are quietly absorbing supply before the next impulsive leg.
Price is currently balancing between support at 4,085$ – 4,113$ and resistance at 4,146$ – 4,172$.
A clean break above 4,146$ could trigger the next bullish leg targeting 4,203$, while a temporary dip toward 4,085$ would still remain within the bullish structure.
🎯 Scenarios to Watch:
• Bullish Scenario: If price holds above 4,113$, expect a breakout toward 4,172$ → 4,203$.
• Pullback Scenario: A retest to 4,085$ could act as a liquidity sweep before continuation.
🧠 MMFLOW Insight
“Smart Money doesn’t chase momentum — it builds it. The current range is the calm before the next move.”
⚜️ Bias: Bullish as long as price stays above 4,085$

GOLD BOUGHT XAUUSDGold recap , gold has hit (take profit) simply by following the trend and trading simple , I now expect it to have a temporary price rest before it can raise and continue its upward momentum

Gold (XAUUSD): break, buy.Gold (XAUUSD): break, buy. If you see a candle close above the level, you can buy.
Cheers

14 Year HVF that still offers 7X upside. SILVER Miner. $EXKEndeavour Silver is a mid tier producer with 4 mines in Mexico and Peru.
Focusing on exploration projects across the Americas.
EXK aims to become a leading senior silver producer.
It's Terronera reached commercial production last month and is forecast to process 350k tonnes over the next 6 months with avg grades of 120g/t Silver and 2.5g/T of Gold
EXK has a extensive pipeline of exploration projects.
The company expects free cash flow in Q4 2025 and Q1 2026
Management targets 30M ounces by 2030
EXK is in growth phase by higher production and new mine outputs but has faced earnings pressure due to derivative losses and rising costs. It has a solid asset base, and future earnings outlook anticipate improved cash flows.

Gold Technical Outlook:
Price has stabilized above the 4105 level, indicating a potential bullish continuation toward the resistance zone at 4160.
A break and confirmation above 4160 on the 1-hour or 4-hour candle would strengthen the bullish sentiment and open the way for further upside targets at 4188 and 4220.
However, if the price drops and breaks below 4105, this would invalidate the bullish scenario and shift the outlook toward a downward move targeting the 4075 support level.

Gold Technical Outlook
Price has stabilized around the 4060 resistance zone (confirmation with a 1H or 4H candle close). If the level holds, the bias remains bullish, with potential upward movement toward the 4100 resistance. A break above 4100 would open the way for continued bullish momentum, targeting the next levels at 4133 and 4168.
However, if the price fails to sustain above 4060 and confirms a reversal candle, it may trigger a downside correction toward the 4030 support zone. A confirmed break below 4030 (1H candle close) would likely extend the bearish move toward the 3965 level.
Bias Trend: Bullish
Volatility: High

Gold Buying Plan.Gold continued its expected bullish trend, rising further after the Asian session opened. The daily chart closed sharply higher, breaking through and firmly establishing itself above the $4100 mark. The 10-day and 7-day moving averages have formed a golden cross and are trending upwards, while the RSI indicator is above the 50 level. On the hourly and 4-hour charts, the Bollinger Bands are widening upwards, with the price trading within the upper half of the band, and the moving average system is also trending upwards. Gold remains bullish!
In the short term, some downward correction is possible, which is normal given Monday's gains of over $100. A short-term technical pullback is reasonable. However, the strength of this correction remains to be seen, as it occurs within a strong uptrend and can unfold in various ways, not necessarily a large price drop, but perhaps a period of sideways consolidation.
If the price quickly completes its technical correction near the short-term support level, then the market may see a period of high-level consolidation or even a second upward move. For support, we're watching the intraday low of 4080 from Monday. If this level holds, the current rebound isn't likely over yet, and we can consider buying on dips near this support level.
Key Levels:
First Support: 4100, Second Support: 4081, Third Support: 4060
First Resistance: 4140, Second Resistance: 4168, Third Resistance: 4192
Gold Intraday Trading Strategy:
Buy: 4090-4095, SL: 4080, TP: 4120-4130;
Sell: 4185-4190, SL: 4200, TP: 4170-4160;
More Analysis →

GOLD: Short Trade Explained
GOLD
- Classic bearish setup
- Our team expects bearish continuation
SUGGESTED TRADE:
Swing Trade
Short GOLD
Entry Point - 4134.0
Stop Loss - 4142.2
Take Profit - 4115.5
Our Risk - 1%
Start protection of your profits from lower levels
Disclosure: I am part of Trade Nation's Influencer program and receive a monthly fee for using their TradingView charts in my analysis.
❤️ Please, support our work with like & comment! ❤️

Gold price rose, awaiting the majors data resumeThere were signs of a resuming US government, which could resume the major data release, especially in the labor market. The labor market has weakened recently, and private data indicate a contraction in companies being watched, driving investors to seek safe havens like gold. Besides, the central bank continued to accumulate gold, with a 28% annual growth in Q3, projected to reach above 1000 tons per year in the latest four years, supporting gold prices.
The XAUUSD briefly tested the 4150 level, with the Golden Cross EMAs signaling stronger bullish momentum. However, the price could hover around 4150 before breaching to test the next resistance at the 4200 level.
By Van Ha Trinh - Financial Market Strategist at Exness

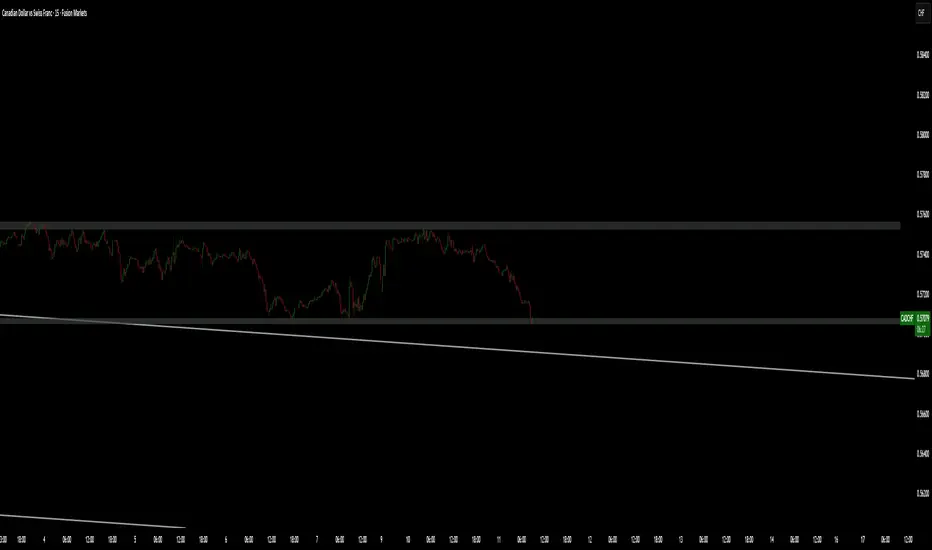
USDCAD weak!USDCAD has been moving down with a pull back in Asian session. Came in for about a 1:1 RR.

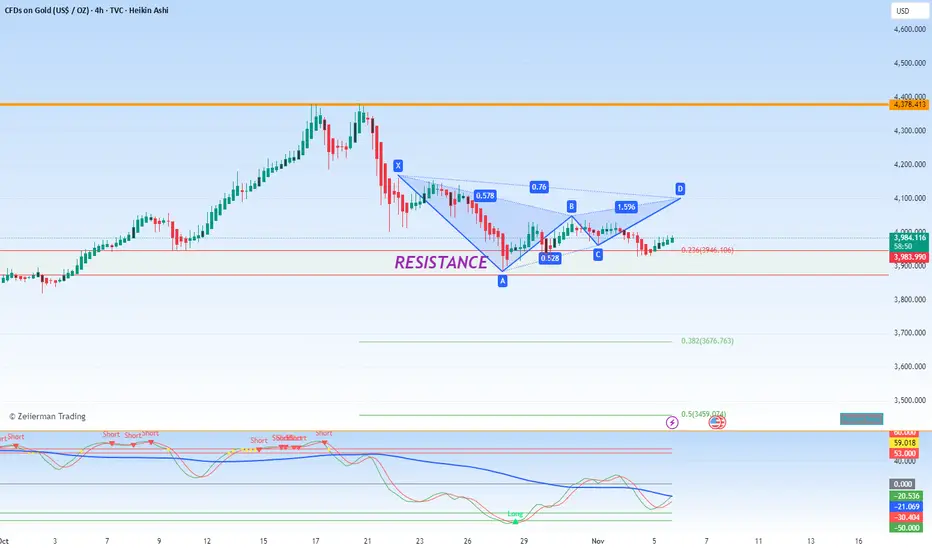
Gold has shaken off its drop and is back on a run!Based on the recent price action, Gold established a new all-time high before undergoing a significant corrective decline of approximately $4,000. From a technical perspective, this sell-off has found a firm footing at a critical juncture. The price has not only stabilized at a prior resistance level—which has now transitioned into a robust support zone—but this level also coincides perfectly with the completion point of a bullish Gartley pattern.
This harmonic pattern, often signaling a potential reversal, suggests the recent downturn may be exhausted. The convergence of these two technical indicators—the strong support-resistance flip and the validated Gartley structure—presents a compelling case for a long entry at the current levels.
Consequently, the strategy is to initiate a long position targeting an upward move towards the $4,100 mark, as the technical setup implies a high probability of a renewed bullish impulse.
Gold (XAUUSD): route of interest to buyGold (XAUUSD): route of interest to buy. If it goes like this I will enter, as I missed the previous entry.
Cheers
