XAU/USD Technical Outlook – October 13, 2025Gold continues to respect its ascending channel on the H1 timeframe. After retesting the 4,000 psychological level, price has regained momentum, forming a new short-term base around 4,035–4,045.
The structure remains bullish, supported by higher highs and higher lows, with dynamic support from the channel’s lower boundary. Traders are now watching the retest zone near 4,050—a potential launch point for the next impulsive wave toward 4,120–4,160.
Key levels to watch:
Support: 4,035 – 4,045 / 3,990
Resistance: 4,085 / 4,120 / 4,160
EMA alignment: Bullish across short and mid-term EMAs
RSI: Maintaining above the midline, confirming buying strength
Trading strategy:
If price holds above 4,035, consider buy setups on pullbacks toward the lower trendline or Fibonacci retracement 38.2–50% zones. A confirmed break above 4,085 may trigger strong continuation toward 4,120+.
However, failure to defend 4,035 could signal a temporary correction toward the 3,990 area before resuming the uptrend.
The bias stays bullish as long as structure and momentum remain intact within this channel.
Follow for more daily insights and advanced gold trading strategies.
Gold

$BTC / Global Liquidity Acceleration with Business Cycle Today’s PA confirmed an interesting theory I’ve had where liquidity reaches risk assets faster as the business cycle picks up.
I wrote about this in depth in my “Twin Peaks” cycle top thesis (pinned tweet).
We were charting Total Global Liquidity with a 12-week lead against CRYPTOCAP:BTC before the rate cut in September, and then we got a 1-point higher reading in the ISM PMI, which I believe accelerated the liquidity cycle by a couple weeks.
I think for every 25 bps rate cut, we will see TGL accelerate by 2-weeks.
The next rate cut is expected at the October 29th FOMC.
It will be interesting to track liquidity flows and the ISM PMI after the next rate cut to see how they adapt to markets.
The GOLD / BTC chart confirms this acceleration, as GOLD typically has a near 1:1 ratio with TGL.
I was one of the first analysts to point out this signal earlier in year before all your favorite large accounts ran with it (go figure).
This acceleration in TGL would mark our local bottom near perfectly.
If this theory is correct and liquidity does accelerate by another 2 weeks, based on TGL, we would have the cycle’s first top somewhere around November 11th.
Currently it’s the 25th with a 10-week lead.
That would coincide with my OG ₿itcoin cycle analysis that I put out over 1.5 years ago, where I said the cycle top would be between OCTOBER 6th, which was already a local top, and NOVEMBER 9th.
However, there is a discrepancy with the GOLD / BTC chart. The local top would be around December 3rd. It’s currently the 17th with a 10-week lead.
I think GOLD has overshot TGL simply based on bull market mechanics creating a parabola.
To sum it up, stay vigilant over these next few months, and take nothing for granted.
The first peak will for sure come sooner than you think.
Going to be fascinating to follow these liquidity flows, at the very least.

Gold’s outlook after Friday’s newsA question came in on TradingView about gold’s outlook after Friday’s news.
My analysis methodology is built on a holistic review of exchange data, where options flow plays a central role — something long-time followers of my posts are already familiar with.
So here’s what Friday’s options flow is quietly telling us:
🔸 The bearish put spread (on November option series ) targeting lower levels from October 8th onward is still intact — suggesting downside sentiment remains in play.
Now, let’s be realistic:
Sophisticated players can always flip this position mid-flight by adding futures to hedge — turning it into a neutral or even bullish setup if the rally continues.
After all, we’re dealing with pros with deep pockets — and they don’t like losing money.
They’ll adjust. They’ll hedge. They’ll exit clean.
🔸 Second, Friday’s CME activity leaned bearish (screen attached)— or at least, profit-taking (fixing).
We see call strikes above current price either being closed or re-sold.
Volume is present — but open interest is flat, declining, or even negative.
That tells a story:
No new conviction for higher prices.
Just closing old upside bets.
📌 Bottom line:
The flow doesn't scream "crash coming right now" — but it does whisper:
"Be careful with the longs."

GOLD (XAUUSD) – Smart Money Setup | Bullish Outlook Above 3985 Price is currently trading near a key FVG & Demand Zone (Fib 0.5–0.618), showing signs of potential bullish reversal.
If the structure holds above 3985–3970, buyers could target the Weekly High at 4059 after reclaiming the Previous Day High (4022).
Analysis Highlights:
HTF Bias: Bullish – Rejection from demand + liquidity sweep.
Key Levels:
Support: 3985 / 3970 / 3947
Resistance: 4022 / 4059
Trade Idea: Waiting for liquidity grab → bullish CHoCH → entry confirmation.
Target Zones: 4022 → 4059
Invalidation: Break and close below 3947 zone.

Gold’s Playbook Repeating in Silver?HI GUYS!
History doesn’t repeat, but in the markets, it often rhymes, and silver’s chart looks eerily familiar.
Gold’s long-term cup-and-handle pattern between 2013–2023 led to a massive breakout above $4,000. Now, silver appears to be tracing the same formation, just a few years behind.
Silver’s cup (2011–2024) has completed, and its handle (a descending channel) is forming right where gold’s did before it launched.
The measured target? Around $200+ USD, a level that would mark a historic revaluation of the metal.
With industrial demand rising and monetary uncertainty persisting, silver could soon follow gold’s lead, turning this technical Deja vu into a full-blown breakout.
History’s playbook is open. Silver might be next.

GOLD Free Signal! Buy!
Hello,Traders!
GOLD breaks above a key horizontal level, confirming bullish momentum as Smart Money drives price toward premium zones. The breakout suggests continuation to the 4,035$ target while respecting liquidity structure.
-------------------
Stop Loss: 3,993$
Take Profit: 4,035$
Entry: 4,016$
Time Frame: 1H
-------------------
Buy!
Comment and subscribe to help us grow!
Check out other forecasts below too!
Disclosure: I am part of Trade Nation's Influencer program and receive a monthly fee for using their TradingView charts in my analysis.

GOLD (XAUUSD): Bullish After Opening
Just a quick follow-up for my Friday's publication for Gold.
I do believe that we will see a bullish market opening with
a highly probable test of 4039 level.
Taking into consideration the latest news, the price may
establish a new ATH and continue rising.
❤️Please, support my work with like, thank you!❤️
I am part of Trade Nation's Influencer program and receive a monthly fee for using their TradingView charts in my analysis.

“Distribution? Maybe. Reversal? Nah. Just liquidity doing yoga.”Dear Goldies, ✨
Ten straight weeks — gold has climbed without looking back.
But every rally meets gravity, and this one now stands at the top of its own empire.
Above 4,000, price breathes thin air — a zone where profit-taking becomes a language, not a choice.
The macro trend remains bullish, yet momentum is stretched.
Price sits high above its 21–50 EMA band, RSI prints divergence — the signature of an overextended leg.
This isn’t weakness — it’s distribution inside strength. The first calm breath after a ten-week sprint.
🟡 Gold (XAUUSD) Structural Outlook
Macro Bias: Bullish, corrective phase
Gold trades deep within the premium range (4,050–4,180) — a historical supply.
Above 4,180 → 4,280–4,380 expansion
Below 3,720 → 3,420–3,300 re-accumulation
⚖️ The battle zone sits between 4,050–3,720, where liquidity decides control.
Weekly View:
Control Zone: 3,980–3,900
Supply: 4,050–4,130
Demand: 3,740–3,640
Soft USD = possible fake-out toward 4,185–4,260 before cooling.
H4 View: Compression → Expansion
Above 3,900: bullish rotations → 4,025 → 4,125 → 4,180
Below 3,900: correction → 3,840–3,700
H1 Intraday:
Main Supply: 4,045–4,065
Flip Zone: 4,015–4,030
Demand OB: 3,965–3,975
Sweep Zone: 3,945–3,925
Final Defense: 3,875–3,895
🎯 Tactical Paths:
🔼 Reclaim 4,030 → 4,065 → 4,105
🔽 Lose 3,975 → 3,945 → 3,875
🧭 Summary
Gold’s macro remains structurally bullish, but price is testing the top of its own range.
Expect engineered sweeps before FOMC as liquidity builds both sides.
4,050–4,180 → premium supply
3,900–3,740 → tactical demand
🦅 Patience > Prediction.
Reaction reveals intention — expansion follows timing.
Disclaimer : For Educational Purposes Only

YALLA XAUMO — WEEKLY COMPREHENSIVE (Confluence Edition)YALLA XAUMO — WEEKLY COMPREHENSIVE (Confluence Edition)
Educational only — not financial advice. Timezone: Africa/Cairo.
1) Snapshot & Map
Spot (XAUUSD): ~4012.8
Distribution Gate: 4022–4029 → unlocks 4046 → 4059.2 → 4090
Uploading bands (supports): 3985 (≈VWAP) • 3970.65 (15m swing low) • 3944.2 (H1/H4 base)
Context: Uptrend intact; repeated probes of 4029 with liquidity building below.
2) GC Futures Structure (COMEX)
GC1 (front): 4036.2
GC2 (next): 4054.4
Term spread: +0.45% → Contango (healthy carry)
Read: Spot marginally under GC1 → synced. Breakout quality improves if the spread flattens during a push.
Plain-English futures curve explainer (always included):
Contango → GC2 > GC1: a normal upward curve; storage/carry cost is priced in (not inherently bearish).
Backwardation → GC2 < GC1: often signals strong near-term demand or short supply.
Term spread (%) → % difference between GC2 and GC1 that shows whether the curve is rising or falling.
3) Fib-Kicker Volume Matrix
(Directional read; volumes summarized from your charts.)
Uploading = accumulation; Offloading = distribution at resistance.
4) Ichimoku Regime Table
15m: Price above cloud; Tenkan > Kijun; Chikou free above price → Bias +
1h: Touching/above Kijun; future cloud slightly up → Bias + (light)
4h: On/near cloud edge; needs a clean 4h close >4029 → Neutral → +
Daily: Well above cloud, stretched from Kijun → Bias ++
Weekly: Above cloud; major trend up → Bias ++
5) Schabacker Patterns (concise)
4h: Flag/rectangle build over 3985–4005.
Daily: Ongoing ascending structure; measured pushes toward 4046/4059.
Weekly: Extended uptrend; 4090 as decision/supply.
6) POC / VAL / VAH / VWAP Table
15m: POC ~4004 • VAL ~3996 • VAH ~4015 • VWAP ~4003
1h: POC ~4006 • VAL ~3992 • VAH ~4022 • VWAP ~4003
4h: POC ref ~3975.15 • value area rising toward ~4020 • VWAP wkly > 3995
Daily: POC 4012 • VAL 3995 • VAH 4029 • VWAP 4003
7) XAUMO Trend Map
15m: 62% Up — buy dips above VWAP 4003
1h: 58% Up — holding >4012 strengthens breakout odds
4h: 55% Neutral→Up — decision >4029
Daily: 68% Up — targets 4046/4059
Weekly: 72% Up — 4090 supply/trim zone
Composite bias: +61% Up — Prefer buy-the-dip; avoid chasing without RVOL & positive delta.
8) Kicker Improvement (Fib + Price Projections)
Gate: 4022–4029
Kickers: 4046 → 4059.2 → 4090
Below gate: Layered support 4003 → 3985/3971; 3944 break would invalidate the weekly bull case.
9) Trade Scenarios
A) Swing — Long (bias)
Type: Buy Limit on pullback into 3985–3971
Entry: 3988 ±
SL: 3961
TP1/TP2/TP3: 4029 / 4059 / 4090
Probability: 62% ↑
Confirmation: RVOL ≥ 1.1 + positive delta + 1H close above 4012/VWAP.
B) Reversal / Edge-Fade — Short (conditional)
Type: Sell Limit from 4046–4059 only on strong rejection
SL: 4066
TP1/TP2/TP3: 4029 / 4011 / 3995
Probability: 48% ↓
Confirmation: Negative delta + failure to close 1H above 4059 + RVOL rolls < 0.9.
Invalidation: 4H close >4066.
C) Scalping — Long (execution)
Type: Buy Stop >4022; add only after 15m/1h close >4029
SL: 4014
TP1/TP2: 4036 / 4046 (move SL to BE after TP1)
Probability: 58% ↑
Confirmation: RVOL ≥ 1.2, green delta, no sharp sell-off at 4046.
10) (Quick Kicker Reference)
4022 is ignition; sustained closes >4029 activate 4046 → 4059.2; 4090 is weekly decision/supply.
11) Macro Calendar — Week Ahead (Cairo)
Mon: Central-bank speaks / bill auctions.
Tue: Sentiment/Business surveys; secondary inflation prints.
Wed: Key inflation/central-bank minutes (if scheduled).
Thu: US jobless claims + activity gauges.
Fri: Consumer sentiment / inflation expectations.
Always re-check your platform calendar for exact times and adjust risk.
12) Arabic Quick Summary (one-liner)
Uptrend, buy dips 4003/3985, gate 4022–4029 → 4046/4059, fade 4046–4059 only with rejection & red delta, break 3944 kills weekly bull.
13) Quick Reference (levels)
Supports: 4003 • 3985 • 3970.65 • 3944.2
Gate: 4022–4029
Upside: 4046 → 4059.2 → 4090
Invalidation (Swing): Daily break <3944.
Disclaimer: Educational content only; not investment advice. Trading involves substantial risk.
🏆 Winners trade with XAUMO

GOLD MONTHLY CHART LONG TERM/RANGE ROUTE MAPHey Everyone,
We’ve just released our new Monthly Chart idea, which we’ll now be tracking following the successful completion of our previous long term monthly chart idea. That one played out beautifully, and now it’s time to shift focus to the next big setup.
Currently, price is trading above the channel midline, and we’ve also seen an important EMA5 cross and lock above 3099, with a candle body close confirming a long term gap above at 3557.
While this confirms the bullish long term structure, we’re also mindful of the potential for a short term retracement, particularly around the EMA5 detachment zone (highlighted with a circle on the chart). This would offer a healthy dip opportunity, aligning perfectly with our strategy to buy into weakness on the way up.
For the bigger structure to remain intact, we’ll be looking for 3099 to continue holding as key structural support. As long as that level is respected, the long term gap toward 3557 remains firmly in play.
This is a higher timeframe idea that we’ll be building on as structure continues to unfold.
We will continue to use all support structures, across all our multi time frame chart ideas to buy dips also keeping in mind our long term gaps above. Short term we may look bearish but looking at the monthly chart allows us to see the bigger picture and the overall long term Bullish trend.
As always, we will keep you all updated with regular updates throughout the week and how we manage the active ideas and setups. Thank you all for your likes, comments and follows, we really appreciate it!
Mr Gold
GoldViewFX

GOLD WEEKLY CHART MID/LONG TERM ROUTE MAPWeekly Chart Update – Follow Up
3732 & 3806 Objectives Achieved, 3910 Gap Opens
Hey Everyone,
Last week’s structure played out precisely as projected, we achieved our 3806 target following a confirmed body close above 3732, validating the continuation leg within our Goldturn structures.
This week, we’ve seen a weekly candle body close above 3806, officially opening the 3910 gap zone. The bullish structure remains well defined, supported by four consecutive weeks of EMA5 detachment, which confirms sustained upside momentum. However, this extended separation also signals potential for sharp corrective phases, requiring careful risk management and dynamic positioning.
Current Outlook
🔹 3732 Breakout & 3806 Objective Completed
Last week’s projected upside target was met precisely following a strong candle close confirmation.
🔹 3910 Gap Now Active
With the weekly close above 3806, the next structural resistance opens toward the 3910 zone.
🔹 EMA5 Detachment (4 Weeks Running)
Persistent detachment supports ongoing bullish momentum, but traders should remain alert for any mean reversion pullbacks or exhaustion on lower timeframes.
🔹 Support Structure
Immediate support now rests at 3806, followed by 3732 as a pivotal retest zone. Deeper support sits at 3659, which aligns with the ascending channel top confluence a critical structural level if broader correction unfolds.
Updated Key Levels
📉 Supports: 3806 (immediate), 3732 (secondary), 3659 (pivotal channel confluence)
📈 Resistance / Next Upside Objective: 3910–4015 zone
Plan & Risk Outlook
The bullish framework remains intact, but with EMA5 detachment now stretched, traders should anticipate volatility spikes or short term corrective dips. A controlled pullback into the lower Goldturns would be considered technically healthy and may offer fresh accumulation opportunities in line with the broader structure.
We’ll continue to monitor for confirmation closes and EMA5 realignments during the week to gauge whether momentum extends or correction begins.
Trade safe, stay disciplined, and manage exposure around volatility.
Mr. Gold
GoldViewFX

Gold. Cycle analysis 12/Oct/25XAUUSD's Cycle number 14 ( black bold ) is overdue, probably a big dive of gold price just before/after postponed many weeks NFP news?

Gold. where is FOMO and JOMO zone? 12/Oct/25XAUUSD where would be roughly the FOMO ( Fear of Missing Out ) ( To trap buyers ) and JOMO ( Joy of Missing Out ) ( To trap Seller and Abandoned Gold Buyer ) are would occur? A Nature Harmonic Phenomenon/ Pattern where price balance out from imbalance of supply/demand..

Idea and structure of the one-hour gold timeframeHi traders
As well as the structure of this timeframe and higher bullish timeframes, liquidity levels and the idea of market movement for this timeframe to move towards liquidity and TPs of buyers of the two lower timeframes and the correction to attract liquidity of the lower trend line and start from the intended support of the next upward wave for

GOLD BULLISH CONTINUATION EXPECTED|LONG|
✅XAUUSD confirms a clean breakout above the key level, shifting order flow bullish under ICT principles. A retest may follow before continuation, with price expected to seek buy-side liquidity near 4,030$. Time Frame 1H.
LONG🚀
✅Like and subscribe to never miss a new idea!✅

Gold at Historic $4,000+ Peak - Bullish Momentum IntactXAUUSD Technical Forecast: Gold at Historic $4,000+ Peak - Bullish Momentum Intact
Asset: XAUUSD (Gold) | Closing Price: $4,018.46 | Bias: Bullish above key support, targeting new highs. 11th Oct 2025 UTC+4
1. Multi-Timeframe Market Structure & Key Levels
Primary Resistance: $4,050 - $4,080. This is the immediate target and minor resistance zone. A break above opens the path to $4,120 and beyond.
Critical Support: $3,980 - $4,000. This psychological and previous resistance-turned-support zone is crucial. A break below shifts bias to neutral.
Major Swing Support: $3,950 (Confirmed by 4H chart structure). A break below this level would indicate a deeper correction towards $3,920.
2. Chart Pattern & Elliott Wave Context
Pattern: Gold is in a powerful, near-vertical uptrend on the daily chart, trading in uncharted territory above $4,000. This is a classic momentum-driven breakout.
Elliott Wave Count: The move from the September lows is a clear impulsive Wave 3 extension. We are likely in the later stages of Wave 3, with a Wave 4 correction expected soon. However, Wave 3 can extend further, so fading this trend is premature.
Bull Trap Risk: Low in the immediate term. The sustained buying pressure and higher lows suggest genuine breakout strength, not a trap.
3. Indicator Confluence & Momentum
Ichimoku Cloud (Daily): Price is soaring high above the Kumo (cloud), indicating an extremely strong bullish trend. The cloud is far below, providing a strong support base.
RSI (14): On the daily chart, the RSI is in overbought territory (>70), which is typical for strong momentum moves. It can remain overbought for extended periods. Divergence is not yet present.
Moving Averages: The 50 EMA (~$3,940) and 200 EMA are bullishly aligned far below the current price, confirming the long-term uptrend. No "Death Cross" is in sight.
Bollinger Bands (4H): Price is consistently riding the upper band, a sign of exceptional strength. Any pullback would likely find initial support at the middle band (20-period SMA).
Actionable Trading Plan
Intraday Trading (1H/15M Charts)
Bullish Continuation Setup:
Trigger: Price holds above $4,005 and breaks $4,030.
Buy Entry: On a retest of $4,015-$4,020 as support, or a break of $4,032.
Stop Loss: Below $3,995.
Targets: $4,050 (TP1), $4,070 (TP2).
Bullish Dip-Buying Setup:
Trigger: A pullback to the $3,990 - $4,000 support zone.
Buy Entry: On a bullish reversal candle (e.g., hammer, bullish engulfing) in this zone.
Stop Loss: Below $3,980.
Targets: $4,030 (TP1), $4,050 (TP2).
Swing Trading (4H/Daily Charts)
Long Swing Entry:
Condition: The trend is your friend. Any dip is a potential opportunity.
Entry Zone: $3,980 - $4,000.
Stop Loss: Below $3,950 (on a daily close).
Target: $4,100+.
Swing Trade Management: Consider taking partial profits at $4,050 and $4,080, then trailing your stop for the remainder to capture any parabolic move.
Conclusion & Risk Note
Gold is in a historic breakout. While overbought, the momentum is undeniable. The strategy is to buy supported dips rather than chase at the absolute top. The $3,980 level is the line in the sand; a break below would signal the first sign of weakness and a potential for a deeper Wave 4 correction. Until then, the path of least resistance is higher.

GOLD 4H CHART ROUTE MAP UPDATE & TRADING PLAN FOR THE WEEKHey Everyone,
Please see our updated 4h chart levels and targets for the coming week.
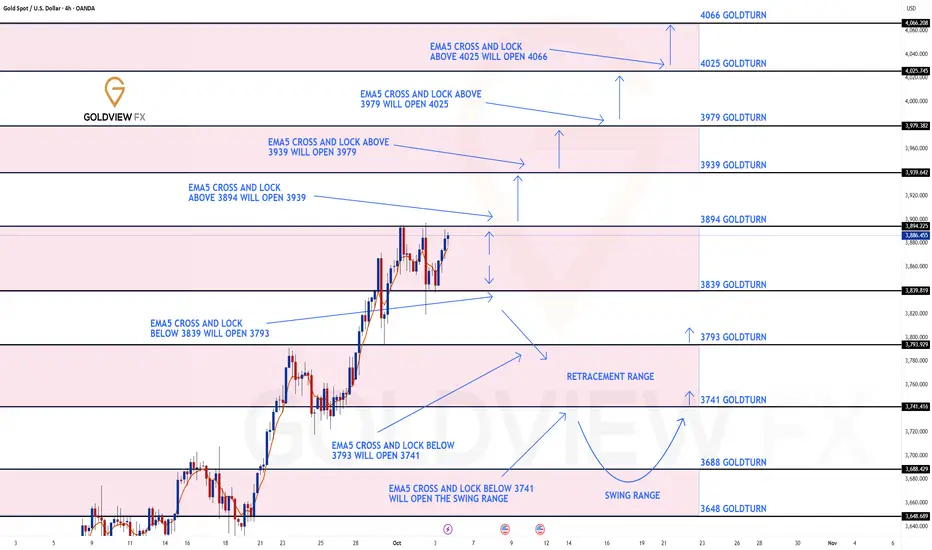
We are seeing price play between two weighted levels with a gap above at 3894 and a gap below at 3839. We will need to see ema5 cross and lock on either weighted level to determine the next range.
We will see levels tested side by side until one of the weighted levels break and lock to confirm direction for the next range.
We will keep the above in mind when taking buys from dips. Our updated levels and weighted levels will allow us to track the movement down and then catch bounces up.
We will continue to buy dips using our support levels taking 20 to 40 pips. As stated before each of our level structures give 20 to 40 pip bounces, which is enough for a nice entry and exit. If you back test the levels we shared every week for the past 24 months, you can see how effectively they were used to trade with or against short/mid term swings and trends.
The swing range give bigger bounces then our weighted levels that's the difference between weighted levels and swing ranges.
BULLISH TARGET
3894
EMA5 CROSS AND LOCK ABOVE 3894 WILL OPEN THE FOLLOWING BULLISH TARGETS
3939
EMA5 CROSS AND LOCK ABOVE 3939 WILL OPEN THE FOLLOWING BULLISH TARGET
3979
EMA5 CROSS AND LOCK ABOVE 3979 WILL OPEN THE FOLLOWING BULLISH TARGET
4025
EMA5 CROSS AND LOCK ABOVE 4025 WILL OPEN THE FOLLOWING BULLISH TARGET
4066
BEARISH TARGETS
3839
EMA5 CROSS AND LOCK BELOW 3793 WILL OPEN THE FOLLOWING BEARISH TARGET
3741
EMA5 CROSS AND LOCK BELOW 3741 WILL OPEN THE SWING RANGE
3688
3648
As always, we will keep you all updated with regular updates throughout the week and how we manage the active ideas and setups. Thank you all for your likes, comments and follows, we really appreciate it!
Mr Gold
GoldViewFX
GOLD 1H CHART ROUTE MAP UPDATE & TRADING PLAN FOR THE WEEKHey Everyone,
Please see our updated 1h chart levels and targets for the coming week.
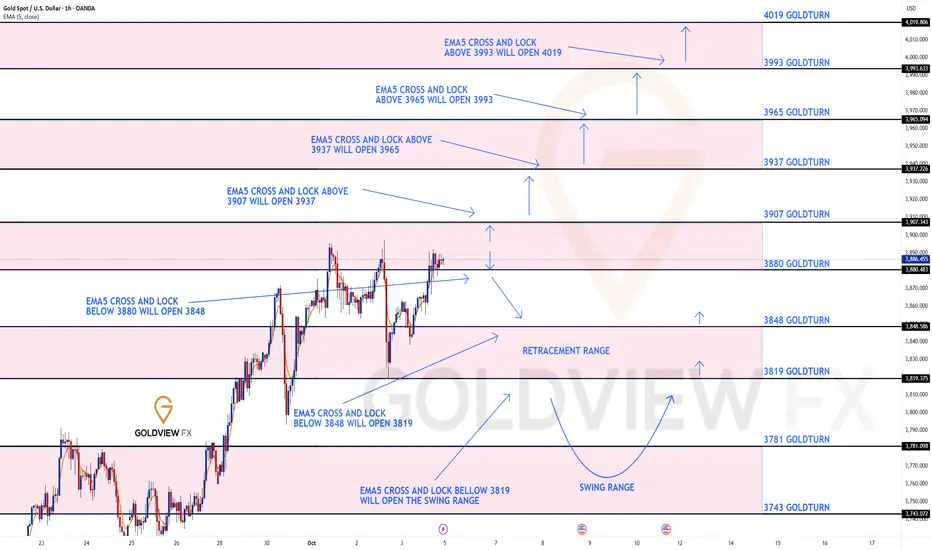
We are seeing price play between two weighted levels with a gap above at 3907 and a gap below at 3880. We will need to see ema5 cross and lock on either weighted level to determine the next range.
We will see levels tested side by side until one of the weighted levels break and lock to confirm direction for the next range.
We will keep the above in mind when taking buys from dips. Our updated levels and weighted levels will allow us to track the movement down and then catch bounces up.
We will continue to buy dips using our support levels taking 20 to 40 pips. As stated before each of our level structures give 20 to 40 pip bounces, which is enough for a nice entry and exit. If you back test the levels we shared every week for the past 24 months, you can see how effectively they were used to trade with or against short/mid term swings and trends.
The swing range give bigger bounces then our weighted levels that's the difference between weighted levels and swing ranges.
BULLISH TARGET
3907
EMA5 CROSS AND LOCK ABOVE 3907 WILL OPEN THE FOLLOWING BULLISH TARGETS
3937
EMA5 CROSS AND LOCK ABOVE 3937 WILL OPEN THE FOLLOWING BULLISH TARGET
3965
EMA5 CROSS AND LOCK ABOVE 3965 WILL OPEN THE FOLLOWING BULLISH TARGET
3993
EMA5 CROSS AND LOCK ABOVE 3993 WILL OPEN THE FOLLOWING BULLISH TARGET
4019
BEARISH TARGETS
3880
EMA5 CROSS AND LOCK BELOW 3880 WILL OPEN THE FOLLOWING BEARISH TARGET
3848
EMA5 CROSS AND LOCK BELOW 3848 WILL OPEN THE FOLLOWING BEARISH TARGET
3819
EMA5 CROSS AND LOCK BELOW 3819 WILL OPEN THE SWING RANGE
3781
3743
As always, we will keep you all updated with regular updates throughout the week and how we manage the active ideas and setups. Thank you all for your likes, comments and follows, we really appreciate it!
Mr Gold
GoldViewFX
Silver Bullet/Rocket Schedule. 11/Oct/25XAGUSD rocket launching might failed again on 3rd attempt at 56 +/- latitude on early 2026..before successfully shooting to outer space

Support and Resistance VS Supply and Demand Explained
In the today's post, I will compare support and resistance levels with supply and demand zones.
I will explain to you the difference between them and share important tips and examples.
What are support and resistance levels?
We also call them key levels. These are particular levels on a price chart from where in the past we saw significant bullish or bearish movements.
Key support will be a one single level, that has a historical significance and from where a bullish reaction will be anticipated.
The all-time low on USDCHF will be a perfect example of a key support.
It is one single level that was respected one time in the past and from where a bullish reversal initiated.
Key resistance will be a one single level on a price chart that has a historical significance and from where a bearish movement will be expected.
The all-time high on Gold will represent a key horizontal resistance.
That level was respected one time in the past and from that level exactly the market dropped heavily.
What are supply and demand zones?
In comparison to support and resistance levels, supply and demand zones are the areas on a price chart. The zones that are based on multiple touches and consequent strong bullish or bearish reactions.
Demand zone will be the area that was tested at least 2 times in the past, and the price should strictly respect different price levels within that area.
A similar reaction will be anticipated from the demand zone in the future.
The yellow area above will a good example of a demand zone.
You can see that the price tested that area 3 times, and each time the market respected different levels lying within that.
These 3 tests compose the demand area.
Supply zone will be the area that was tested at least 2 times in the past and the price should strictly respect different price levels within that area.
A similar reaction will be anticipated from the demand zone in the future.
In this example, a supply area on EURUSD is based on 2 touches of key levels, lying very close to each other.
On the chart above, I underlined 2 horizontal support levels - the single levels that were respected by the market multiple times, and a supply zone - the area that is based on tests of multiple levels lying close to each other.
Support and resistance levels give you SINGLE levels from where you can look for trading opportunities. While supply and demand zones represent the areas . After a test of a supply and demand zone, the market may react to a RANDOM level within that.
For newbie traders, it is highly recommendable to trade single key levels, while experienced traders can broaden their strategies and trade supply and demand zones as well.
❤️Please, support my work with like, thank you!❤️
I am part of Trade Nation's Influencer program and receive a monthly fee for using their TradingView charts in my analysis.

#OTHERS.D ~ Do you believe in Castles in the SKY?I believe that the Others dominance metric divided by an ounce of real money #Gold gives us a valuable insight into the fabled altseasons.
Because as this chart shows theres only been 4 in actuality
and you normal get a double bubble in a cycle.
So I believe we are at the cusp of turning things around as most people have given up on the concept of altcoins ever pumping again.
But it was just the business cycle #PMI that has depressed prices for the past few years.

Gold Rallies as Geopolitical Tensions EscalatedCOMEX: 1-Ounce Gold Futures ( COMEX:1OZ1! )
Without warning, the music at the Wall Street merry-go-round suddenly stops.
On Thursday, October 9th, China’s Commerce Ministry issues a directive, requiring foreign suppliers to obtain approval to export products with rare-earth materials originating from China if they account for 0.1% or more of the good’s total value. Goods produced with certain technologies from China are also subject to the export controls. Both restrictions apply to products manufactured outside of China.
The next day, US President Donald Trump immediately retaliates with a 100% additional tariff for goods imported from China, starting Nov. 1st. He indicated in a social-media post that the duties will come on top of 30% imposed this year on China, as well as tariffs in place on many Chinese goods before the year started.
Prior to Trump’s comments, US stocks were rising sizably on Friday, with the Nasdaq Composite hitting a new all-time intraday high. The TruthSocial post, sent an hour before market close, immediately set off a broad market selloff. At the end of the day, the Dow Jones Industrial Average closes down 878.82 points, or 1.9%, at 45,479.60. The S&P 500 lost 2.71% to settle at 6,552.51, while the Nasdaq Composite fell 3.56% to 22,204.43. The broad-based index’s decline was the largest since April 10th.
While the market is under stress, we have witnessed a classic case of flight-to-safety. At the same time when stocks and cryptos slide, gold pops back up above $4,000 again and settles at $4,035.5 an ounce, up $62.9 or +1.58% for the day. Gold futures contracts also rally with large trade volume.
• The lead contract GCZ5 for benchmark COMEX Gold (100 oz) closes at 4,035.5 with a daily volume of 352,500. In notional terms, the transaction value is $142.2 billion, equivalent to 1,096.4 tons of gold.
• The lead contract GOZ5 for E-Mini Gold (50 oz) closes at 4,036 with a volume of 9,555. Notional value is $1.9 billion, equivalent to 14.9 tons of gold.
• The lead contract MGCZ5 for Micro Gold (10 oz) closes at 4,036.2 with a volume of 640,430. Notional value is $25.8 billion, equivalent to 199.2 tons of gold.
• The lead contract 1OZZ5 for 1-ounce Gold closes at 4,036.75 with a volume of 61,886.
Notional value is $250 million, equivalent to 1.9 tons of gold.
Here are the key reasons supporting the record high prices:
• Economic Uncertainty: Widespread concern about a potential U.S. recession and a shifting global economic order fueled demand for gold as a safe-haven asset.
• Lower Interest Rates: Investors expect the Federal Reserve to cut interest rates, making non-yielding assets like gold more attractive compared to bonds and other investments.
• Geopolitical Instability: A combination of global events, including a prolonged U.S. government shutdown and heightened trade tensions, contributed to a general sense of unease, driving investors to gold.
• Central Bank Purchases: Record buying by central banks has also supported the price of gold.
• Weak Dollar: The Dollar Index is at 99.336, down 8.8% year-to-date. Weak dollar is bullish for all commodities. Global investors pay less to buy gold when they convert local currency into dollar.
What is so significant about the current gold rally?
• The 2025 surge in gold prices has outpaced major past rallies, including those during the 2007-09 recession and the pandemic.
• The move above $4,000 an ounce marks a historic moment, signifying a significant rush into alternative assets amid economic fears.
On April 28th, I published “The Gold-Silver Ratio Explained” on TradingView. At the time, the Ratio was 100 with gold at $3,330 and silver at $33.0.
On October 10th, spot gold is quoted at $4,035.5 while silver is quoted at $47.52. This gives the Gold-Silver Ratio at 84.9. Judging from this important benchmark, gold prices are less extreme than six months ago, even though the price is $700 higher.
Trade Setup with 1-Ounce Gold Futures
Futures market shows bullish sentiment on gold. CFTC’s Commitments of Traders report shows that, as of September 23rd, COMEX gold futures ( CSE:GC ) have total open interest (OI) of 528,789 contracts.
• “Managed Money” holds 198,826 Long contracts, 38,277 Short contracts, and 32,516 contracts at spread positions.
• The long/short ratio of 5.2-to-1 shows that “Smart Money” is very bullish on gold.
Traders who share the bullish view could explore the new 1-ounce gold futures ($1OZ). This pocket-size product is a new way to trade in the gold market, representing just 1/10 the size of a Micro Gold (MGC) futures contract and 1/100 of a Gold (GC) futures contract, making it accessible to all gold traders.
With an initial margin of just $180, traders could gain full exposure to 1 ounce of gold. As of October 11th, the February 2026 contract (1OZG6) is quoted at 4066.75.
Hypothetically, if gold prices move up by 5%, a long futures position would more than double in value (= (4066.75*0.05) / 180 = 113%). This futures contract has a built-in leverage of 22.6:1.
For comparison, owning physical gold has a return of just 5% if gold prices go up by 5%.
The risk of buying gold futures is falling gold prices. Traders could set up a stoploss on their buy order. For illustration, a stoploss at 3,900 would set the maximum loss at $166.75 (= 4066.75–3900). This is below the $180 initial margin.
Happy Trading.
Disclaimers
*Trade ideas cited above are for illustration only, as an integral part of a case study to demonstrate the fundamental concepts in risk management under the market scenarios being discussed. They shall not be construed as investment recommendations or advice. Nor are they used to promote any specific products, or services.
CME Real-time Market Data help identify trading set-ups and express my market views. If you have futures in your trading portfolio, you can check out on CME Group data plans available that suit your trading needs www.tradingview.com

LiamTrading – XAUUSD: Bullish Structure BROKENLiamTrading – XAUUSD: Bullish Structure BROKEN, Preparing for a STRONG DOWNTREND?
Hello trader,
The Gold market has undergone a significant Market Structure Shift, breaking the previously sustainable uptrend. After the key support area around 4000 was breached with high volume, the Bears have taken control in the short term.
Currently, the price is experiencing a slight correction after a sharp drop, but overall, it is forming Lower High – Lower Low patterns on the H1 timeframe, confirming the bearish move.
📊 Technical Analysis (Chart 1H – XAUUSD)
The recent sharp decline has broken the bullish structure (Break of Structure - BOS), while also creating important inefficiency/imbalances that need to be filled:
Liquidity Focus Area (Resistance): $4050 – $4060. This is the resistance peak to watch.
Sell Liquidity Zone (FVG Sell Zone): $4030 – $4040. This is the ideal Fair Value Gap for Bears to re-enter.
Key Support/Buy Scalping Zone: $3925 – $3935 (Confluence area of Fibonacci Extension 2.272).
Swing Buy/Accumulation Zone: $3905 – $3915 (Confluence area of Fibonacci Extension 2.618).
🎯 Main Trading Scenario (Short-term BEARISH)
Sell entry 4000 – 4002
SL 4008
TP 3986 – 3965 3950 – 3923
Sell Entry 4028 – 4031 (FVG )
SL 4036
TP 4022 – 4010 4000 – 3960
Buy Scalping
3926 – 3928
SL 3921
TP 3939 – 3955 3970 – 3990
Buy Bottom Zone 3900 – 3908
SL 3895
TP 3922 – 3945 3970 – 3988
Export to Spreadsheet
🧭 Fundamental Insight & Market Sentiment
The bearish momentum is being driven by the following factors:
Monetary Policy: Fed official Williams' statements supporting continued rate cuts seem to be reducing Gold's safe-haven demand. Although rate cuts typically support Gold in the long term (due to "cheap money"), the slowing labor market is a short-term negative signal.
CPI News: The Bureau of Labor Statistics recalling staff to compile the CPI report amid a government shutdown highlights the importance of this data. If the CPI is not as expected, it could cause significant volatility.
Market Sentiment: After the bullish structure was broken, technical selling sentiment may prevail, especially if the price cannot quickly recover to the 4000 level.
📌 Conclusion & Recommendations
Gold has confirmed a short-term structural shift to bearish. While the long-term trend is not clearly defined, the current priority is to seek Sell opportunities when the price retraces to key resistance and FVG areas (such as $4000 and $4030).
Advice: Always adhere to SL (Stop Loss) and prioritize risk reduction when the market signals a reversal. DO NOT BUY when the bearish structure is dominant.
👉 Follow me for detailed updates and the latest trading plans in the session!
