BUY XAUUSD (GOLD)Based on our deep analysis we can see that gold (XAUUSD) will keep heading to the upside.... BUY!
Goldlong

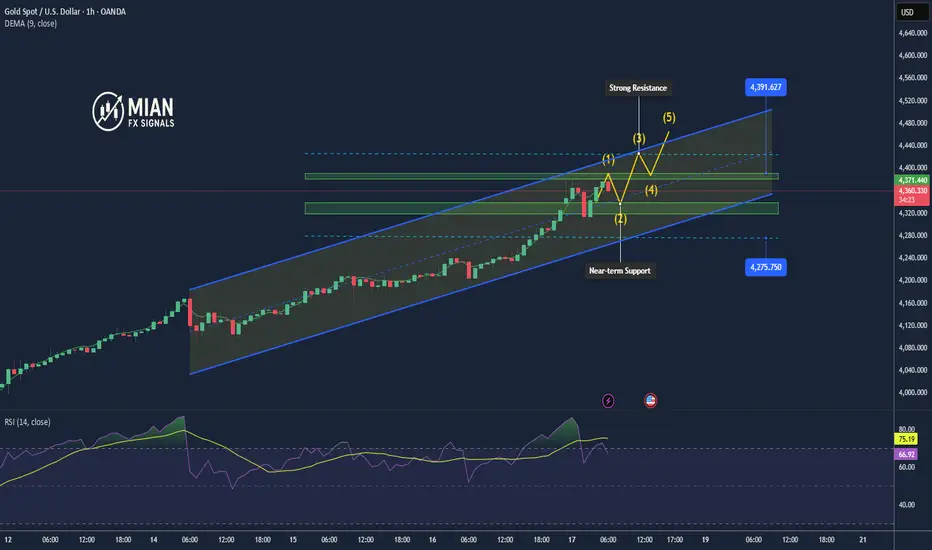
Uptrend Intact: Gold Eyes 4,400 After Sharp Pullback1. Market Overview
After reaching a new all-time high at 4,382, gold experienced a sharp correction down to 4,279, a drop of more than 100 USD/oz in a short time. However, strong dip-buying demand quickly emerged, helping the price rebound and trade back around 4,375, indicating that bullish sentiment remains dominant in the market.
The main drivers are expectations that the Federal Reserve (Fed) will cut interest rates earlier than expected, along with rising geopolitical tensions between major economies — reinforcing gold’s status as a safe-haven asset.
2. Technical Analysis
• Immediate Resistance: 4,382 – 4,390 (all-time high)
• Near-term Support: 4,340 – 4,320
• Major Support: 4,279 (recent correction low)
• EMA 50–100: Still trending upward, confirming that the main trend remains bullish.
• RSI (H1/H4): The overbought condition has been temporarily relieved after the correction, suggesting room for a new upward leg if price holds above 4,340.
3. Outlook
Gold is currently consolidating after a correction phase. If the price remains steady above 4,340, it is likely to continue toward 4,400 – 4,420.
Conversely, a break below 4,320 may trigger short-term profit-taking pressure.
4. Suggested Trading Strategy
🔺 BUY XAU/USD: 4,348 – 4,342
🎯 TP: 40 / 80 / 200 pips
🛑 SL: 4,335
🔻 SELL XAU/USD : 4,425 – 4,428
🎯 TP: 40 / 80 / 200 pips
🛑 SL: 4,431
Gold sweeps SL, wait for BUY LIMIT at Demand Zone 4,223-4,225Timeframe analysis: H4/30M
Logic: Trend Continuation after liquidity sweep.
MARKET STRUCTURE ANALYSIS (SMC Analysis)
Main Trend: Bullish (Price is moving within a parallel channel).
Structure Confirmation (BOS): The chart has confirmed an upward Break of Structure (BOS), indicating that buyers are controlling the market.
Liquidity Sweep/Fake: The strong bearish candle (marked as "Fake") is a move to sweep Stop Losses of early buyers and gather liquidity before Smart Money pushes the price in the main direction. This is an Inducement action.
Key Demand Zone (POI/Demand Zone/Order Block): The TIMING BUY area (4,223.154 - 4,225.000) is a potential Demand Zone/Order Block identified by Smart Money. The price is expected to retest this area before continuing to rise.
MAIN TRADING SCENARIO (LONG SETUP)
SCENARIO: Wait for the price to Pullback to the POI area to enter a buy order, continuing the main bullish trend.
Parameter
Value
SMC Description
Action
BUY LIMIT
Place a pending buy order
Entry Zone (POI)
4,225.000 - 4,223.150
Demand Zone/Order Block after liquidity sweep.
Stop Loss (SL)
4,214.390
Place below the low of the liquidity sweep candle ("Fake Low"), ensuring safety.
Take Profit 1 (TP1)
4,240.000
Target the nearest Swing High.
Take Profit 2 (TP2)
4,250.000
Target psychological resistance and mid-channel.
Take Profit 3 (TP3)
4,260.000+
Target the upper boundary of the parallel channel.
R:R Ratio
Approximately 1:2.5 to 1:3.5 (Depending on TP)
Good R:R ratio for a trend-following trade.
RISK MANAGEMENT
Risk: Only risk a maximum of 1-2% of the account for this trade.
Breakeven: When the price hits TP1, move SL to the Entry point (Breakeven) to protect capital.
Invalidation: If the price closes the D1/H4 candle below the SL level (4,214.390), the buy plan will be invalidated.

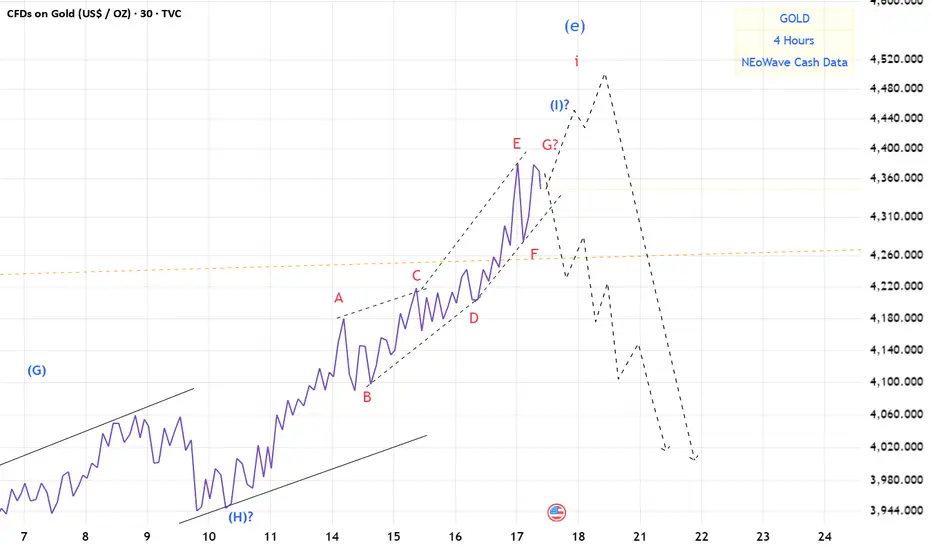
Gold(based on NEo wave)maybe here is the end of wave i.
based on Dow theory good news on top.
crazy people are buying gold.
I think soon we will see crash of gold.
market will not be bullish forever.
XAUUSD: Prioritize Buying, Is the $5000 Target Still Distant?XAUUSD: "No More Gold to Sell" - Prioritize Buying, Is the $5000 Target Still Distant?
Hello trading community,
The Gold market (XAUUSD) is in a state of "extreme euphoria," continuously setting new highs. The upward momentum is driven not only by technical charts but also by extremely strong macroeconomic factors.
This article will analyze why the strategy "Prioritize Buying on Dips" is optimal, and the $4400 level, though seemingly high, might not be the final stop.
📰 Macro Analysis: "No More Gold to Sell!"
The market is witnessing a physical supply shock that cannot be ignored:
Supply Shock: Japan's largest gold retailer has temporarily halted gold bar sales due to overwhelming buying demand. This is a clear signal that physical gold demand is far outstripping available supply. When physical gold is scarce, paper market prices must rise to reflect true value.
Falling Bond Yields: The 10-year German government bond yield (representing Europe) has dropped to its lowest level since June. Lower yields make Gold (a non-yielding asset) significantly more attractive compared to holding bonds.
Both factors are creating a "perfect storm" supporting the price rise of XAUUSD.
📊 Technical Analysis
The M30/H1 chart shows a very sustainable parabolic uptrend:
Trend: The uptrend is undeniable. Prices are moving in a steep upward channel, with all selling efforts quickly absorbed by buyers.
Fibonacci Extension: Fibonacci extension levels are acting as the next price targets:
Zone $4382 (Fib 2.273): Conquered.
Zone $4407 - $4410 (Fib 2.407): This is a potential "Sell Scalping" zone, where a short correction might occur.
Zone $4480 - $4483 (Fib 2.618): This is a strong resistance "Sell Zone," the next target for buyers.
Volume Profile (VPVR):
"Buy Retest" Support ($4290 - $4300): This is an extremely important liquidity zone, a former peak that has been broken and also an area with large accumulated trading volume. Buyers will strongly defend this zone.
🎯 Detailed Trading Strategy
The main trend is Buying. Any Sell orders at this time carry high risk and should only be considered for short-term scalping to catch corrections.
Scenario 1: Buy the Dip 📈
Entry Zone: Wait for price to correct to the "Buy retest" zone $4290.
Stop Loss: $4280.
Take Profit: $4312 - $4334 - $4372 - $4390.
Scenario 2: Sell Scalping ⚡️
Entry Zone: Look to sell at the Fibo $4410 zone.
Stop Loss: $4420.
Take Profit: $4393 - $4380 - $4370. (Note: Counter-trend order, use small volume and take quick profits).
Scenario 3: Sell at Strong Resistance Zone 📉
Entry Zone: $4480.
Stop Loss: $4490.
Take Profit: $4463 - $4442 - $4410.
Summary
The combination of a strong technical uptrend and a fundamental supply shock is pushing Gold into a new price cycle. The $4400 level has been conquered, and with this momentum, the long-term target of $5000 is no longer a fantasy.
The wisest strategy is to "go with the flow," looking to Buy at key support zones.
Wishing traders a successful week!

Gold 1H – Will Dovish Fed Bets Keep Gold Above 4300?XAUUSD – Intraday Trading Plan | by Ryan_TitanTrader
📈 Market Context
Gold prices remain resilient near $4,365 as traders assess the shifting outlook for U.S. monetary policy. After softer inflation data earlier this week, market sentiment has turned cautiously dovish — investors are speculating that the Federal Reserve may cut rates sooner in 2026 if growth indicators weaken further.
However, today's focus is on the U.S. housing and labor data, which could influence short-term volatility. A strong report may revive dollar demand and trigger profit-taking in gold, while weaker readings could boost safe-haven interest and push XAUUSD higher toward 4,400+.
Expect intraday swings as liquidity hunts unfold before any decisive trend confirmation.
🔎 Technical Analysis (1H / SMC Style)
• The structure remains bullish, supported by consecutive Breaks of Structure (BOS) and a clean reaccumulation phase during the 4,230–4,270 consolidation.
• Price recently tapped a premium supply zone near 4,400, where early sellers may attempt short-term reactions.
• The discount demand zone at 4,300–4,302 aligns with a 0.382–0.5 Fibonacci retracement and previous BOS support, offering a high-probability re-entry area for continuation.
• Liquidity sweeps above 4,400–4,398 could attract institutional profit-taking before the next bullish leg resumes.
🔴 Sell Setup: 4400 – 4398
SL: 4410
TP targets: 4340 → 4315
🟢 Buy Setup: 4300 – 4302
SL: 4293
TP targets: 4345 → 4385 → 4410+
⚠️ Risk Management Tips
• Wait for M15 ChoCH/BOS confirmation before entering any setup.
• Expect volatility during U.S. macro data releases — spreads may widen temporarily.
• Use partial take-profits near intraday liquidity zones and trail stops once structure confirms bullish continuation.
✅ Summary
XAUUSD maintains its bullish structure above 4,300. A short-term pullback toward the 4,300–4,302 demand zone could offer another opportunity for buyers to rejoin the trend.
While profit-taking may occur at 4,400, the broader bias remains “Buy the Dip” unless a confirmed shift in structure occurs below 4,293.

GOLDI think this chart is bullish to 6400$ and complete TVC:GOLD 2-leg target.
Best support for pullback 1900$ to 900$ that i think not touch this supports but this rally is very strange.
Please control your money management.

4300 is just the beginning, it is expected to reach 4500Affected by the continued impact of the US government shutdown, gold in the US market rose strongly. After hitting a high of 4292, it quickly fell back and rebounded, setting a new historical high of 4298. But judging from the current trend, this is obviously not the peak of gold prices. If the short-term rise continues, it is expected to test the pressure of the 4,300 integer mark.
As the short-term trend line is broken, the previous resistance is gradually transformed into support. Pay attention to the short-term support range of 4275-4260 below. If this range can be held, gold will set a new high.
OANDA:XAUUSD

Gold (XAU/USD) Breakout Rally Toward New Highs!Analysis:
Gold (XAU/USD) continues its strong bullish momentum on the 4-hour chart, forming a series of higher highs and higher lows, confirming a sustained uptrend. The recent breakout above the resistance zone near $4,150–$4,170 indicates renewed buying interest and momentum buildup.
After a brief retest of the breakout area, price has started climbing again — a sign of trend continuation supported by bullish candle formations and strong market sentiment.
Technical Outlook:
Support Zone: $4,140 – $4,170 (previous resistance turned support)
Bullish Confirmation: Continuation pattern with clean structure and volume support
Momentum Bias: Strongly bullish while above $4,150
🎯 Target: $4,300 – $4,320 zone
🛑 Stop Loss: Below $4,140 to limit downside risk
📈 Summary:
As long as gold stays above the breakout level of $4,170, the market remains bullish, with upside potential toward $4,300–$4,320, aligning with the next major resistance area.

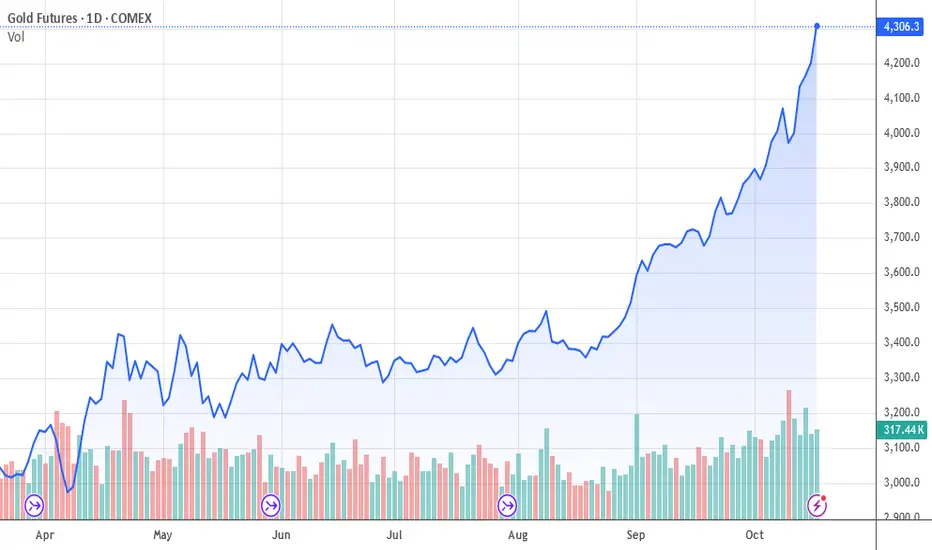
Is There an End to Gold’s Price Surge?The price of gold has already reached $4,300 per ounce. As we have repeatedly mentioned in our analyses, once gold starts moving upward, there’s no stopping it — and this prediction is now being confirmed.
Since mid-August 2025, gold has gained nearly $1,000 per ounce in just two months. Few could have imagined such a move, yet it was entirely foreseeable given today’s global conditions.
The world remains deeply unstable — with the shift toward digital currencies, ongoing wars, and soaring national debts that push governments to borrow endlessly. These factors drive investors and ordinary people alike to seek safety in gold and real estate.
The momentum behind gold is unlikely to end in the coming months. As we’ve projected before, the price trend remains strongly bullish.
At World-Signals, we expect a minor correction just before the $5,000 level, likely a pullback of $400–$500, followed by a continuation of the uptrend throughout 2026.
It’s not impossible that those holding just a few gold bars by 2026 could find themselves millionaires.
Gold eases slightly after hitting new all-time high at 4242📊 Market Overview
Gold rallied to a new record high at $4242/oz earlier this morning before easing to around $4235/oz.
The surge was driven by safe-haven demand amid weaker U.S. Treasury yields and rising expectations that the Federal Reserve could begin rate cuts later this year.
Meanwhile, the U.S. dollar paused its recent uptrend, adding more support for gold during the Asian session.
🧭 Technical Analysis
• Trend: Strong Bullish
• Resistance: 4245 – 4250
• Support: 4228 – 4220 – 4210
• EMA20–EMA50: Upward divergence confirms strong bullish momentum
• RSI (H1/H4): Above 70 → signals possible short-term pullback
• Candlestick (H1): Minor correction signals appear, but no clear reversal yet
💡 Outlook
Gold remains in a firm bullish structure, though a short-term correction toward 4220–4225 is possible before the market retests the 4250 resistance zone.
As long as price stays above 4220, the uptrend remains intact and buyers maintain control.
🎯 Trading Plan
🔺 BUY XAU/USD: 4223 – 4220
🎯 Take Profit: 40 / 80 / 200 pips
🛑 Stop Loss: 4217

XAU/USD) Bullish Analysis Read The captionSMC Trading point update
Technical analysis of XAU/USD (Gold) – Bullish Continuation Setup (1H Chart)
Technical Overview:
Instrument: Gold Spot (XAU/USD)
Timeframe: 1 Hour
Current Price: $4,238
Target Price: $4,303
Potential Move: +1.91% (approx. +80 points)
---
Chart Analysis:
1. Key Zone (Yellow Box):
This area represents a bullish order block / demand zone where price previously reacted strongly.
A small Fair Value Gap (FVG) exists within this zone, suggesting that price may retrace to fill it before continuing higher.
2. Price Action:
After a strong bullish impulsive move, price is currently showing a retracement back toward the order block zone.
The expectation is for price to retest this support zone and form a higher low, confirming continuation of the uptrend.
3. Moving Averages:
EMA 50 (Red) is above EMA 200 (Blue) → indicates a bullish trend structure.
Both EMAs are pointing upward, supporting bullish momentum.
4. Projected Move:
Once the retracement completes, a bullish push toward the target level at 4,303 is expected.
This level aligns with previous structure highs and potential liquidity targets.
---
Trading Outlook:
Bias: Bullish
Entry Zone: Within the highlighted yellow order block / FVG area
Target Point: 4,303
Invalidation: A 1-hour candle close below the order block would weaken the bullish scenario
Mr SMC Trading point
---
Summary:
Gold remains in a strong bullish structure, with momentum favoring further upside after a short retracement. Watching for confirmation signals (bullish engulfing, market structure shift) within the order block zone could provide a high-probability long setup.
---
please support boost 🚀 this analysis

XAU/USD) Bullish trend analysis Read The captionSMC Trading point update
Technical analysis of XAU/USD (Gold), 4H timeframe — here’s the detailed breakdown 👇
---
Trade Idea: Bullish Continuation Setup — XAU/USD
Market Context
Gold has been in a strong uptrend, forming higher highs and higher lows.
Price has recently broken above the previous resistance zone, signaling bullish continuation.
---
Key Technical Points
1. FVG (Fair Value Gap) Zone
The chart highlights an FVG area around 4,060–4,080, which now acts as a potential retracement zone.
Smart money often drives price back into these imbalances to mitigate orders before continuing the move up.
2. Retest Opportunity
Expect a pullback into the FVG zone, followed by bullish confirmation (rejection candle or structure shift).
This creates a high-probability long entry zone aligned with the prevailing bullish order flow.
3. Key Support Level
The 3,940–3,970 zone below acts as a major support / demand area, reinforcing the overall bullish bias.
4. Target Point
The projected target point is around 4,250, based on the measured move from the FVG breakout structure.
This aligns with liquidity resting above previous highs — a likely take-profit zone for institutional traders.
---
Trade Plan
Entry: Wait for price to retrace and show bullish confirmation inside the 4,060–4,080 (FVG zone).
Stop Loss: Below 4,040 (beneath imbalance / last swing low).
Take Profit: 4,250 target zone — completion of the bullish leg.
---
Market Logic
This idea follows Smart Money flow principles:
Break of structure (BOS) confirms bullish control.
Retracement to FVG provides a discounted entry.
Target liquidity above prior highs for exit.
--- Mr SMC Trading point
Summary:
Gold remains in a strong bullish phase — look for retracement entries into the FVG for continuation toward 4,250.
Please support boost 🚀 this analysis

Don't miss any opportunity to go long on a pullbackAfter we gave our trading ideas last night, gold touched the upper pressure level as expected. After we tried to arrange short orders as planned, we left the market safely in the early morning.
At present, gold continues its strong upward trend, with daily lines closing positively for consecutive days, and the bull-dominated pattern is further consolidated. I have pointed out many times before that the current gold price deviates greatly from the moving average, and the indicators show overbought divergence characteristics. We need to be vigilant about possible short-term correction needs, which has also been verified many times. In the short term, gold continues to rise again. The upper pressure can be focused on 4260-4270, which is also the channel suppression level. When it is touched for the first time, you can try to short with a light position.
But remember, our core trading ideas remain unchanged and we remain bullish in the medium to long term. Short selling is only an auxiliary trading strategy. Any downward adjustment before effectively breaking through the key support point can be regarded as a short-term technical correction, thus providing a better entry opportunity for bulls.
Pay attention to the support of 4205-4190 below. If it retreats to here, you can continue to go long on gold. The important strong support is still 4140.
OANDA:XAUUSD

Gold Market Update (Easy to Understand!)Gold’s still shining bright; it’s in a bull market, meaning prices are mostly going up 🟢.
But even in a bull market, prices can dip before the next big move. Here’s what could happen next:
📉 If gold falls below 4205, we could see it slide down to 4184 or even 4181.
📈 After that, it might climb again toward 4252, maybe even 4279.
💪 But if gold breaks above 4239, it could keep running up right away!
👉 The big picture: gold still looks strong long-term; just expect a few short dips along the way.
Want to know where I see gold going next and how to trade around these levels?
💬 DM me “GOLD” and I’ll share my next target before it hits the charts. 🚀
Mindbloome Exchange
Trade What You See, Not What You Think

Gold Analysis - Can Buyers Push the Price to $4,250?OANDA:XAUUSD is currently moving within a clearly defined upward channel, with prices consistently adhering to both the upper and lower boundaries of the channel. The recent bullish momentum indicates that the buyers are in control, creating a strong possibility for the uptrend to continue in the near future.
Recently, the price broke through a key resistance level and is now retracing to test it again. If this level holds as support, it will further reinforce the bullish structure, and the next target of 4,250 will become attainable, aligning with the upper boundary of the channel.
As long as the price remains above this support zone, the bullish outlook will remain intact. However, if the support is broken, the bullish scenario could be invalidated, increasing the likelihood of a deeper pullback.
Remember, before making any trading decisions, always confirm your setups and ensure you are managing risk effectively.

Gold Price Outlook – Trade Setup (XAU/USD)🔹 Technical Structure
TVC:GOLD Gold has extended its rally above the $4,200 handle, testing the $4,240–$4,246 resistance zone highlighted on the chart. Momentum remains bullish in the short term, but price is facing rejection near the upper boundary.
Support Zone: $4,204 – $4,210 (marked in red/purple)
Resistance Zone: $4,240 – $4,246 (marked in yellow)
Current bias shows a potential pullback from resistance before another attempt higher.
The drawn projection suggests a corrective dip back into the support zone, followed by a renewed bullish wave toward resistance.
🔹 Trade Setup
Entry: $4,204 – $4,210 (on pullback into support zone)
Stop Loss: $4,202 (below key support structure)
Take Profit 1: $4,240 (resistance re-test)
Take Profit 2: $4,246+ (extension above resistance)
Risk–Reward (R:R): ≈ 1 : 3.92
🔹 Macro Background
Gold continues to trade at elevated levels, supported by strong safe-haven demand amid U.S.–China trade tensions and expectations of further Fed rate cuts. Market participants anticipate a 25bps cut at the October FOMC, with an additional cut in December and more in 2026. Fed Chair Powell’s comments on slower job growth reinforced dovish bets, lowering yields and boosting gold.
Additionally, the newly imposed U.S.–China port fees have increased geopolitical risk, pushing investors to hedge with gold.
🔹 Key Technical Levels
Resistance: $4,240 / $4,246
Support: $4,210 / $4,204 / $4,200
🔹 Trade Summary
Gold remains in a bullish trend but faces heavy resistance near $4,246. A pullback to the $4,210 support zone offers a potential buy-the-dip opportunity, targeting resistance re-tests. Macro fundamentals continue to favor gold’s upside, but near-term corrections are possible before another breakout attempt.
⚠️ Disclaimer
This analysis is for reference only and does not constitute trading advice. Trading involves significant risk, and proper risk management is essential.

mrmoney limited XAU/USD scalping ideagold reacted from our hidden 15minute support zone which gave us a high momentum to the the upside

ETHUSD – Demand Zone Reaction | Bullish Reversal Expected BITSTAMP:ETHUSD
Market Overview
ETHUSD has been consolidating under a descending trendline while repeatedly respecting the key demand zone.
This area has historically absorbed heavy selling pressure, indicating institutional buy orders building up.
If price breaks above minor internal resistance (around 4,050), the breakout could confirm a new bullish leg targeting upper liquidity zones.
Key Scenarios
✅ Bullish Case 🚀 → 🎯 Target 1 4,080 | 🎯 Target 2 4,150 | 🎯 Target 3 4,210
❌ Bearish Case 📉 → Close below 3,920 could extend decline toward 3,860
Current Levels to Watch
Resistance 🔴 4,080 – 4,150
Support 🟢 3,940 – 3,920
⚠️ Disclaimer: This analysis is for educational purposes only. Not financial advice.

XAUUSD (GOLD) 15 Min – Bullish Setup Forming TVC:GOLD
Market Overview
Gold has recovered beautifully after the pullback and is now consolidating just above the demand base. The structure shows a potential higher-low formation, signaling bullish momentum buildup. If price breaks above 4,165, continuation toward the top resistance zone (around 4,178) is expected.
Key Scenarios
✅ Bullish Case 🚀 → Possible rally continuation toward 🎯 4,165 → 🎯 4,178
❌ Bearish Case 📉 → Invalidation below the demand zone near 4,132
Current Levels to Watch
Resistance 🔴 : 4,165 – 4,178
Support 🟢 : 4,132 – 4,145
⚠️ Disclaimer: This analysis is for educational purposes only. Not financial advice.

EURUSD (30M) – Breakout Setup Loading FX:EURUSD
🚀
Structure | Trend | Key Reaction Zones
Price held firmly at the yellow demand zone, showing strong accumulation before reversal.
Now forming a symmetrical triangle, indicating compression before breakout.
Once the upper trendline breaks, we could see a sharp move toward the top blue resistance zone.
Market Overview
After multiple rejections from lower levels, EURUSD is coiling within a tight structure — a clear sign of energy build-up. The market is respecting higher lows and pushing for liquidity above 1.1610–1.1630. A clean breakout could send price toward 1.1648+ highs. Watch for confirmation candle closure above 1.1615 to trigger bullish momentum.
Key Scenarios
✅ Bullish Case 🚀 → 🎯 Target 1: 1.1630 → 🎯 Target 2: 1.1648 (Liquidity zone)
❌ Bearish Case 📉 → Invalidation below 1.1575
Current Levels to Watch
Resistance 🔴: 1.1630 – 1.1650
Support 🟢: 1.1575 – 1.1550
⚠️ Disclaimer: This analysis is for educational purposes only. Not financial advice.

GOLD (1H) – Bullish Continuation SetupTVC:GOLD
🚀
Structure | Trend | Key Reaction Zones
Price has perfectly respected previous demand zones and formed higher highs & higher lows 🔼
After reaccumulation near 4100–4120, momentum remains bullish with a clean structure breakout.
Current move is building pressure toward the Top Rejection Zone (4178–4185) where next liquidity lies.
Market Overview
Gold continues to trade within a strong bullish environment. The recent demand zone at 4100–4120 acted as a perfect base for institutional re-entry, fueling fresh upside pressure. As price consolidates above 4150, breakout confirmation above 4166 will open clean traffic toward the 4180–4200 resistance zone. Buyers remain dominant while the structure supports continuation.
Key Scenarios
✅ Bullish Case 🚀 → 🎯 Target 1: 4178 → 🎯 Target 2: 4188 → 🎯 Target 3: 4200
❌ Bearish Case 📉 → Invalidation below 4130
Current Levels to Watch
Resistance 🔴: 4178 – 4188 – 4200
Support 🟢: 4130 – 4100
⚠️ Disclaimer: This analysis is for educational purposes only. Not financial advice.

i will wait until friday to buy gold from this areaIn this analysis, I relied on Fibonacci and Elliott Wave analysis, so I expect that tomorrow, Thursday, the price will fall to the buying areas that I have marked in green, and after that we will start to rise again, God willing.
