Investing vs. Speculating: What’s the Difference?Hey everyone, you’ve probably heard the words “investing” and “speculating,” but do you really know what sets them apart? Both are about putting money in to make more money, but the mindset and approach are Totally different. Let’s break it down super simply:
What’s Investing? (4 Keywords: Long-term, steady, knowledge, patience)
Investing is like a marathon—it’s about the long game, focusing on things that grow in value over time. You’re aiming for steady, lasting profits, not a quick buck.
When you invest, you do your research. You really understand what you’re putting your money into.
You use knowledge—like studying a company’s finances (FA), looking at market trends (TA), or knowing the rules of the game (FM, RM).
You stay cool-headed, not getting swept up by hype or greed.
Investing isn’t about betting everything on one big win. It’s about protecting your money first, then letting profits grow slowly.
Think of it like planting a tree: you care for it, water it, and wait patiently for the fruit.
For example , let’s say you research a solid real estate deal. You believe a piece of land will grow in value over 3–5 years because it’s in a great spot with new roads being built. You buy it, hold on, and later sell it for a profit. Or you keep it, build a house, or rent it out for monthly cash while owning something valuable.
Investing like this isn’t fazed by short-term ups and downs—it’s all about the long-term payoff.
What’s Speculating? (4 Keywords: Short-term, fast, risky, flexible)
Speculating is like surfing—you jump in to catch a quick wave and make money fast by riding short-term price changes.
You know the term “riding the wave”? That’s it! You need waves to surf, right? If there’s no wave, you’re stuck.
Speculating works the same: it’s a bit daring, and you have to be ready to lose.
When you see a chance, you dive in fast or cut your losses quickly if things go wrong.
For example , back in the day, I got hyped up when Elon Musk tweeted about SHIBA coin. I jumped in, my money shot up 10 times in a short time, and I sold fast. Good thing, because the price crashed right after! If I hadn’t moved quickly, my account would’ve been wiped out.
Speculating is all about quick moves—”buy the rumors, sell the news”, and cashing in on the hype. It’s not about long-term value; it’s about grabbing profits fast. But it’s way riskier, and you can lose everything if you’re not sharp. Knowing when to stop is super important.
So, What’s the Key Difference?
Investing is all about patience.
Speculating is about being quick and flexible.
Someone asked me: “If I trade short-term but do research, is that investing?” Awesome question! But even with research, short-term trading is usually called speculating.
Why?
Because it’s focused on fast profits and higher risks, unlike the steady, long-term foundation of investing.
If you trade short-term with a solid plan, that’s cooler—pros call it systematic trading, way better than just guessing. But in general, short-term moves are still seen as speculating, not investing, because they don’t have that long-term vision.
Investing without a plan? That’s just gambling. (Investing + No plan = Gambling)
Speculating with a strategy? You’re thinking like a smart entrepreneur. (Speculating + Strategy = Entrepreneur)
Whether investing or speculating is better depends on you—your style and your game plan!
That said, choosing between investing and speculatingsometimes depends on each person's position. I’ll share more details in my next video.
If you agree with my opinion, drop a comment here!
I’m Anfibo , just sharing what I know about finance.
Goldlong
XAUUSD: Seeking new highsOANDA:XAUUSD has rebounded sharply back to the prior highs after a correction from 3871 to 3795. With no clear loss of upside momentum, this looks like a classic shakeout before another push higher. For today’s session, the plan is to keep looking for longs , with a primary objective at 3915.
You can read my previous analysis here:
Price is currently meeting resistance at with notable selling pressure, a dip into support may precede the next leg up.
The 3915 area is a logical upside magnet, where CME participants reportedly hold sizeable long-call exposure—a level price may aim to tag.
Key resistance: .
Key support: , .
Trading Plan
Buy setup: Look for Quantum Vol-Delta confirmation of buying pressure on lower timeframes (5m) as price pulls back into .
Contingency: Watch 3836 (POC session/daily liquidity) . Price may sweep this level and rebound.
Please like and comment below to support our traders. Your reactions motivate us to produce more analysis in the future 🙏✨
Victor Dan @ ZuperView

XAUUSD: Caution advised ahead of NFP releaseOANDA:XAUUSD current bullish momentum is weakening, and traders are extremely cautious ahead of the upcoming Non-Farm Employment Change, which is expected to be USD-positive , accompanied by gradually emerging profit-taking pressure from investors. Therefore, I expect gold to have a significant correction soon after completing the upward move above the area.
You can read my previous analysis here:
There has been the appearance of long put contracts from CME traders being deployed into the market , which is a move to guard against a potential decline in gold in the future.
However, this is only the market’s preparation, and at present there is no sign of a reversal .
Continue to look for buy setups toward Targets 1 and 2. Pay attention to the Margin zone, where CME traders are concentrating a large number of contracts, which may cause price to reverse.
Key resistance:
Key strong support: ,
Margin zone:
Wait for confirmation of a Buy (Pull) signal from MagnetOsc Turbo on the lower timeframes after price breaks above the resistance zone and pullback. Place the stop below the most recent M5 swing low when the entry signal appears.
Continue to look for buy setups toward Target 1 & Target 2, while closely watching for reversal signal.
Please like and comment below to support our traders. Your reactions motivate us to produce more analysis in the future 🙏✨
Victor Dan @ ZuperView

XAUUSD H1 Bullish Momentum Likely to ExtendGold (XAU/USD) has bounced off the buy entry at 3,854.03, which is a pullback support that lines up with the 38.2% Fibonacci retracement and could bounce from this level to the take profit.
Stop loss is at 3,831.23, which is a pullback support that aligns with the 61.8% Fibonacci retracement.
Take profit is at 3,893.04, which is a swing high resistance.
High Risk Investment Warning
Trading Forex/CFDs on margin carries a high level of risk and may not be suitable for all investors. Leverage can work against you.
Stratos Markets Limited (tradu.com ):
CFDs are complex instruments and come with a high risk of losing money rapidly due to leverage. 65% of retail investor accounts lose money when trading CFDs with this provider. You should consider whether you understand how CFDs work and whether you can afford to take the high risk of losing your money.
Stratos Europe Ltd (tradu.com ):
CFDs are complex instruments and come with a high risk of losing money rapidly due to leverage. 66% of retail investor accounts lose money when trading CFDs with this provider. You should consider whether you understand how CFDs work and whether you can afford to take the high risk of losing your money.
Stratos Global LLC (tradu.com ):
Losses can exceed deposits.
Please be advised that the information presented on TradingView is provided to Tradu (‘Company’, ‘we’) by a third-party provider (‘TFA Global Pte Ltd’). Please be reminded that you are solely responsible for the trading decisions on your account. There is a very high degree of risk involved in trading. Any information and/or content is intended entirely for research, educational and informational purposes only and does not constitute investment or consultation advice or investment strategy. The information is not tailored to the investment needs of any specific person and therefore does not involve a consideration of any of the investment objectives, financial situation or needs of any viewer that may receive it. Kindly also note that past performance is not a reliable indicator of future results. Actual results may differ materially from those anticipated in forward-looking or past performance statements. We assume no liability as to the accuracy or completeness of any of the information and/or content provided herein and the Company cannot be held responsible for any omission, mistake nor for any loss or damage including without limitation to any loss of profit which may arise from reliance on any information supplied by TFA Global Pte Ltd.
The speaker(s) is neither an employee, agent nor representative of Tradu and is therefore acting independently. The opinions given are their own, constitute general market commentary, and do not constitute the opinion or advice of Tradu or any form of personal or investment advice. Tradu neither endorses nor guarantees offerings of third-party speakers, nor is Tradu responsible for the content, veracity or opinions of third-party speakers, presenters or participants.

Gold 1H – Will Liquidity Above 3903 Fuel Reversal?Gold on the 1H timeframe is consolidating near 3,872 after multiple ChoCHs, with the next liquidity cluster resting above 3903–3901. Market structure shows engineered liquidity sweeps possible at premium supply, aligning with short-term sell opportunities. On the downside, a defined FVG buy zone and discount demand around 3832–3834 provide scope for continuation if tapped.
From the macro side, traders remain cautious ahead of upcoming U.S. economic data, while a resilient dollar and persistent geopolitical risks in energy markets continue to shape volatility. This backdrop supports tactical plays: fading rallies into premium supply while preparing to join the move from discount demand zones.
________________________________________
📌 Key Structure & Liquidity Zones (1H):
• 🔴 SELL GOLD 3903–3901 (SL 3910): Premium liquidity sweep zone. Downside targets at 3880 → 3860 → 3845.
• 🟢 BUY ZONE SUPPORT 3832–3834 (SL 3825): Discount demand aligned with FVG mitigation. Upside targets at 3855 → 3875 → 3890+.
________________________________________
📊 Trading Ideas (Scenario-Based):
🔻 Sell Setup – Liquidity Sweep at 3903–3901
• Entry: 3903–3901
• Stop Loss: 3910
• Take Profits:
• TP1: 3880
• TP2: 3860
• TP3: 3845
🔺 Buy Setup – FVG Mitigation at 3832–3834
• Entry: 3832–3834
• Stop Loss: 3825
• Take Profits:
• TP1: 3855
• TP2: 3875
• TP3: 3890+
________________________________________
🔑 Strategy Note
Gold remains range-bound but liquidity-driven. Expect engineered sweeps above 3903 before deeper corrections, while discounted dips into 3832–3834 offer potential continuation setups. Flexibility is key: fade rallies at premium, but scale into buys if liquidity clears into discount demand.

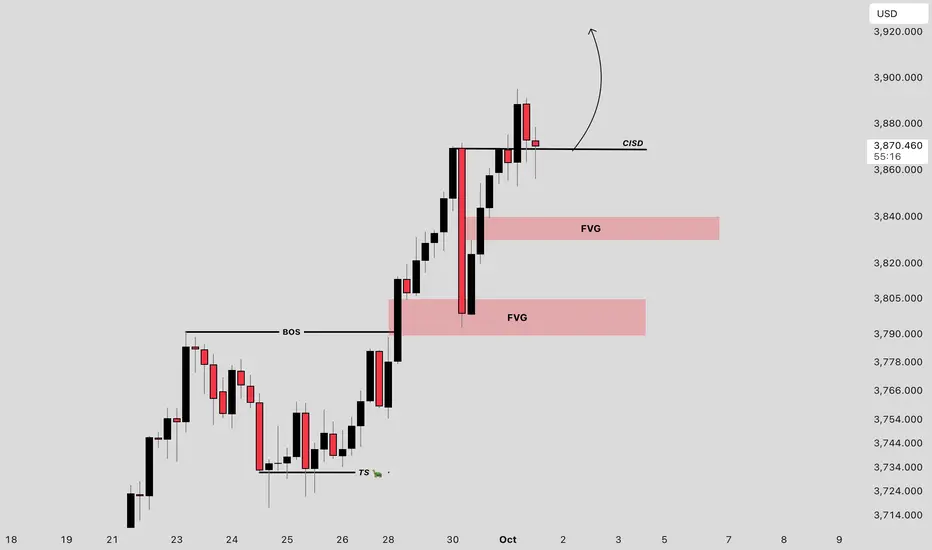
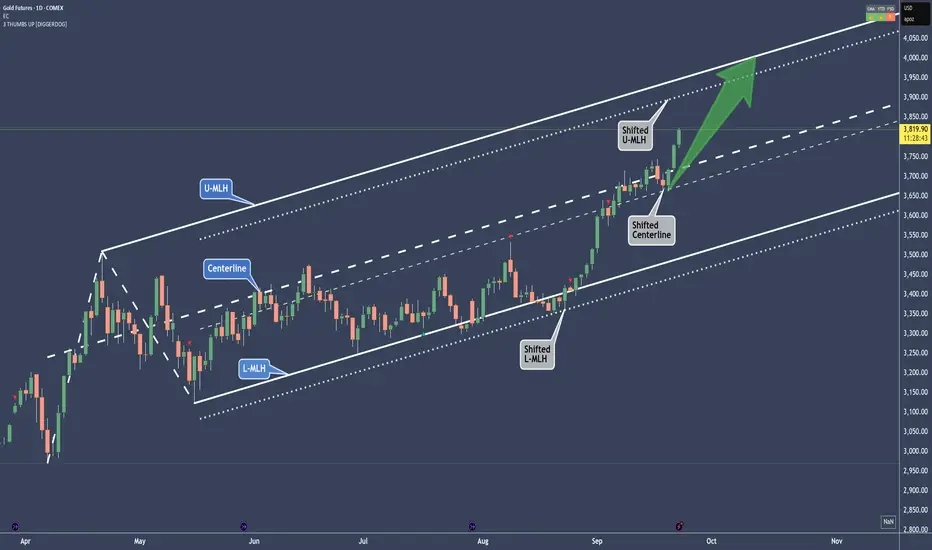
Gold - A shifted move in play and up to 4K🔱 Here’s a shifted move in play 🔱
What exactly is a shifted move?
You see the parallel lines next to the white fork?
Those are the shifted lines.
Now, if you observe how price behaved at the white fork, you’ll notice it was a bit sloppy at the L-MLH, and again at the Centerline after reaching it.
But when we add the dotted parallel lines to the chart and measure the distance from the overshoot at the L-MLH, we find a beautiful support at the Shifted Centerline.
The usual target would be the U-MLH.
So, could the target also be shifted?
And what does that tell us?
Well, if you’re long on Gold, you might want to take some profit at the Shifted U-MLH and let the rest ride up toward 4K—if there’s enough gas in the goose.
For me, a re-entry long would be a pullback to the Centerline—either the original or the shifted one—with a small stop just below some structure.
Let me know what you think ho far Gold will go in the comments.
😊 Thanks for boosting, thanks for following 🙏
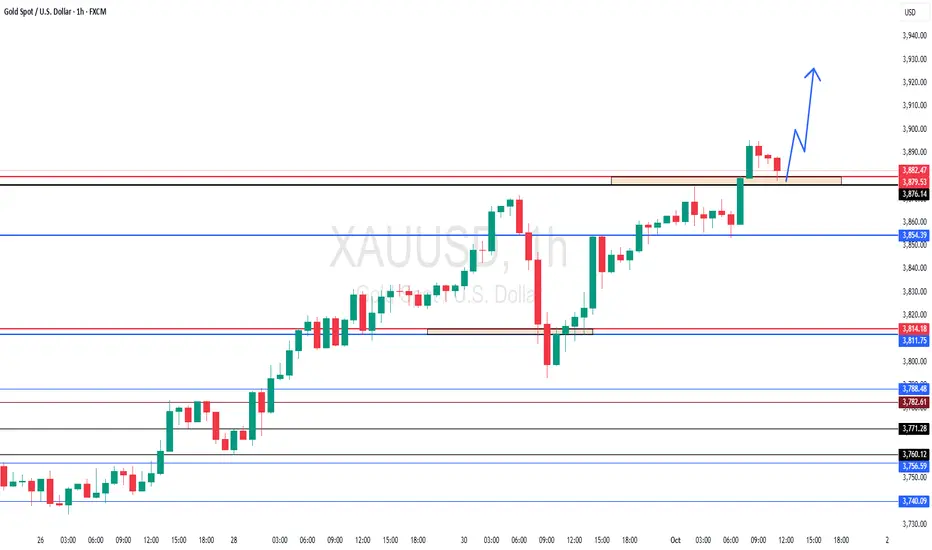
3930 is still pending Our previous commantary sucessfully TP HIT As we took buy from 3855-3867 Both TP HITS at 3890
What will I do on NY SESSION?
I'm buying gold on every DIP
✅️ My First buying will be start from 3870 area - if the market drops for retest on H4 BOS I will took buy trade with very strict Stoploss.
✅️Secondly my buying area will be 3835-3845 zone where we have structurel support and liquidity meets the bottom trendine.
-My target will be 3930 In extension !!
Additional TIP: Buy the dips

GOLD at immediate Support ? whats next??#GOLD.. perfect move as per our couple of ideas regarding gold and now again market make a immediate supporting area that is around 3876 to 3880
keep close that region and if market staying above that means there is further roam to upside,.
good luck
trade wisely
ANFIBO | XAUUSD - DON'T SELL IT TODAY AT ANY COST [01.10.2025]Hello, Anfibo's here!
OANDA:XAUUSD Analysis – Daily Trading Plan
Overall Picture:
OANDA:XAUUSD continues its impressive rally, printing new ATHs one after another. The buy zone recommendation around 3785 – 3795 from yesterday has already delivered nearly 🎯 1000 PIPS 🎯 in profit – an outstanding result that once again showcases the strength of this trend. Truly, the profits from gold are extraordinary – enough for me to say: “I can take my family on another vacation thanks to OANDA:XAUUSD !”
Looking ahead, unless there are major unexpected shifts in fundamentals, gold is poised to keep conquering new highs. With global geopolitical tensions still simmering, safe-haven demand remains robust, and this continues to fuel the bullish momentum. At this stage, we prioritize the buy side over sell side, until gold decisively breaks its trend structure.
Technical Outlook
Short-term trend: Strong bullish continuation on both H4 and Daily timeframes.
Momentum: Healthy and sustainable, with steady higher highs and higher lows.
SUPPORT KEY / BUY ZONES: 3870 - 3834 - 3816 - 3800
RESISTANCE KEY / SELL ZONES: 3904 - 3918 - 4000
Trading Plan Today
>>> BUY ZONE:
ENTRY: 3860 - 3871
SL: 3750
TP: 3915 - ATH
>>> BUY ZONE:
ENTRY: 3815 - 3820
SL: 3710
TP: 3870 - 3915 - ATH
Risk Management
- Favor long trades in line with the prevailing trend; sell setups only for intraday scalps at key resistances.
- Keep a Risk:Reward ratio ≥ 1:2.
- Control position sizing and avoid overtrading during consolidation phases.
- Stay alert to global news headlines, as unexpected geopolitical updates may trigger high volatility.
Conclusion
Gold remains in a strong bullish cycle, consistently breaking into new ATH territory. Our plan continues to focus on buying dips and breakouts, riding the prevailing uptrend.
Key strategy: Buy dips around 3800 - 3816 – 3870 .
Near-term targets: 3900 – 3920 – 3950, while higher levels remain possible if momentum persists.
Gold is rewarding those who stay aligned with the trend – and for now, the bulls are still firmly in control.
HAVE A NICE DAY FRIENDS!!!

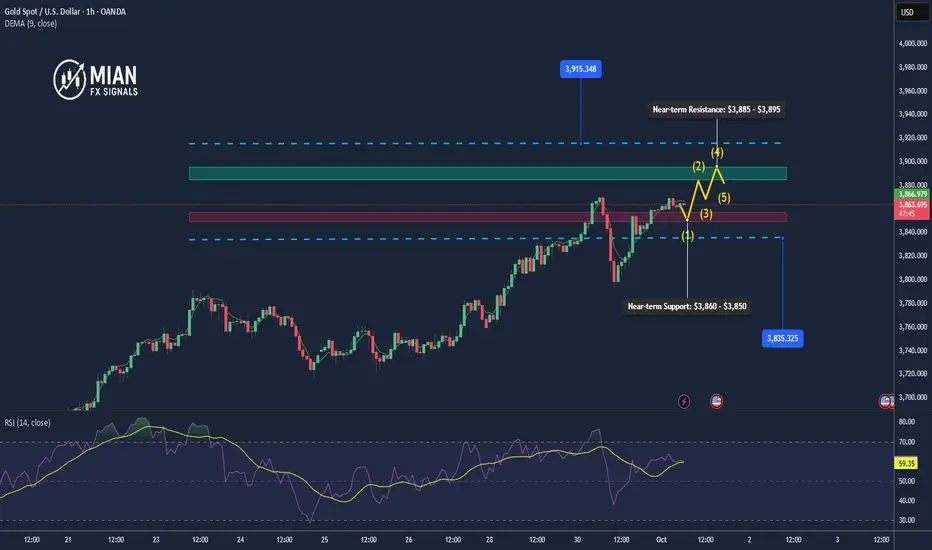
Short-term Bullish with Key Resistance Ahead📊 Market Overview
Gold is currently trading around $3,876.80/oz, after a strong rally in the previous session. Buying pressure remains stable as the USD shows signs of weakness, while safe-haven demand stays elevated. However, the market is cautious ahead of upcoming U.S. economic data releases.
📈 Technical Analysis
• Near-term Resistance: $3,885 – $3,895
• Strong Resistance: $3,915
• Near-term Support: $3,860 – $3,850
• Strong Support: $3,835
• EMA20 (H1): Price is holding above EMA20, indicating that the short-term uptrend remains intact.
• H1 Candlestick: Small-bodied candles suggest slowing bullish momentum, with potential for a technical pullback before resuming the trend.
📌 Outlook
Gold maintains a short-term bullish trend, but the $3,885–$3,895 zone will be a key challenge. A breakout above this level could drive price toward the psychological $3,900 mark and further to $3,915. Conversely, if profit-taking increases, price may retest the $3,860–$3,850 support zone.
🎯 Trading Strategy
🔺 BUY XAU/USD: $3,845 – $3,850
• 🎯 TP: 40 / 80 / 200 pips
• 🛑 SL: $3,840
🔻 SELL XAU/USD: $3,885 – $3,895
• 🎯 TP: 40 / 80 / 200 pips
• 🛑 SL: $3,900
Keep quite and go long on Gold XAUUSDOANDA:XAUUSD
Keep quite.. and long on gold..
target 4000 usd for the gold seems not fart... keeping the geopolitical headwinds

3875-3850 sell high and buy low,break to determine the directionGold continued to rise during the day and then fell into a narrow range of fluctuations after hitting the high of 3870. Initially, we expected gold to form a double top pattern, suggesting a potential sharp decline. But brothers, do you remember that I have repeatedly emphasized recently that the US government is facing the risk of shutdown? Yes, the U.S. federal government officially shut down at 12:01 a.m. Eastern Time on Wednesday because Democrats and Republicans failed to reach an agreement on a short-term spending plan.
As I mentioned before, a government shutdown would impact the release of important data such as ADP and NFP. The NFP data, originally scheduled for Friday, may not be released on time. At the same time, the government shutdown will also have a certain impact on the US economy, which will indirectly affect the gold trend. This is why VIP members and I chose to change the TP to 3855 and exit the market with profits.
Judging from the market trend, the current gold rising channel has not been broken, and gold is still in a bullish trend in the short term. Key support is at 3850; as long as this level holds, the bullish outlook remains. Pay attention to the pressure of 3870-3875 on the upside. Once it breaks, the gold price will test the channel pressure of 3890-3900.
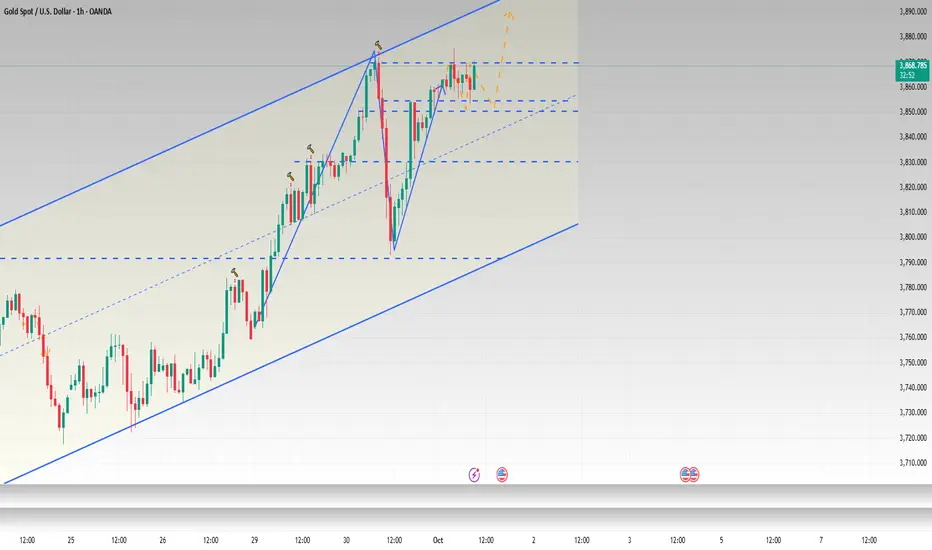
Gold Futures Bullish Setup – Entry at Demand Zone1. Channel Formation
The price is moving inside a rising parallel channel (blue lines).
Recently, the price broke below the midline (dashed blue) of the channel, indicating short-term weakness.
2. Trade Setup: Long (Buy) Position
The chart indicates a bullish outlook, expecting a price reversal from the demand zone.
🔹 Entry Zone
Entry Price: ₹116,251 – ₹116,277
This is marked with a grey zone, which aligns with a support area and previous consolidation.
🔻 Stop Loss (SL)
Stop Loss Price: ₹115,705 – ₹115,729
Placed just below the lower boundary of the support zone to protect against a false breakout.
🎯 Target (TP)
Target Price: ₹119,331 – ₹119,338 (LABA target point)
This lies above recent highs and near the upper boundary of the channel, suggesting continuation of the bullish trend.
3. Risk-Reward Ratio
The blue shaded box indicates a reward zone.
The trade has a favorable Risk-Reward Ratio (RRR) > 2:1, which is considered a strong setup.
🧠 Interpretation & Strategy
The red curved arrow indicates expected price action: a short-term pullback into the demand zone, followed by a bullish bounce toward the target.
The structure suggests a buy-the-dip opportunity within an ongoing uptrend.
⚠️ Key Takeaways
Component Value (INR)
Entry Zone 116,251 – 116,277
Stop Loss 115,705 – 115,729
Target 119,331 – 119,338
Trend Bullish inside channel
Risk/Reward Favorable (>2:1)
✅ Conclusion
This setup represents a bullish continuation pattern. If price revisits the highlighted demand/support zone, and forms bullish reversal candles (e.g., hammer, bullish engulfing), it could offer a high-probability long entry toward the upper end of the channel near ₹119,338.

Gold 1H – Correction or Continuation After Supply Test?Gold on the 1H timeframe is trading near 3,861 after consolidating below a premium supply zone at 3876–3874. Structure shows a recent BOS to the upside, but current rejection signals potential engineered liquidity sweeps into the nearby FVG and discount demand zones. The first support rests at 3796–3798, aligning with discount territory and previous accumulation, offering scope for continuation if price reacts positively.
From the macro side, today’s headlines point to persistent U.S. dollar strength as traders await fresh Federal Reserve guidance on inflation and rate path. Meanwhile, heightened geopolitical concerns in energy markets are maintaining safe-haven flows, adding volatility to gold’s intraday swings.
This dual backdrop sets up a tactical approach: fading rejections at supply while being prepared to enter on discounted dips at demand.
________________________________________
📌 Key Structure & Liquidity Zones (1H):
• 🔴 SELL GOLD 3876–3874 (SL 3883): Premium supply zone, downside targets at 3850 → 3835 → 3815.
• 🟢 BUY ZONE SUPPORT 3796–3798 (SL 3790): Discount demand zone aligned with BOS, upside targets at 3820 → 3845 → 3860+.
________________________________________
📊 Trading Ideas (Scenario-Based):
🔻 Sell Setup – Supply Rejection (3876–3874)
• Entry: 3876–3874
• Stop Loss: 3883
• Take Profits:
TP1: 3850
TP2: 3835
TP3: 3815
🔺 Buy Setup – Demand Mitigation (3796–3798)
• Entry: 3796–3798
• Stop Loss: 3790
• Take Profits:
TP1: 3820
TP2: 3845
TP3: 3860+
________________________________________
🔑 Strategy Note
Gold remains in a corrective phase after testing supply. Expect liquidity sweeps into discount levels before continuation. With the dollar strengthening and Fed commentary in focus, intraday traders should:
• Fade supply rejections at 3876–3874.
• Scale into buys around 3796–3798 if liquidity is cleared.

Is This the Start of Gold’s Next Major Upside Trend?✨ GOLD vs USD Market Wealth Strategy Map (Swing Trade) ✨
🟡 Asset: XAU/USD (Gold vs U.S. Dollar)
📈 Plan: Bullish Outlook
The Thief Strategy 🥷 is in action — using a layering style of limit orders (multiple staged entries). Instead of a single "all-in" shot, we scale in like a smart thief sneaking layer by layer.
🔑 Entry (Layered Style):
Possible levels: 3720 / 3730 / 3740 / 3750 (you can increase layers depending on your own plan).
The idea: Build positions gradually instead of chasing the candle.
🔒 Stop-Loss Zone (Protect Capital):
3680 (nicknamed the “Thief SL” 🚨).
⚠️ Note: This is just my reference level. Please adjust to your own risk style — don’t just follow blindly.
🎯 Target (Profit-Taking Zone):
3860 (Trend Flip Alert ⚡ – High Voltage Zone).
Why? This area aligns with resistance + potential overbought conditions + trap vibes. That’s where I expect smart thieves to escape with their bags 💼.
💡 Reminder for the Thief OGs: I’m not recommending you copy my SL/TP blindly. The market is your playground — grab your profits your way, manage your risk your way.
🔎 Related Pairs to Watch (Correlation Radar)
TVC:DXY (U.S. Dollar Index) → Strong inverse correlation with Gold. If DXY weakens, XAU/USD often rallies.
TVC:SILVER (XAG/USD) → Precious metals move in packs. Silver strength can be a leading indicator for Gold.
BLACKBULL:WTI (USOIL/USD) → Energy inflation links can push Gold higher as a safe haven.
SP:SPX (S&P 500 Index) → Risk-on/off sentiment. Equity weakness often boosts safe-haven demand for Gold.
📌 Key Takeaways:
Thief Strategy = Layered limit order entries (smart scaling).
🚨 Protect your capital with personalized SL — don’t just copy mine.
⚡ Watch for resistance traps near 3860.
📊 Always monitor correlated assets like DXY, Silver, Oil, S&P 500.
✨ “If you find value in my analysis, a 👍 and 🚀 boost is much appreciated — it helps me share more setups with the community!”
📜 Disclaimer: This is a Thief Style Strategy shared just for fun & educational vibes. Not financial advice. Trade responsibly and manage your own risk.
#XAUUSD #GOLD #SwingTrading #TradingStrategy #LayeringStrategy #ThiefStyle #Forex #Commodities #TradingView

Gold Holds Near Record Highs📊 Technical Structure
TVC:GOLD (XAU/USD) continues to consolidate near its all-time high, with price currently trading around $3,863 after retreating slightly from the peak. The chart shows a clear bullish channel, with immediate Support Zone at $3,840–$3,847 and a Resistance Zone at $3,900–$3,905. Any corrective dips into the support area are likely to attract fresh buying, keeping the upside bias intact.
🎯 Trade Setup
Entry: $3,847 (near support retest)
Stop Loss: $3,836 (below channel and support zone)
Take Profit: $3,905
R:R Ratio: ~1 : 5.13
🏦 Macro Background
Gold’s bullish momentum is underpinned by three key themes:
US Government Shutdown Risk – A Republican spending bill failed in the Senate, increasing the likelihood of a partial shutdown, which supports safe-haven demand.
Dovish Fed Expectations – Markets are pricing in a 95% chance of a rate cut in October and a 75% chance of another in December, keeping USD under pressure.
Geopolitical Risks – Rising tensions over US missile supplies to Ukraine and Middle East instability continue to drive safe-haven flows into bullion.
Together, these fundamentals reinforce gold’s upside bias, making dips attractive for buyers.
🔑 Key Technical Levels
Resistance Zone: $3,900 – $3,905
Support Zone: $3,840 – $3,847
📌 Trade Summary
Gold remains in a bullish consolidation phase near record highs, with the path of least resistance to the upside. A retest of the $3,840–$3,847 support zone may provide a solid long opportunity targeting $3,900+. Fundamentals continue to support safe-haven demand and weaken USD, keeping gold well-bid.
⚠️ Disclaimer
This analysis is for reference only and does not constitute trading advice. Trading involves significant risk, and proper risk management is essential.

Gold's 8hr 100ema retests...Looking at gold's behavior from Mar 2025, gold tested 8hr 100EMA before resuming its push higher.
The 8H 100EMA retests provided “buy-the-dip” areas while the Monthly trend stayed intact.
Traders who bought those retests often caught continuation legs toward new highs in Mar–Apr 2025.

LiamTrading – Gold continues its “madness”LiamTrading – Gold continues its “madness”: Strong trend, but awaiting reaction at 3900
Gold has just recorded its 39th all-time high in 2025, now approaching the 3,900 USD/oz mark. This is not only a significant psychological threshold but also coincides with extended Fibonacci levels, making this area a sensitive market point.
Trend & Trendline
On the H4 chart, gold remains firmly within the upward channel formed since early September. Prices consistently bounce off the lower trendline and expand towards the upper boundary.
The lower trendline around 3760–3780 acts as dynamic support. If prices break below this area, a deeper correction scenario towards 3720–3730 will be triggered.
The upper trendline is currently “pressing” prices right at the 3897–3900 area, converging with Fibonacci 2.618. This is a strong resistance, potentially causing profit-taking reactions and creating a technical pullback.
Volume Profile & Liquidity
The 3800 and 3720 areas are dense volume clusters, indicating that large capital flows are positioned here. These are also potential Buy zones when prices correct.
The 3640–3650 area is a larger liquidity cluster, but will only be activated if there is a strong breakdown from the current trendline.
Reference Trading Scenario
Sell zone: 3897 – 3900, SL 3905, TP 3885 – 3862 – 3850 – 3833
Short-term Buy zone: 3797 – 3800, SL 3793, TP 3822 – 3840 – 3855 – 3872 – 3890
Medium-term Buy: 3720 – 3730, SL 3710, TP 3760 – 3800 – 3850
Conclusion
The upward trend remains very strong, but the 3897–3900 area will be a crucial challenge. If prices are rejected here, we may witness a correction back to the lower trendline before gold continues towards the larger target of 4000 USD.
This is my personal view on XAUUSD. Please manage risk carefully and stay updated with the latest scenarios.

XAU/USD) Bullish trend analysis Read The captionSMC Trading point update
Technical analysis of XAU/USD (15m timeframe) chart analysis:
---
Bullish Gold Setup
Chart Pattern: Price broke out of a triangle consolidation after retesting the order block (OB, yellow zone). This signals accumulation before continuation.
Order Block (OB): The zone around 3,836 – 3,840 acted as a strong demand area. Price respected it and bounced back.
EMA Support:
50 EMA (red) is sitting just above the OB, providing short-term support.
200 EMA (blue) is trending upward, confirming underlying bullish bias.
Projection: The breakout is expected to expand higher toward the measured move target.
---
Target Point
3,883.44 is the projected upside target.
This aligns with the breakout projection and prior liquidity grab zone.
Mr SMC Trading point
Trading Idea
Bias: Bullish.
Entry Zone: Pullback toward 3,836 – 3,840 OB for confirmation.
Target: 3,883.
Invalidation: A breakdown below 3,816 (200 EMA) would invalidate the bullish setup and suggest deeper retracement.
Please support boost 🚀 this analysis

XAU/USD) Bullish trend analysis Read The captionSMC Trading point update
Technical analysis of Gold (XAU/USD) 30-min chart you shared:
---
Gold (XAU/USD) – Bullish Setup (M30 Chart)
Market Structure:
Price is moving inside a bullish ascending channel.
Current retracement is pulling back toward a fair value gap (FVG, H4) highlighted in yellow.
Price is still holding above the 50 EMA (3806.16) and 200 EMA (3766.40), both sloping upward → confirming bullish momentum.
Key Levels:
Support Zone (Demand / FVG H4): 3810 – 3820 region (yellow box).
EMA 50: Acting as dynamic short-term support around 3806.
EMA 200: Stronger bullish base at 3766.
Target Point: 3857.19 (resistance zone & top of channel).
Price Expectation:
Likely scenario:
Price may retrace into the FVG support zone → bounce upward → continue inside the channel toward the target point 3857.
As long as the structure holds above 3806 (EMA 50), the bullish setup remains valid.
Mr SMC Trading point
---
Bias: Bullish
Target: 3857.19 Key Support: 3810 – 3820 zone (FVG + EMA confluence)
Please support boost 🚀 this analysis

Gold RollerCoasterLike posted before we bounced off the trend line from todays low of $3,793 to 3,854. We did good there. Profiting in the NY market open. Support looks to build volume around $3,836. With mixed data this should rebound us back into London session highs around $3,870 and where I believe will be the top of tops at $3,880 before a sell off begins. Remember this is the last day of the month before a possible red October.
Good Luck To All, This is not financial advice
-R2C

Gold rebounds after a drop to $3794📌 Market Movement:
Today, gold sharply dropped to the $3794 level but quickly rebounded and is now trading around $3803. This indicates some dip-buying interest at short-term support, though selling pressure has not completely faded.
📊 Technical Analysis:
• Short-term support: $3794 – $3790
• Near-term resistance: $3810 – $3815
• EMA 50 on H1 remains an overhead barrier.
• The H1 candlestick shows a long lower wick, reflecting buying pressure at the lows.
🔎 Outlook:
Gold is consolidating in a narrow range after rebounding from $3794. If it holds above $3798, the recovery could extend toward $3810 – $3815. Conversely, a break below $3794 would bring back downside pressure.
🎯 Trading Strategy Suggestion:
• Prefer to stay cautious and wait for clear confirmation.
• BUY around $3794 – $3798 if price holds above support.
o TP: $3810 – $3815
o SL: $3790
• SELL if price fails to break $3815 and shows reversal signals.
o TP: $3800 – $3795
o SL: $3818
