BULLISH ON GOLDPrice is in Daily FVG and bearish momentum starts slowing down on 1H Timeframe. Entry off London Low sweep with rejection.
Goldlong

Xau/Usd - Gold turn to Bull runGold time to Long..
buy 3364
SL 3361
TP 3377
Xau/Usd Bull Run started

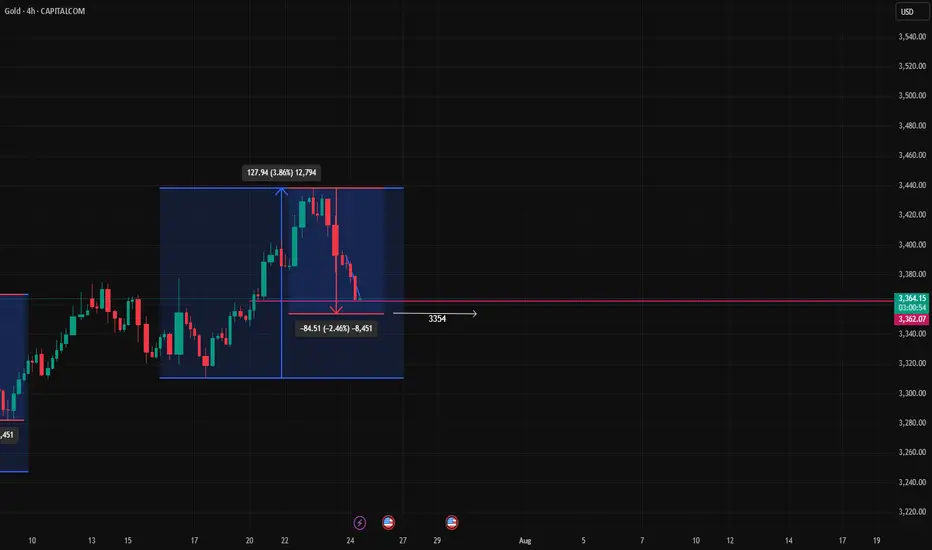
"Gold's Repeat Pattern: Two Impulses, Two Pullbacks – What's NexThis **4-hour Gold (XAU/USD)** chart shows a classic **price action structure** with two major impulsive waves followed by corrective pullbacks. Here's a breakdown using **price action principles**:
🔹 **1. Impulsive Rally #1 (Left Box)**
* **Price surged** by approx. **119.55 points (+3.68%)**, forming strong bullish candles with little to no wick on top — a sign of **buyer dominance**.
* The move was sharp, indicating **strong momentum** and **break of previous lower highs**, suggesting a possible **market structure shift** to bullish.
🔻 **2. Correction #1**
* The rally was followed by a **retracement of -84.51 points (-2.51%)**.
* Price made **lower highs and lower lows** within this box — indicating a **corrective pullback**, not a reversal.
* It respected previous support zones, which shows **buyers still in control**.
### 🔹 **3. Impulsive Rally #2 (Right Box)**
* Price then made a **new higher high**, rising **127.94 points (+3.86%)**.
* Strong bullish candles again appeared with follow-through — confirming **bullish order flow**.
* The **break of the previous swing high** confirms a **bullish structure continuation**.
### 🔻 **4. Correction #2 (Ongoing)**
* Current price is in a **retracement phase** of around **-84.51 points (-2.46%)** — nearly identical in size to the first correction.
* The correction is forming **lower highs and lower lows**, with potential for **bullish reaction near the previous support or demand zone**.
* The **market is testing previous structure** (support level near \$3360–\$3370) — a key area for **bullish reversal confirmation** (watch for pin bars or bullish engulfing patterns).
📌 **Price Action Summary
* **Structure**: Higher highs, higher lows — confirms **uptrend**.
* **Corrections**: Controlled and proportional — shows **healthy trend**.
* **Current Zone**: Price is testing **potential support**, watch for **bullish reversal signals** to catch next wave.
* **Bias**: Still **bullish**, unless structure breaks below recent swing low (\~\$3340).
---
✅ Traders’ Tip**: If bullish candles form at current support, it may present a **buy opportunity** with targets toward recent highs. Use proper risk management and watch for confirmation!
Correction is not bearish, buy on rebound at low levelToday is critical. Yesterday, gold fell under the pressure of 3396. The next 3396 area is very critical, and it will be relatively weak below it. If it goes up, the market rebound will expand. Pay attention to 3405 or 3420 area, with the focus on 3420. As long as it is below here, it will be mainly bearish. Breaking through 3420, the market is expected to continue to rise and break yesterday's high to test the 3450 area, and then seek to fall again. On the downside, pay proper attention to the 3380 area, which is short-term support; the focus is on the 3370~3365 area, which is the next bull-bear watershed.
The daily line fell yesterday and included the previous day's big positive rise, which represents the current high-level fluctuation of the price. At present, we need to pay attention to the lower moving average support corresponding to SMA10 at 3367, while the moving average SMA30 is around 3351-53, the middle track is at 3344, and the moving average SMA60 is at 3330.
From the daily level: today's decline will not fall below 3351-53, and it is likely to be around 3367-70. We have the opportunity to participate in long orders near 3370.
Therefore, if the price touches 3370-3365 for the first time during the day, you can consider going long, with the target at 3390-3400; if the downward trend of gold continues during the day, you can go long again at 3355-3353, defend 3345, and exit the market after earning a difference of $10-20.
OANDA:XAUUSD
Gold-----Buy around 3400-3410, target 3430-3450Gold market analysis:
The current highest gold buying has reached around 3438, which is the daily pressure level. This position is the high ground position that has touched the top many times before. The time to buy at these positions will not be long. There have been many dives before. However, as far as the current trend is concerned, the general trend is still buying, and short-term operations still have to buy. The daily buying is still not enough and closed positive again. The daily moving average began to diverge. Today's idea is to follow the buying first. I estimate that gold will enter a large game structure repair below 3451. In theory, short-term buying can be done, but the difficulty of intercepting on both sides will be more. You can keep buying at a low price in the short term. If it breaks 3400, it will turn weak.
Our idea is to find buying opportunities above 3400-3410. The previous pattern was near 3405, and the daily moving average position was near 3390. The time and space for repair will be very large. If it breaks 3400, we need to think about whether it will enter a large technical adjustment.
Support 3400-3405, small support 3409, suppression 3438, 3445, 3451, the strength and weakness dividing line 3402.
Fundamental analysis:
Recently, it is all regular data, there is no big fundamentals and new news that can affect the market.
Operation suggestion:
Gold-----Buy around 3400-3410, target 3430-3450

XAUUSD I Potential Pullback and More GrowthWelcome back! Let me know your thoughts in the comments!
** XAUUSD Analysis - Listen to video!
We recommend that you keep this on your watchlist and enter when the entry criteria of your strategy is met.
Please support this idea with a LIKE and COMMENT if you find it useful and Click "Follow" on our profile if you'd like these trade ideas delivered straight to your email in the future.
Thanks for your continued support!

Gold surges! Gold prices soar!Market news:
In the early Asian session on Wednesday (July 23), spot gold fell slightly and is currently trading around $3,422/oz. Supported by the increasing uncertainty in global trade, the downward trend in U.S. Treasury yields and the weakening of the U.S. dollar, spot gold rose strongly, hitting a five-week high. The market's tension over the August 1 deadline for the implementation of U.S. President Trump's tariffs has intensified, driving safe-haven funds to continue to flow into the international gold market. Investors are focusing on the progress of the U.S. multilateral trade negotiations and the new round of tariffs that the Trump administration is about to launch: while the demand for safe-haven assets has increased, the U.S. 10-year Treasury yield has fallen to a two-week low, further enhancing the attractiveness of non-interest-bearing gold. The global economic slowdown, expectations of loose monetary policy and geopolitical risks will continue to support gold's status as a safe-haven asset. Looking ahead to the market this week, the market focuses on: the Fed's FOMC policy meeting will be held next week. Although the meeting is expected to keep interest rates unchanged, investors have begun to bet on the possibility of a rate cut in October; Fed Vice Chairman Bowman reiterated on Tuesday that the central bank should maintain policy independence, and Powell's upcoming policy meeting may release further signals; in terms of inflation, as signs of tariff costs being transmitted to consumer goods emerge, Powell has previously warned that inflation may accelerate again in the summer.
Technical Review:
Gold maintained its expected bulls and hit a new high yesterday. The daily line maintained a long-term structure of consecutive positive bulls. The MA10/7-day moving average opened upward, and the RSI indicator ran above the central axis. The Bollinger Bands of the hourly and four-hour charts opened upward, the price maintained the middle and upper track channel, and the moving average system opened upward. The idea of gold trading remains unchanged, and the layout is mainly based on buying at a low price and selling at a high price. After a sharp rise last night, gold began to fluctuate at a high level in the second half of the night, and the adjustment was very small, which means that the market is still the strong market. The recent pattern of gold price fluctuations and rises remains. Since it is fluctuating upward, the overall trend of gold today is still biased towards buying, but we need to be alert to the risk of short-term corrections. It is recommended to arrange buy orders based on technical support levels, and pay attention to trade policies and the Fed's trends!
Today's analysis:
Gold buying has been as strong as a rainbow in the past two days, and it is also a buying carnival. Gold is now buying strongly and the momentum is winning. Once the trend is formed, it is necessary to follow the trend. Now the trend of gold buying is very obvious, constantly refreshing the recent highs, so continue to buy gold to the end, and continue to buy if it rises. Continue to buy if it falls during the day!
The gold 1-hour moving average continues to form a golden cross upward buying arrangement. The gold buying power is still there, and gold continues to exert its strength. Gold has risen step by step in the past two days. As long as there is no sharp decline, it is accumulating momentum to attack. The gold support continues to move up. Now it has broken through and stabilized at the 3400 line. If gold falls back to 3400, it can still be bought at low prices.
Operation ideas:
Short-term gold 3400-3403 buy, stop loss 3392, target 3420-3440;
Short-term gold 3438-3441 sell, stop loss 3450, target 3400-3380;
Key points:
First support level: 3412, second support level: 3403, third support level: 3390
First resistance level: 3438, second resistance level: 3450, third resistance level: 3468

XAU/USD(20250723) Today's AnalysisMarket news:
White House officials plan to visit the Federal Reserve headquarters on Thursday local time.
Technical analysis:
Today's buying and selling boundaries:
3416.02
Support and resistance levels:
3465.76
3447.17
3435.12
3396.94
3384.89
3360.33
Trading strategy:
If the price breaks through 3435.12, consider buying, the first target price is 3447.17
If the price breaks through 3416.02, consider selling, the first target price is 3396.94

Gold Likely to Rise as USD Weakens📊 Market Overview
Spot gold (XAU/USD) is trading around $3,423–$3,427/oz, down ~0.2% after news of a US–Japan trade deal boosted risk sentiment. However, a weaker USD and lower US bond yields continue to support safe-haven demand.
📉 Technical Analysis
• Resistance: $3,447 – $3,464 – $3,496
• Support: $3,399 – $3,367
• EMA9: Price is below EMA9 → short-term bearish; medium-term outlook remains bullish if price reclaims EMA20.
• Momentum indicators: RSI ~69; MACD & ADX favor buyers.
📌 Outlook
Gold may move sideways or edge higher if USD weakness persists. A rise in risk appetite (e.g. from trade deals) could pressure prices short term.
💡 Suggested Trading Strategy
🔻 SELL XAU/USD: $3,442–$3,445
🎯 TP: 40/80/200 pips | ❌ SL: $3,449
🔺 BUY XAU/USD: $3,402–$3,405
🎯 TP: 40/80/200 pips | ❌ SL: $3,399

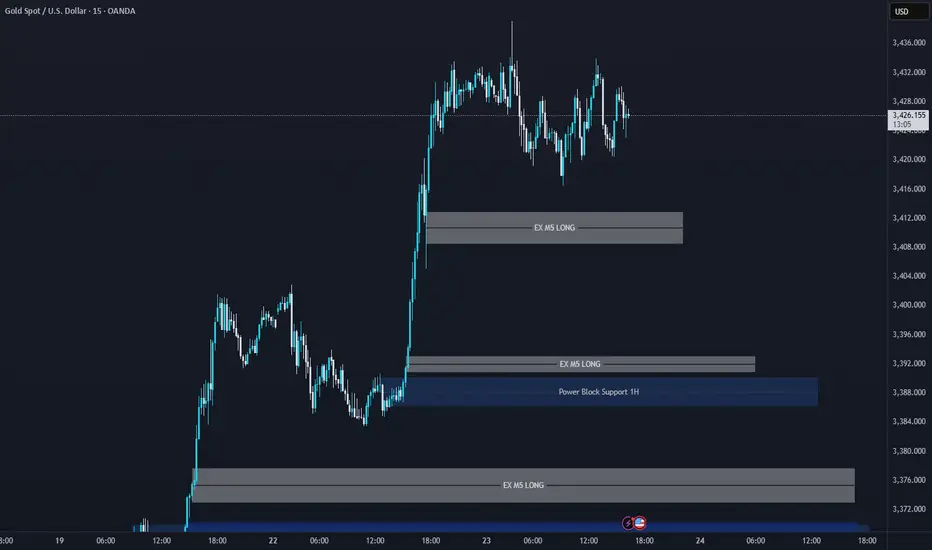
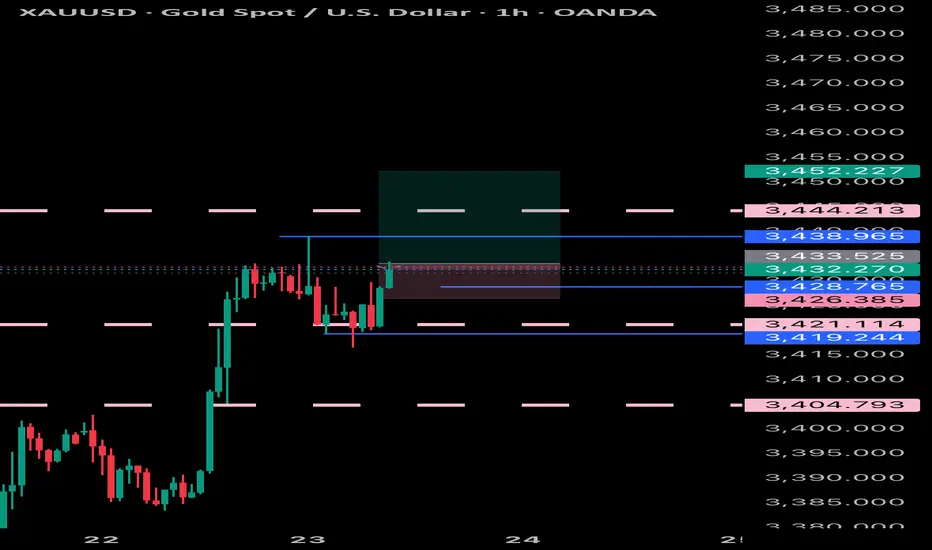
XAUUSD Support & Resistance Levels🚀 Here are some key zones I've identified on the H1/M15/M5 timeframe.
These zones are based on real-time data analysis performed by a custom software I personally developed.
The tool is designed to scan the market continuously and highlight potential areas of interest based on price action behavior and volume dynamics.
Your feedback is welcome!
XAU/USD) Bullish trend analysis Read The captionSMC Trading point update
Technical analysis of Gold (XAU/USD) on the 1-hour timeframe. Here's a breakdown of the key trading
---
Technical Overview
Price: $3,428.71 (currently near the upper consolidation)
EMA 200: Around $3,367.38 (well below price, indicating strong uptrend)
Target Point: $3,468.52
Indicators:
RSI (14): 60.19–62.55 → shows moderate bullish momentum, not yet overbought.
---
Key Technical Elements
1. Bullish Breakout Structure:
Price has broken out of a previous range, and is forming a bullish flag or rectangle, which typically leads to continuation higher.
Measured move projection from previous leg (approx. $51.57 gain) targets the $3,468.52 level.
2. Strong Support Zones:
Two yellow zones highlighted:
Upper support level (around $3,415): acting as immediate structure support.
Lower key support (around $3,380): crucial structure level from where the trend initiated.
3. Trend Line Support:
A clearly marked ascending trend line supporting higher lows—indicating bulls are in control.
Expect price to stay above this trend line to maintain bullish bias.
4. Volume & RSI Confirmation:
RSI remains in a bullish zone but isn’t overbought → leaves room for upside.
Volume remains steady, confirming healthy consolidation.
Mr SMC Trading point
---
Conclusion & Trade Idea
Bias: Bullish
Entry Zone: On breakout or retest of minor support ($3,415–$3,420)
Stop Loss: Below trendline or below $3,415
Target: $3,468.52
Confirmation: Hold above trendline + RSI staying above 50
This is a classic bullish continuation setup supported by structure, RSI, and trend momentum. Traders could look for buying opportunities on minor dips or trendline retests.
---
Please support boost 🚀 this analysis)

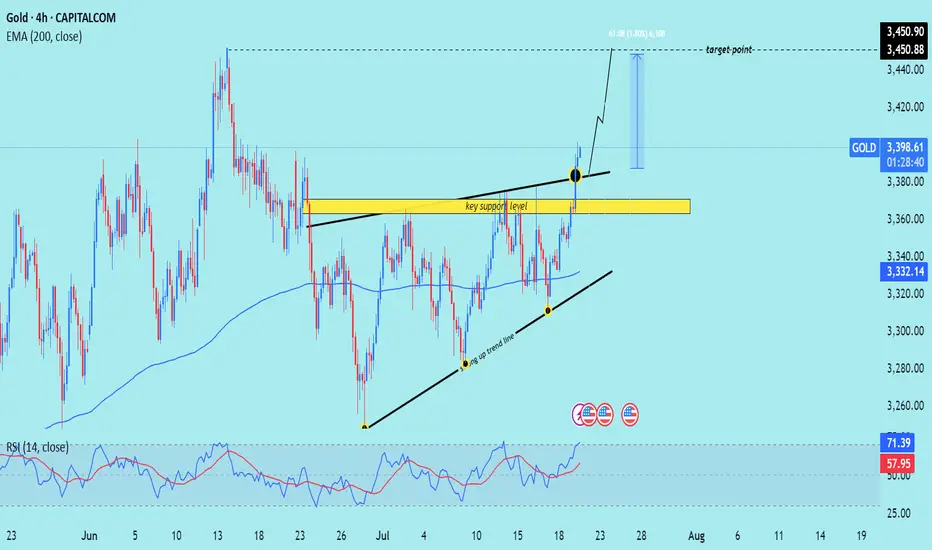
XAU/USD) breakout analysis Read The captionSMC Trading point update
Technical analysis of (XAU/USD) on the 4-hour timeframe, highlighting a move toward the $3,450 target. Here's the full technical breakdown
---
Technical Analysis – Gold (4H)
1. Breakout from Resistance Zone
Price has broken above a key horizontal resistance level (now turned support, marked in yellow).
The breakout is confirmed by a strong bullish candle with momentum, suggesting buyers are in control.
2. Ascending Triangle Formation
Price formed an ascending triangle, a classic bullish continuation pattern.
The breakout above the upper boundary confirms the pattern, projecting a potential measured move.
3. Trendline Support & Higher Lows
The structure shows a rising trendline (black), where price bounced multiple times — confirming a higher low sequence.
The confluence of trendline support + breakout level adds strength to the bullish case.
4. 200 EMA Confluence
The 200-period EMA (3,332.13) has been acting as a dynamic support throughout.
Price retested it earlier in the move, then surged upward — validating trend continuation.
5. RSI Indicator
RSI is at 71.13, entering overbought territory.
This implies strong bullish momentum, but a short-term pullback to retest the breakout level is possible.
6. Target Projection
Target Point: $3,450.90, calculated from the height of the triangle (~61 pts or 1.80%) added above the breakout zone.
A retest of the breakout area (yellow zone) around $3,370–$3,380 could offer a better entry before continuation.
Mr SMC Trading point
---
Summary
Bias: Bullish
Current Price: $3,397.62
Support: $3,370–$3,380 zone (previous resistance turned support)
Trend: Higher lows + breakout above resistance
EMA Support: 200 EMA at $3,332.13
Target: $3,450.90
RSI: 71.13 – bullish but near overbought
Please support boost 🚀 this analysis)
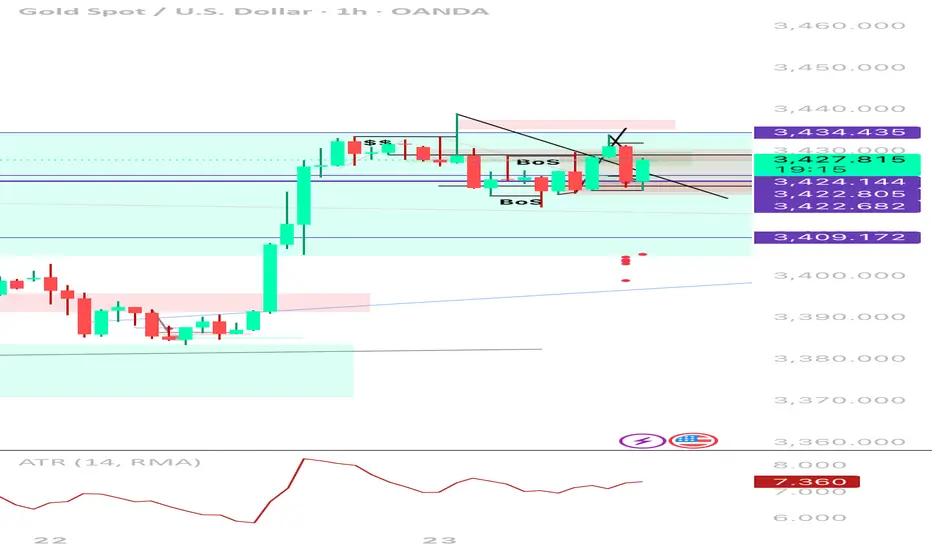
XAUUSD 1H | Sell TP Hit → Now Flipping Long After Liquidity SweeSmart Money Buy Setup | 1H Execution | Reversal from Demand Zone
Just hit full TP (396 pts) on a clean short from 3,434. Now flipping bias to long after price tapped into a key 4H OB and demand zone near 3,422. Price swept downside liquidity, mitigated the imbalance, and is now showing bullish intent.
⸻
🔄 Trade Narrative:
• ✅ Sell-side liquidity swept below previous HLs
• 🧱 Price tapped into 4H Order Block + FVG zone
• 💧 Internal liquidity vacuum filled (3,422–3,409)
• 🔁 Potential 1H BOS to the upside forming
• 🕯️ Bullish wick reaction from demand = early entry signal
• 📉 ATR low + building pressure = potential expansion incoming (likely NY)
Buy plan:
Entry Zone
3,422–3,424 (with confirmation on BOS)
Stop Loss
Below 3,409
TP1
3,434.435 (prior supply tap)
TP2
3,439.210 (range high)
TP3
3,455–3,460 (weekly extension target)
📌 Why I’m Flipping:
Price didn’t just reject randomly — it reacted exactly where smart money would’ve wanted to rebalance after the previous long impulse. This is the textbook scenario where you don’t marry a bias — just follow liquidity and structure.
🧠 Key Lessons:
• Don’t force continuation when the market is clearly absorbing
• Liquidity grabs often lead to strong reversals — watch BOS to confirm
• Same zone that gave you your TP? Can give you your next entry 💡
🔖 Tags:
#XAUUSD #SmartMoney #LiquiditySweep #OrderBlock #BreakOfStructure #BuySetup #PriceAction #1HChart #GoldTrading
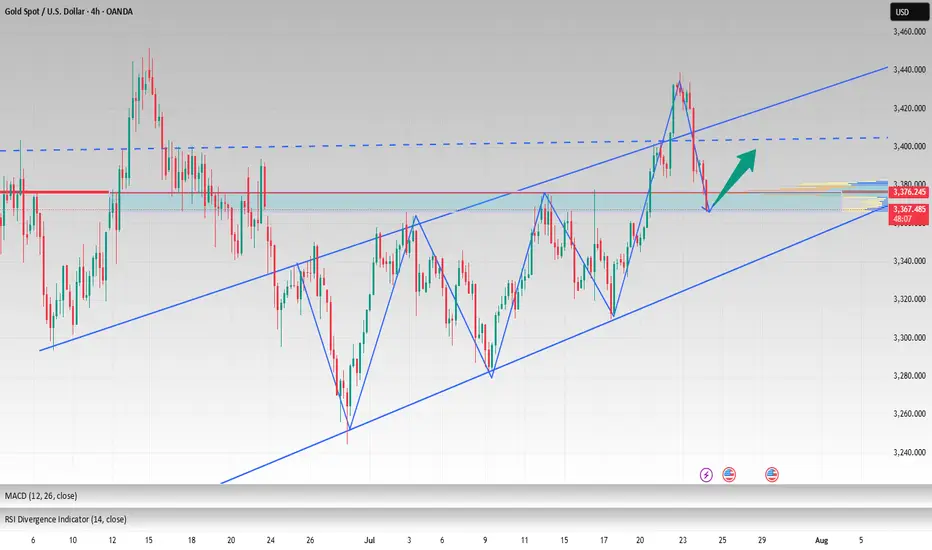
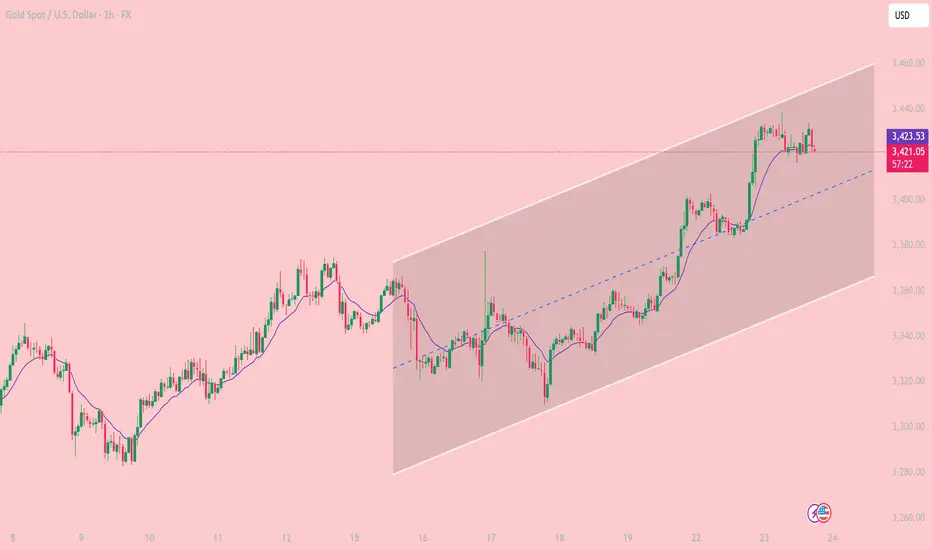
Bullish Channel in Play Key Trading Zones and Strategy for JulyOn the 1-hour chart, XAUUSD is clearly moving inside a well-defined ascending price channel, with price respecting both the channel boundaries and the midline as dynamic support/resistance. The pair continues to print higher highs and higher lows, confirming short-term bullish structure.
Trend Channel: Since July 18, gold has been steadily climbing within an ascending channel, bouncing off the lower boundary and riding above the midline.
EMA Support: The 10-period EMA (purple) has been acting as a dynamic support. Price has yet to close below it during this bullish swing.
Candle Behavior: Recent bullish candles with strong bodies show that buyers still have control, although price is stalling near the upper boundary of the channel.
Technical Level
3,459 USD. Major Resistance. Top of the channel – potential reversal or take-profit zone
3,423 USD.Immediate Support. EMA10 and current consolidation area
3,400 USD. Mid-Channel Support. Key pullback zone if price rejects near highs
3,360 – 3,365 USD. Major Support. Bottom of the ascending channel – break may invalidate bullish setup
Scenario 1 – Buy the Dip (trend continuation):
Wait for price to retest the 3,400 – 3,410 USD area or EMA10.
Look for bullish confirmation (e.g., pin bar, bullish engulfing).
Target: 3,445 – 3,459 USD
Stop loss: below 3,395 USD
Scenario 2 – Short at Channel Top (mean-reversion setup):
Monitor price behavior near 3,455 – 3,459 USD resistance.
If bearish reversal candles appear (e.g., shooting star, bearish engulfing), consider shorting.
Target: 3,420 – 3,410 USD
Stop loss: above 3,465 USD
As long as price remains inside the rising channel, buying pullbacks is the preferred strategy.
Stay alert to macroeconomic catalysts (Fed comments, PMI data, labor market releases) that could increase volatility.
Gold remains in a strong short-term uptrend on the 1H chart. Trading in the direction of the trend with proper risk management continues to offer the best opportunities for intraday traders.
If you found this analysis useful, don’t forget to follow for more trading strategies and ideas!
XAUUSD: Fluctuation of $30/ounce. Do you want to know?Yesterday, I frantically notified followers to buy around 3366-3375, and the market finally rose to 3430. This is a huge profit. I will continue to update it in the Band Trading Center Research Institute later. If you don’t want to miss it, follow me. If you see it but are still not sure how to trade. Then you can leave me a message at the Swing Trading Center Research Institute. I will reply to you one by one when I see it.
This week, some followers have achieved weekly profits of 50%-268%. If your profit is not ideal. Or don’t know how to trade. Remember to like and follow. I will lead everyone to victory.
Buy around 3400-3410. When will it close? I will post the results on the Swing Trading Center. Stay tuned.

XAUUSD:3450-3500The probability of the same direction of the two histories is 95% similar. This shows one thing. The market may repeat history again.
So buy with me. The next target is 3450-3500

Gold Maintains Strong Momentum, Eyes 3435+📊 Market Drivers:
• Gold prices surged as the USD weakened further and U.S. bond yields dropped.
• Investors are increasingly betting that the Fed may cut interest rates in 2025, boosting demand for gold.
• Ongoing trade tensions and expectations of comments from Fed officials are adding to bullish momentum.
📉 Technical Analysis:
• Key Resistance: 3435 – 3440
• Nearest Support: 3410 – 3415
• EMA09: Price is above the EMA09 → confirms short-term uptrend
• Pattern & Momentum: Clean breakout from the 3383–3390 range with strong volume, bullish momentum continues
📌 Outlook:
Gold may continue rising in the short term if it holds above 3415. A pullback could offer a chance to re-enter long positions near new support levels.
________________________________________
💡 Suggested Trade Setup:
🔺 BUY XAU/USD: 3415 – 3418 (on pullback)
🎯 TP: 40/80/200 pips
❌ SL: 3412
🔻 SELL XAU/USD: 3435 – 3438 (key resistance)
🎯 TP: 40/80/200 pips
❌ SL: 3442

USDJPY is continuing its uptrend, let's BUY✏️ OANDA:USDJPY broke the price channel and continued its uptrend at 151,000. The previous h4 candle wick had a liquidity sweep to 147,000, showing that the buyers are dominating the market. The USDJPY trading strategy will mainly BUY to the old peak around 151,000. When the price breaks 147,000, a corrective downtrend will begin to form.
📉 Key Levels
Support: 148.200 - 147.200
Resistance: 150.100 - 151.100
Buy trigger: Breakout above 148,800
BUY 147,200 (buyer liquidity zone)
Target: 145,000
Leave your comments on the idea. I am happy to read your views.

XAUUSD scenario for 7/22/25 This is what I'm looking at today.
Market is overextended after the sharp run—I'm expecting a range or retrace before another strong push.

GOLD: Price Made A New HHLooking to buy gold, market structure is bullish on the H1 and H4. I went over 2 different scenarios in the video...
1. Pullback Entry (Preferred)
🟢Entry Zone: 3365–3380
TP1: 3432
TP2: 3450
TP3: 3475–3500 (extended target if momentum holds)
2. Breakout Buy (Aggressive)
Trigger: M15 breaks and closes above 3405–3410 with strong displacement.
Entry: Retest of breakout zone at 3402–3405
Same Targets
Don't forget to set those price alerts!

GOLD Will Keep Growing!
HI,Traders !
#GOLD keep trading in
An uptrend along the rising support
So as the pair is approaching
A the support we will be
Expecting a bullish rebound !
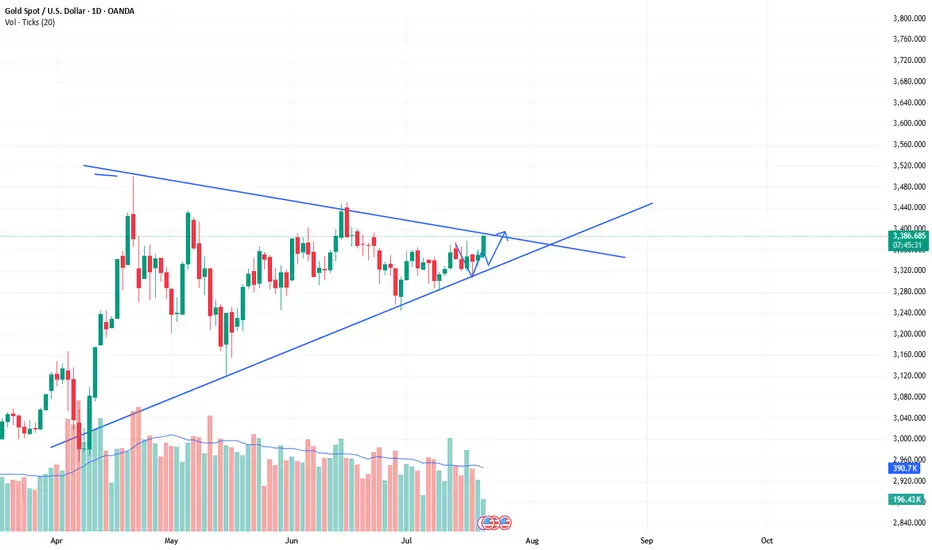
Comment and subscribe to help us grow !

The bull market of xauusd continues, buy and wait for the rise.As predicted in the band trading center in advance over the weekend. The daily level trend is still very stable, and the breakthrough trend has been perfectly carried out. The current quotation is 3388. It is only a matter of time before it rises wildly to the position of 3430. The short-term will definitely break through. The current bull market is clear and has huge potential. The limit of the triangle consolidation phase is about to be broken. Then the bulls will continue to rise. Therefore, buying is the key operation plan.