XAUUSD: The return of CPI and PPI newsAfter a series of absences from news, in today's trading session two CPI (Consumer Price Index) and PPI (Producer Price Index) will be announced. Therefore, OANDA:XAUUSD can be very volatile and we should be cautious in the last trading session of the week.
The CPI is forecast to be favorable for the dollar and the PPI is forecast to be slightly lower than the previous period , but we still need clearer confirmation to assess the trend of gold in the near future.
Some key levels that we need to pay attention to in today's trading session:
Resistance: , ,
Support:
Support:
Strong support:
Always be patient and wait for the price to reach the support and resistance zones above and get confirmation. Do not place limit orders or enter orders when the price is increasing or decreasing sharply.
Take advantage of the above support and resistance zones and trade short-term when the price reacts at these support and resistance zones.
Take profit when the price moves from 10 to 20 prices since entering the order at the support and resistance areas.
Wait for reactions such as Engulfing candles, Doji,... at the support and resistance zones.
Always set stop loss when trading and manage risks closely.
Note : Price may spike through support or resistance levels and then reverse. Therefore, it is crucial to patiently wait for the candle to close before entering a trade.
Victor Dan @ ZuperView
Goldmansachs

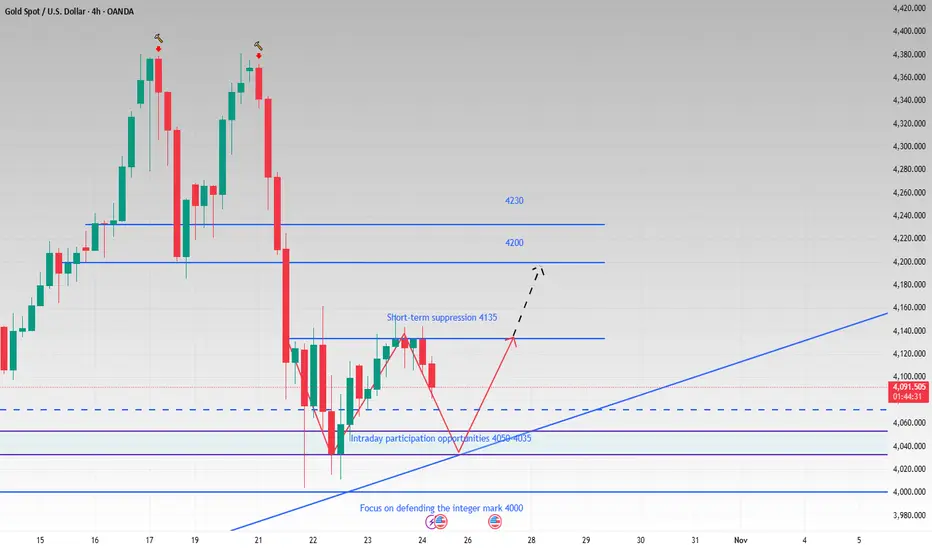
4H see W shape. Support is not broken and it is still bullish.Although gold has experienced a temporary pullback today, we remain bullish as long as the price remains above the upward trend line. While the hourly chart shows a downward trend, with moving averages diverging downward and technical indicators like the MACD forming a death cross, it appears that bears have regained control of the market in the short term.
But from the 4H perspective, if the short-term decline continues and it can effectively rebound after touching the trend line and move out of the W-shaped structure, then gold will be expected to hit the 4135-4145 pressure again, and then gradually hit the 4160, 4200 and other periodic resistance levels until the bulls return. As time goes by, the support points on the short-term trend line are constantly moving up. If it falls back to 4050-4035, try to go long on gold in batches with light positions, and the target is 4090-4130.
OANDA:XAUUSD
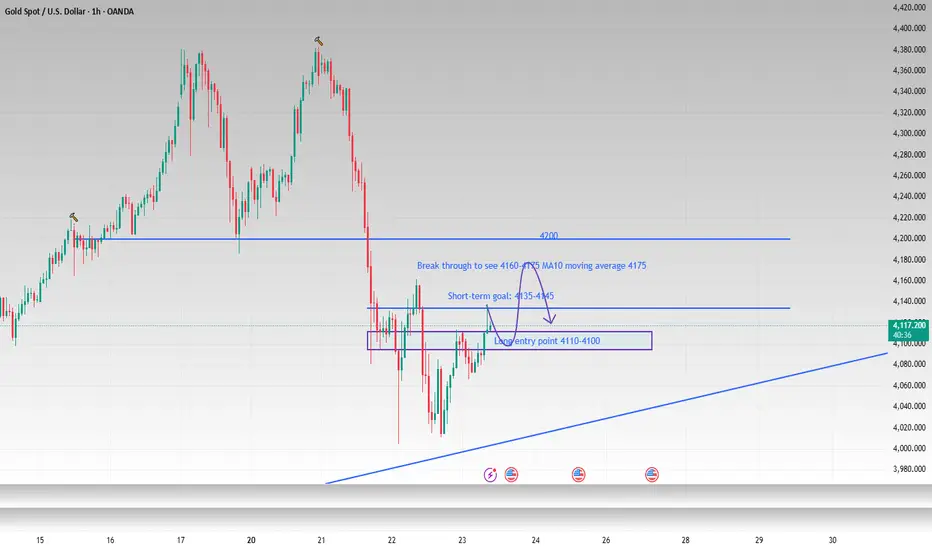
The trend line is not broken and the medium to long term is bull
Good morning, bros. Gold has fallen from its high of 4380, dropping nearly $380. This significant drop is relatively rare in the past six months. However, judging from the 4H cycle trend, the current gold price is still above the rising trend line. The 4000 mark is a defensive point for bulls. The decline will only continue after successfully breaking through 4000. Yesterday, the lowest point only retreated to around 4015-4005 before it began to rebound. Although it did not provide us with an ideal entry opportunity, it also confirmed the determination of the buyers below to hold on to the 4000 mark. Therefore, until a clear break below the trend line is achieved, our bullish outlook remains unchanged.
The gold price rebounded to around 4135 during the day and then fell back. As I told you yesterday, this position is a relatively dense trading area. I believe the current decline is the market accumulating strength to hit yesterday's rebound high, and it also provides us with a good opportunity to enter the long market. Pay attention to 4110-4100 below. If it retreats to this range, you can try to go long on gold in batches. The first target can continue to look at 4135-4145.
OANDA:XAUUSD
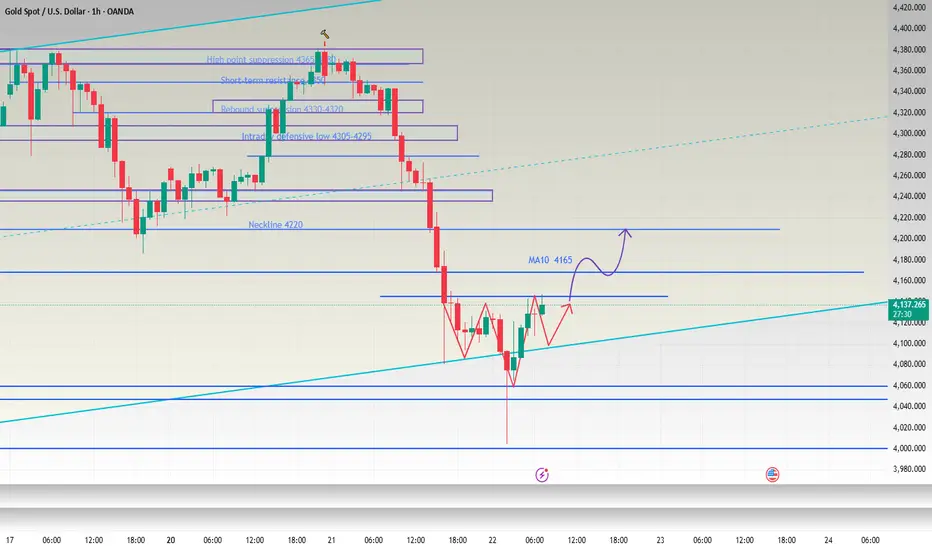
Look for a volatile upward correction of 4200-4220Good morning, bros. Although the market did not provide us with suitable trading opportunities last night, this did not prevent the market from confirming Allen's advanced trading vision. Even if the long orders at 4060-4050 were stopped out, the gold price still fell back to around 4000 as expected. Continuing to go long can not only turn losses into profits in one fell swoop, but also ensure substantial profits. how is it? Although we were unable to participate in this transaction, the final trend and results always prove the high accuracy of Allen's advanced trading vision and strategic analysis.
As the candle chart closed with a long lower shadow that was nearly twice the length of the body, the short-term bottom was found near 4000. Therefore, I believe that gold may be in a state of volatile upward repair today. After a rapid decline and rebound this morning, the current price is once again around 4120-4130. Judging from the hourly chart, there is a rudimentary form of a head and shoulders bottom pattern in the short term. If the gold price retreats again, thus prompting the formation of a head and shoulders bottom pattern, then when the gold price falls back to around 4105-4095, we can also try to go long on gold with a light position. If gold continues to rise, we will pay attention to the performance of 4160-4170 above, which is both a short-term resistance and the daily MA10 moving average. If the bulls want to return to the market, they must first stand firm on the MA10 moving average to have greater hope. Therefore, this resistance range is also the focus of our short-term attention. Once it stabilizes above the MA10 moving average, gold will be expected to rebound to 4200-4220.
OANDA:XAUUSD
Accurately grasp every trading opportunity,do you dare to followGold prices fell sharply in the evening due to the news, with a daily drop of nearly $300. Judging from the daily chart, the large real negative line almost swallowed up all the gains last week, and the bears have absolute control over the market.
Since this morning, Allen has been reminding everyone to pay attention to the M-shaped double-top structure and be alert to the possible sharp market correction. Even if you fail to keep up with our trading rhythm, as long as you refer to my ideas and read them carefully, you can at least effectively avoid being washed out by the market.
As gold continues to fall, various voices have appeared in the market. Bros must keep their eyes open when referring to them. After all, not everyone is as brave as Allen in facing mistakes and losses.
As I said, the bears are currently dominating the market. Although the decline has stagnated slightly in the short term, the downward trend has not completely stopped. It will be difficult for the bulls to recover all their lost ground tonight. The current gold price is hovering around 4110. If it continues to fall, you can pay attention to the short-term support of 4060-4050 below. Try to go long with a light position, set a stop loss, and look for support at the 4000 integer mark if it breaks.
OANDA:XAUUSD

What to do after the plunge? Strategy has been updatedGold opened higher today, testing the peak at 4381 before coming under pressure and declining. During the session, it pulled back to a low of 4317, rebounded to around the 4345 level, and then started a cascading drop. Currently, it is consolidating with fluctuations near 4266.
We have only executed one successful trade during the Asian session so far today, and all traders who followed the operation have gained good profits. As this wave of gold's decline is relatively rapid, for prudence, we can first observe the market temporarily and will inform everyone when there is an opportunity for operation.
Trading Strategy
Keep an eye on the trend during the European session.
If gold fluctuates weakly in the European session, we will go short when it rebounds in the US session.
If gold rebounds strongly in the European session, we will go long on gold when it pulls back in the US session.
I will update trading signals in real time in the channel. You can follow it if needed.
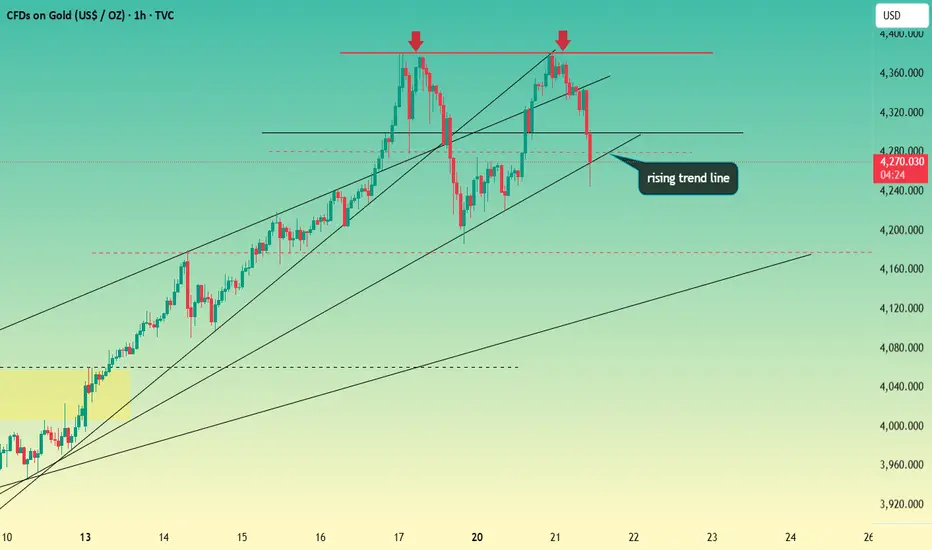
Big cycle M double top, beware of big pullbackGood morning, bros. Last night we proposed a strategy of short selling in batches if gold rises first and touches the upper pressure level of 4365-4380, and achieved good profits. After today's opening, gold rebounded to this range several times, and it can be said that it has basically recovered the losses since last Friday. However, the intraday rebounds have failed to effectively break through this resistance range. If the bulls want to fully counterattack and move towards the 4400 mark, they need to break through the upper resistance. Judging from the long-term trend, the market has a tendency to form an M-shaped double top, so be cautious in chasing the rise in intraday trading and beware of possible large market corrections.
Judging from the short-term trend, the resistance near 4350 is still obvious. If the European session rebounds to this level again without breaking through, the bull market will be difficult to sustain in the short term. We can consider trying a light short position once, but be sure to set a stop loss. At the same time, if the short-term support of 4330-4320 below cannot be held, gold will fall further to test yesterday's rebound low of 4305-4295. Once 4305-4295 is breached, it may trigger a technical sell-off, pushing the gold price to accelerate its correction to 4240 or even the 4220 neckline.
Trade intraday at key levels, but be wary of market whipsaws.
OANDA:XAUUSD

The 4400 era is coming, and the 4500 era is just beginning.Judging from the current trend, the middle track of the hourly line and the 4H line are already around 4280. As time goes by, the lower low point is constantly rising. We can appropriately increase the expected retracement target and participate in long trading when it retraces to around 4390-4380. But at the same time, we also need to pay attention to the short-term support formed by 4330-4320. If it falls back to this level in the evening and shows a clear stop in the decline, we can also consider entering the market in advance and going long on gold in this range. The upper pressure continues to focus on 4365-4380. If gold rebounds first, you can also consider shorting gold appropriately.
OANDA:XAUUSD

It is not a reversal callback correction to continue to buyGold gapped up at the opening, touched 4379 and then plunged nearly $100 before rebounding quickly. The fluctuations in the Asian session alone are so drastic. In addition, today is Friday and there is a risk of market closure, so intraday trading needs to be more cautious.
From the news perspective, the expectation of a Fed rate cut provides liquidity support, Sino-US trade tensions and geopolitical risks stimulate safe-haven demand, and the weakening of the US dollar and economic uncertainty amplify the appeal of gold. Many investors continue to increase their holdings of safe-haven assets in a complex macroeconomic context, providing solid and strong support for the rise of gold.
Although short-term prices fluctuate frequently, they have not fallen below the daily MA5 and MA10 moving averages. Therefore, it should not be regarded as a trend reversal, but a market shakeout. Therefore, we maintain a trading strategy that is mainly bullish and supplemented by short selling.
From a fundamental perspective, multiple rebound attempts failed to break through, making the upper 4380-4400 range a short-term resistance range. The short-term trend has the tendency to form an M top, so I will give several long trading opportunities during the day.
First of all, we should pay attention to the first support formed by 4315-4305 below, which is also the 61.8% retracement position of gold. If it repeatedly circles this position in the short term without breaking, we can try to go long on gold. For the second chance, I would give the support level of 4290-4280 below, which is near the trend suppression and the 50% dividing line, as well as the 4H MA10 moving average. I think we can try to go long on gold again within this range. The last chance I would give is around 4200, the starting point of this round of rise. Even if gold retaliates and falls, we can still maintain good trading opportunities.
During the day, we can go long on gold in batches according to the strength of gold's retracement.
OANDA:XAUUSD
Gold Market Update (Easy to Understand!)Gold’s still shining bright; it’s in a bull market, meaning prices are mostly going up 🟢.
But even in a bull market, prices can dip before the next big move. Here’s what could happen next:
📉 If gold falls below 4205, we could see it slide down to 4184 or even 4181.
📈 After that, it might climb again toward 4252, maybe even 4279.
💪 But if gold breaks above 4239, it could keep running up right away!
👉 The big picture: gold still looks strong long-term; just expect a few short dips along the way.
Want to know where I see gold going next and how to trade around these levels?
💬 DM me “GOLD” and I’ll share my next target before it hits the charts. 🚀
Mindbloome Exchange
Trade What You See, Not What You Think

How to operate the layout and don’t miss the golden opportunity!News: As expected, the Federal Reserve cut interest rates by 25 basis points on Wednesday and hinted at two more cuts this year, pushing gold to a record high above $3,700. The dollar's rebound from multi-year lows and rising Treasury yields have put some pressure on gold prices. The latest dot plot suggests another 50 basis point rate cut before the end of the year, but Powell expressed caution about the pace of rate cuts. The long-awaited moment has finally arrived. Despite persistently high inflation, the Fed has clearly shifted its policy focus to achieving full employment. The median forecast for the next two years indicates that the Fed plans to cut interest rates by 25 basis points each year. The forecast range for the end-2026 interest rate is 2.6% to 3.9%. Policymakers expect the unemployment rate to reach 4.5% in December this year and fall to 4.4% by the end of 2026. The market will then focus on Thursday's economic data, including US initial jobless claims and the Philadelphia Fed manufacturing index, as well as policy moves from the Bank of England and the Bank of Japan, which may cause short-term fluctuations in gold prices.
Gold Trend Analysis: Gold's bullish trend remains intact, and the overall outlook remains bullish, but there is still a risk of medium-term correction. Therefore, when trading, consider waiting for a pullback to go long. After the ups and downs of Monday, Tuesday, and Wednesday this week, gold has twice tested the 3707 high, only to experience significant pullbacks after both attempts. In particular, after the Federal Reserve's interest rate decision, market buying sentiment subsided, and gold fell to a low of 3645. Therefore, it is unlikely that gold will continue to rise in the short term, or even break new highs. Therefore, gold is likely to experience a period of volatile correction in the near term, and there is no need to overestimate the market after the interest rate decision.
From a technical perspective, the daily chart closed at a high level, but failed to break through the unilateral moving average support. Therefore, it is unclear whether gold will reverse its trend. At most, it is showing signs of weakening, forming a high-level consolidation. The key support level below is 3620. A break below 3620 and a series of daily declines, breaking through the unilateral moving average, would indicate potential for a significant decline. The H4 Bollinger Bands are currently converging, with the moving averages converging, indicating a very clear volatile trend. The support point between the lower Bollinger Band and the 60-day moving average is near 3635. Unless this level is broken, it will be difficult to pull the lower Bollinger Band apart, leading to a unilateral decline. Gold surged and then retreated, reaching a low near 3645. Therefore, support points below are very clear, with 3635 and 3620 as key support points. Assuming the overall trend remains unchanged, the principle of buying on dips to key support points is bullish. Focus on 3675, 3690, and 3710 above. Thursday and Friday are likely to see continued high-level fluctuations in the bullish trend.
Goldman Sachs - Too Cheap to Ignore?NYSE:GS and the general financial services sector as a whole has faced extreme trauma over this past month. However, one that particularly stands out is the "bad guy" of the industry who has taken the equivalent to a roundhouse kick to the face, and the chart shows it. But does this mean that someone looking for a dip shouldn't pick up strong equity on a discount? I say no, lets be greedy while other are fearful just like that one guy said. Warren something... I don't really remember his name.
Let's examine the numbers before we do the finance equivalent of astrology. This means that value investing and it's rather elementary techniques are going to give us some sort of indicator of a buy or a sell. Here's what you need to know.
1. Sachs has an attractive dividend yield of 2.14% ($11.50/share) and a gleaming dividend payout ratio (DPR) of 21.50%.
2. It is far from its high annual EPS sitting at 41.21 sliding from its high last December at 60.35.
3. It's price to earnings ratio (PE) is lounging nicely at 14.00 meaning we are at a generally cheap share price. This metric is what we're looking for.
4. Unfortunately, it has a rather higher price to book ratio (PB) at 1.64 which somewhat contradicts the PE ratio examined in #3.
5. Other metrics to keep in mind is an EV/EBITDA at 53.90 and a PEG at 16.23 which are both considered undesirable to investors.
So as far as statistics are concerned, Goldman is sending some mixed signals making a decision difficult at the moment. This means we're going to have to examine the general sector sentiment and general outlook.
Firstly, I'd like to point out Goldman's enterprise value. Sachs' EV is currently reported at 855.93 billion, 673 billion (78.63%) being debt (long term or short). This means NYSE:GS is a debt heavy company and we all know how debt works (the entity taking on the debt owes principal + interest). Well, this means that NYSE:GS is heavily going to be influenced by interest rates even considering their strong revenue. So, if we plan on interest rates being lowered long term (which I'm sure we all do), Goldman will be able to borrow from the Fed at a cheaper interest price while simultaneously owing account holders and bond holders less in interest (or APY yield for that matter). However, in the event that inflation runs wild and the Fed raises rates, NYSE:GS will face some turmoil along with the other commercial investment banks.
Great, so now for the fun part. Let's see what the charts have to say about this and what it could be implying.
Here is the 4H chart looking back into last October.
As you can see, Goldman posted a sweet rally followed by our current pullback. However, we are being flashed with various bullish technical patterns and a strong explanation for the drop (even considering the tariffs threats and indices pullback). In summary, we are examining a stock in gradual freefall towards what appears to be several safety nets.
On a psychological level, I find that most investors in the business of "smart money" wont let Goldman drop too low before they put their boot down. I also imagine this will happen pretty soon, but we need to hold the $540 price level.
As far as the MACD is concerned, we are experiencing weakness from the buyers are the bears are clearly on offense.
And lastly, the GS implied volatility shows that options traders aren't pricing in anything particularly unusual, and the most usual movement for the market is to climb higher so that's good news.
So, what's the conclusion. In my humble opinion, I believe that Goldman Sachs' stock is trading too low to not buy. Financially, the company is not showing anything particularly concerning and may just need to show some strength before the mass cash chases this play. As of right now, I am long on NYSE:GS considering the financial statistics, general industry sentiment, and technical analysis which was used as an assistance tool. This trade could be last anywhere from 1 day to 1 year, but I am prepared to hold for much longer.

Golden opportunities are not hard to grasp.Gold Market Forecast for Next Week: Gold News Analysis: The US dollar strengthened on Friday, but it is poised for a weekly decline as weak economic data led traders to price in the possibility of more interest rate cuts this year. Investors also assessed US President Trump's Federal Reserve nominations. Gold prices experienced a roller-coaster week from August 4th to 8th, particularly during the past two trading days, when reports of gold bar tariffs sparked market panic. Despite the White House's eventual clarification of the reports, gold prices remained near the peak of uncertainty, hovering around $3,400. Gold prices tested the $3,400 mark several times this week, but despite increasing expectations of a Fed rate cut and Trump's nomination of dovish Fed officials, prices remained above that level. Until Friday's news of gold bar tariffs, gold prices surged above the $3,400 mark, reaching a high of $3,409, the highest level since July 24th. Following the panic caused by the gold bar tariffs, and despite the US clarification of the reports, analysts and retail investors remain bullish on gold prices for next week. Next week, gold prices will focus on the meeting between Trump and Putin, as well as speeches by several Federal Reserve officials on the economic outlook, and the release of the July unadjusted CPI annual rate.
Gold Technical Analysis: Looking at the current gold price trend, after Friday's pullback and negative close, will gold prices continue to decline next week, or will they rebound and rise? I believe the former is unlikely. The possibility of a new low exists, but it is low. Several attempts at the 3380 support level have failed to break. First, looking at recent price trends, gold prices have continued to rise, with higher highs and lower lows, indicating that the 3268 support level is valid. After rebounding to 3409, it began to fall, closing near 3397, demonstrating the 3380 support level and the strength of bullish sentiment. This suggests that gold prices are currently range-bound at a high level. However, given that the support level remained intact and the price closed above it, the possibility of gold prices breaking below 3380 next week is ruled out. Gold prices failed to break below 3380 on Friday as expected, and the overall trend of rising, falling, and closing lower shows that bulls still have the upper hand. However, I think it is not advisable to conclude that bulls will control the market next week. Although bulls have repeatedly tested 3410 without success, the decline has not been strong. In other words, if the bulls were truly strong, there would be no decline the next day, and the opening of next week should continue to rise. However, the current gold price has not only slowed down its rise, but also shown signs of decline, which means that bears are still holding the 3410 resistance level.
Based on the above, we recommend a low-to-long strategy for early next week, supplemented by high-to-short strategies. Regarding support, watch out for 3380. After yesterday's repeated dips, this will become a key defensive point for bulls at the beginning of next week. A test or break of this resistance level is expected. An unexpected break below would disrupt the bullish short-term trend, with a high probability of seeing 3368 or a continuation of the decline to the 3350 area. However, we prefer a move higher above 3380. Regarding resistance, watch out for the 3410 area. Although this area is at 0.382, the dividing line between 3268 and 3500, and also represents resistance from Friday's high, after adjustments and with bullish momentum, the probability of a breakout is increasing. Therefore, we recommend focusing on the 3343 area, which provides strong resistance from the previous high and also represents the dividing line at 0.236. Upon first approaching or touching this area, try to enter a medium-term short position. On the whole, the short-term operation strategy for gold next week is recommended to focus on shorting on rebounds and long on pullbacks. The short-term focus on the upper side is the 3410-3420 line of resistance, and the short-term focus on the lower side is the 3380-3370 line of support.

The trend is clear, why do I choose to be firmly bullish on goldGold Trend Analysis: Yesterday, the gold market demonstrated strong upward momentum, opening near 3290 before falling slightly to a low of 3281 before fluctuating upward. Boosted by the non-farm payroll data, the gold market surged during the US trading session, reaching a single-day gain of 2.02%, reaching a high of 3363 and closing there. The daily chart formed a long bullish candlestick with a long lower shadow, forming a Morning Star pattern, reinforcing the bullish trend. From the perspective of the cycle structure, the daily level is clearly in the 5-wave upward stage, and the upward trend of the large cycle has not changed. At the indicator level, the daily MACD momentum column (the column below the zero axis) represents the short-selling momentum. Its "gradual shortening" means that the short-selling force is weakening and the downward momentum is gradually fading. It is a potential signal of stopping the decline or rebounding. KDJ is about to form a golden cross between 20-50, which is a signal that short-term bullish power is beginning to increase, and the overall trend is bullish.
The 4-hour level shows typical bullish characteristics: the moving average system is arranged in a bullish pattern, but there is a certain deviation between the short-term price and the moving average. The technical side needs to correct the deviation rate through a callback before continuing to rise. The short-term support below is focused on the line near 3330-3335. This position is both the relay support level in the previous rise and the intersection of the 4-hour moving averages MA10 and MA20, which has strong support strength; the short-term resistance above is focused on the line near 3370-3383. This area is a pressure-intensive area near the previous high point. If it can be effectively broken through, it will further open up upward space. A successful breakout would open up further upside potential. A breakout would further open up the 3400 mark.
For gold trading, the short-term strategy is to buy on dips. If the price pulls back to the 3330-3335 support level, consider entering a long position with a target of 3355-3365. If it reaches 3370-3380, consider a short-term short position with a target of 3350-3340.
US Banks on Fire | Revenues Soar, and So Do the ProfitsWho Needs a Recession? Banks Are Swimming in Cash!
The largest U.S. banks have reported some of their best quarterly performances in recent years, with surging trading revenues, a resurgence in dealmaking, and an overall renewal of corporate confidence playing pivotal roles. Let’s break down the key details of the results.
Market Recovery
Across the major banks, investment banking and trading activities recorded impressive performances. Goldman Sachs saw investment banking revenue increase by 24%, while Bank of America (BofA) experienced a massive 44% jump, marking its strongest quarter in three years.
The market volatility stemming from factors like the U.S. election and changing expectations around interest rates continued to fuel robust trading revenues. Morgan Stanley’s equities division, for example, reached an all-time high, while JPMorgan and Goldman Sachs enjoyed notable gains in fixed-income trading.
A surge in CEO optimism has led to an uptick in mergers and acquisitions (M&A), initial public offerings (IPOs), and private credit demand. Morgan Stanley, in particular, is seeing the largest M&A pipeline in seven years, signaling a sustained wave of dealmaking.
Mixed Results for NII
Net interest income showed varying results across the banks, but forward guidance indicates that NII will likely see moderate growth in 2025, spurred by continued loan demand and higher asset yields.
Credit Risks on the Rise
Consumer lending pressures have persisted, with JPMorgan’s charge-offs rising by 9%. Many banks are preparing for a further increase in delinquencies, particularly in credit cards.
Commercial Real Estate Challenges
While the office sector remains under stress, banks are managing their exposures cautiously and have yet to face significant shocks in this area.
Regulatory Scrutiny Continues
Citigroup lowered its 2026 profitability target as it undergoes a transformation, while Bank of America faced increased scrutiny over its anti-money laundering compliance.
Resilient U.S. Economy
Banks are reporting strong consumer spending, loan growth, and corporate profitability, which supports an optimistic outlook for earnings growth heading into 2025.
Performance Breakdown for Each Bank
JPMorgan Chase
- JPMorgan posted a record annual net income of $58.5 billion, marking an 18% increase from the previous year.
- Investment banking saw a 46% surge in revenue, driven by strong advisory and equity underwriting.
- Trading revenue climbed by 21%, led by a 20% increase in fixed-income trading.
- Despite the impressive results, JPMorgan is still facing challenges such as rising charge-offs and pressures on loan margins. CEO Jamie Dimon emphasized concerns about persistent inflation and growing geopolitical risks.
Bank of America
- BofA experienced an 11% year over year growth in revenue, reaching $25.3 billion, with net income up 112% from the previous year.
- The investment banking division saw a dramatic 44% rise in revenue, the highest in three years, thanks to strong debt and equity underwriting.
- Trading revenue grew by 10%, driven by solid performance in fixed income (up 13%) and equities (up 6%) as market volatility spurred client activity.
- BofA also reported growth in its consumer and wealth management divisions, with credit card fees and asset management showing strength. Client balances grew to $4.3 trillion, a 12% increase from the previous year.
- After several quarters of decline, BofA’s NII grew by 3%, exceeding expectations and signaling stability. The bank expects NII to continue rising through 2025, with projections of $15.7 billion per quarter by the end of the year.
Wells Fargo
- Wells Fargo’s revenue remained flat at $20.4 billion, but net income surged by 50%.
- NII declined by 8% year-over-year but is expected to rise slightly in 2025 due to higher reinvestment rates on maturing assets.
- The bank made significant progress in cost-cutting efforts, reducing non-interest expenses by 12%, thanks to workforce reductions and efficiency initiatives.
- Investment banking fees rose by 59%, benefiting from the broader market recovery and the bank’s renewed focus on its Wall Street presence.
- Wells Fargo returned $25 billion to shareholders in 2024, including a 15% dividend increase and $20 billion in stock buybacks. However, the bank continues to face regulatory constraints, notably the asset cap imposed by the Federal Reserve.
- Looking ahead to 2025, Wells Fargo anticipates modest growth in fee-based revenue, with cost discipline and efficiency gains driving improvements.
Morgan Stanley
- Morgan Stanley saw a 26% increase in revenue, reaching $16.2 billion, while net income soared by 142%.
- Equity trading revenue jumped by 51%, setting a new all-time high as market volatility sparked increased client activity, particularly in prime brokerage and risk-repositioning trades.
- Investment banking revenue grew by 25%, fueled by strong demand for debt underwriting, stock sales, and M&A activity. CEO Ted Pick noted that the M&A pipeline is the strongest in seven years, signaling a potential multi-year recovery in dealmaking.
- Morgan Stanley’s wealth management division saw $56.5 billion in net new assets, increasing total client assets to $7.9 trillion. The firm is pushing toward its goal of $10 trillion in assets under management.
- In response to growing business complexities, the firm launched a new Integrated Firm Management division to streamline services across investment banking, trading, and wealth management.
Goldman Sachs
- Goldman Sachs experienced a 23% increase in revenue, reaching $13.9 billion, while net income more than doubled, up 105%.
- Record performance in equity trading contributed to a 32% increase in revenue from this segment, as market volatility drove greater client activity.
- Investment banking revenue grew by 24%, boosted by significant gains in equity and debt underwriting.
- The firm’s asset management division saw an 8% rise in assets under management, reaching $3.1 trillion, while management fees exceeded $10 billion for the year.
- Goldman is winding down legacy balance-sheet investments but also saw a gain of $472 million from these investments in Q4. The firm’s recent launch of its Capital Solutions Group is aimed at capturing growth opportunities in private credit and alternative financing.
Citigroup
- Citigroup posted a 12% increase in revenue, reaching $19.6 billion, with non-interest revenue surging 62%.
- Fixed-income and equity markets were key drivers, growing 37% and 34%, respectively, as market volatility tied to the U.S. election boosted performance.
- Investment banking revenue climbed by 35%, supported by strong corporate debt issuance and a pickup in dealmaking activity.
- The bank unveiled a $20 billion stock repurchase program, signaling confidence in future earnings.
- Citigroup also made strides in controlling operating expenses, which declined by 2% quarter-over-quarter. However, the bank lowered its 2026 return on tangible common equity (RoTCE) guidance to 10%-11% due to the costs of its ongoing transformation.
- CEO Jane Fraser emphasized Citigroup’s long-term growth trajectory, noting improvements in credit quality and continued progress with the strategic overhaul, including the postponed IPO of Banamex, the bank’s Mexican retail unit, now expected in 2026.
Long story short
Heading into 2025, the major U.S. banks are in strong positions, buoyed by a favorable economic backdrop, continued growth in trading, and a rebound in corporate dealmaking. Despite challenges such as rising credit risks, regulatory hurdles, and potential macroeconomic uncertainties, the outlook remains positive. With a recovering IPO market, continued wealth management growth, and strong trading revenue, the banks are poised to capitalize on the renewed corporate optimism. The key question will be whether the dealmaking frenzy continues or whether uncertainties in the global economy and market dynamics could temper the rally.

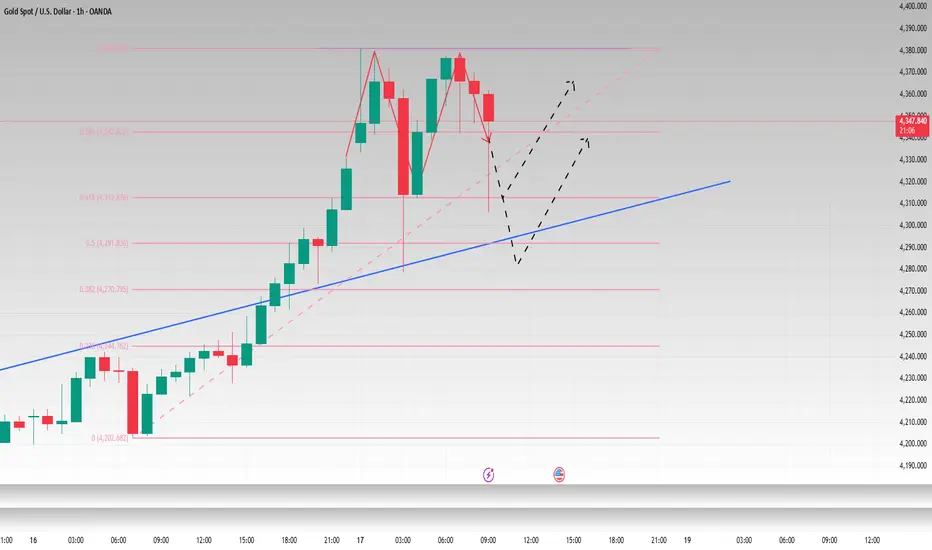
XAU/USD) bearish Trend Read The captionSMC trading point update
Technical analysis of XAU/USD (Gold Spot vs US Dollar) on the 1-hour timeframe. Here's a breakdown
---
Technical Breakdown:
1. Descending Channel:
Price is trading within a clearly defined downward-sloping channel (black trendlines).
This suggests a short-term bearish trend.
2. Resistance Zone (Yellow Box at 3,335–3,340):
Price recently rejected from this resistance area.
This zone aligns with both the 200 EMA and previous structure, strengthening its validity.
3. EMA Confluence:
The 200 EMA (3,336.798) is acting as dynamic resistance.
Price is currently below the EMA, confirming the bearish bias.
4. Support/Target Zone:
The projected target zone is around 3,313.266, labeled as a support level.
This level has acted as previous structure support, increasing its significance.
5. RSI Analysis:
RSI is at 37.18, close to the oversold region, but not yet fully exhausted.
Suggests there’s still room for a downside move before any potential bounce.
Mr SMC Trading point
---
Trade Idea Summary:
Bias: Bearish
Entry: Below the resistance zone (~3,335–3,340)
Target: 3,313 (support zone)
Invalidation: Break and hold above 3,340–3,345
Risk Note: Watch for potential consolidation or fakeouts before continuation.
Please support boost 🚀 this analysis)

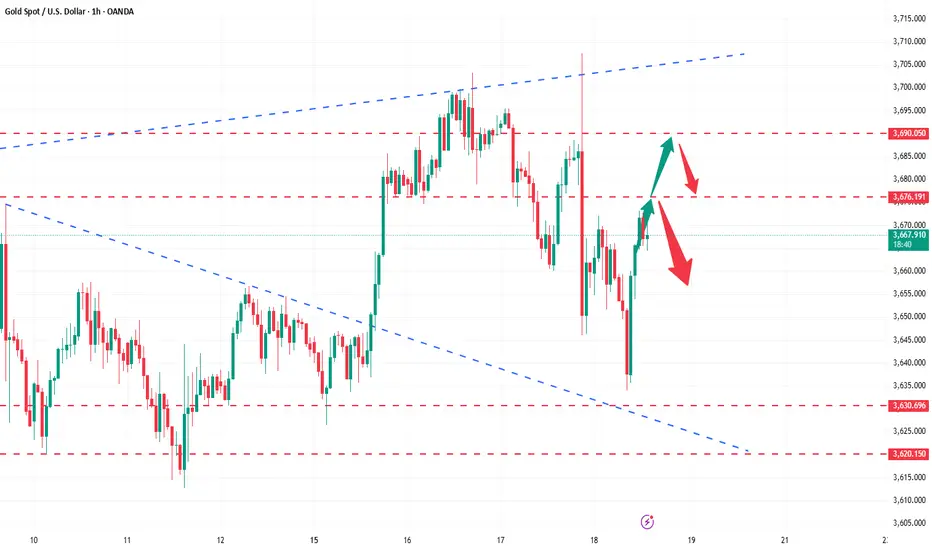
XUA/USD) Bearish Analysis Read The captionSMC trading point update
Technical analysis of XAU/USD (Gold vs USD) on the 1-hour timeframe. Here's a breakdown
Technical Analysis Summary
1. Descending Channel:
The price is moving within a clear descending channel, indicating a bearish market structure.
Recent price action rejected the upper boundary of the channel, strengthening the downtrend bias.
2. Resistance Rejection:
A key resistance level around 3,340–3,345 was retested (marked with a red arrow) and rejected.
Price has already shown early bearish candles post-rejection, suggesting weakness at that level.
3. 200 EMA (Exponential Moving Average):
Price is currently hovering around the 200 EMA, and a clean break below it could accelerate the bearish move.
4. RSI Indicator:
RSI is around 46, below neutral 50, showing bearish momentum is building but not yet oversold.
No divergence is present, supporting the idea of continuation.
---
Bearish Playbook
Entry Idea: After the rejection at the resistance zone and confirmation of lower highs.
Target: 3,313 – 3,310 zone (marked as the “key support level” and “target point”).
Risk Management: A stop loss above 3,345 (above the resistance zone) would be a prudent protection level.
---
Confluences Supporting the Short Setup:
Rejection at horizontal resistance.
Alignment with the descending trendline/channel.
Price trading near or below the 200 EMA.
RSI slightly bearish.
Caution:
Watch out for any macroeconomic news or high-impact events (highlighted with the economic event icons) that could inject volatility.
A strong break back above the resistance could invalidate this bearish setup.
Mr SMC Trading point
Conclusion:
This setup anticipates a bearish continuation targeting the 3,310 support zone. Ideal for short-term traders looking for downside opportunities, provided price respects the trend and fails to reclaim the resistance.
Please support boost 🚀 this analysis)

Gold----Sell near 3357, target 3330---3320Gold market analysis:
Yesterday's gold daily Asian session was still a normal shock drop. We sold at 3340 and 3341 twice to 3322 to make all profits. 3320 is the previous low point and the moving average support position. This position is also a strong support today. Yesterday, the Trump and Powell incidents made gold strongly rise to around 3377. In addition, the Middle East bully bombed Syria again, which is also the main reason for the surge in gold. However, the fundamentals are only short-lived. In the end, the gold daily line closed positive, but closed with a super long upper shadow line. Selling is still not dead. Today's gold buying and selling have opportunities, and the possibility of a direct decline is small. I estimate that the Asian session will be repaired, and our ideas for buying and selling in the Asian session can be intercepted. If it breaks 3320, consider chasing and selling again, which means that selling has started again.
The highest rebound in the Asian session was around 3352, and the highest position in 1 hour was around 3357. Today's small suppression in the white session is 3357. The following support focuses on two positions, one is 3320, and the other is 3330. I estimate that the fluctuation range of the Asian session is 3320-3357. Let's observe and wait for the position in the Asian session.
Pressure 3352 and 3357, strong pressure 3366, support 3320 and 3330, and the watershed of strength and weakness in the market is 3350.
Fundamental analysis:
Trump's dissatisfaction with Powell has not been a day or two, and the conflict is inevitable. The impact on gold is also short-term. Yesterday's pull-up and dive is a case in point.
Operation suggestion:
Gold----Sell near 3357, target 3330---3320

Gold price fluctuates! Gold operation guide!Market news:
In the early Asian session on Thursday (July 17), spot gold fluctuated in a narrow range and is currently trading around $3,341 per ounce. Rumors that Trump plans to fire Federal Reserve Chairman Powell caused violent market fluctuations. The US dollar once plummeted, and then narrowed the decline; while the London gold price gave up most of its gains after soaring. If Powell is fired in advance, it may be unfavorable to the US dollar, because it will shake the outside world's confidence in the US financial system and the safe-haven status of the US dollar.
Trump's repeated statements have caused the international gold price to experience violent fluctuations in a short period of time. The market's concerns about the independence of the Federal Reserve have become an important driving force for the rise in gold prices. However, geopolitical tensions still support gold prices. Israel launched an airstrike on Damascus, Syria on Wednesday, destroying the Ministry of Defense building, which is very close to the Syrian presidential palace. Trump's trade policy has further injected uncertainty into the gold market.
Technical Review:
The news that Trump's big mouth "considered replacing Federal Reserve Chairman Powell" caused violent fluctuations in the financial market. Although the storm subsided after Trump's denial, Wall Street has sounded the alarm. Rumors that Trump will fire Powell caused market volatility, and the US dollar index plunged and closed down 0.36% during the session. Spot gold was on a roller coaster ride, rising sharply from 3320 to 3377 in the late trading, then plunged back to 3336 and then rose again to 3357 before closing sideways around the 3350 mark.Technical daily chart structure alternates between positive and negative cycles to maintain the adjustment of the Bollinger band middle track, the indicator is neutral, the Bollinger band closes, and the RSI indicator is flat. The four-hour chart and hourly chart indicators are neutral. Affected by market news, the gold price alternates between long and short cycles and fluctuates widely, the moving average is glued, the RSI indicator middle axis is flat, and the Bollinger band is flat and closed. Gold maintains a wide range of fluctuations, selling at high prices and buying at low prices.
Today's analysis:
The gold market last night was quite exciting. In the middle of the night, Trump claimed that he would fire Powell. After the news came out, gold soared by more than 50 US dollars in a short period of time, but the market was only controlled by emotions in a short period of time. After all, the chairman of the Federal Reserve is independent, and Trump cannot have the right to fire Powell. Once the emotions passed, although gold fell sharply, it also pushed up the trend of gold prices to a certain extent! At present, after the strong rise of gold in 1 hour, it quickly fell back and closed with a long upper shadow line. The change in gold buying did not successfully stabilize. Then this market is actually a kind of catharsis of the news. The confidence of gold buying in directly rising again is not very sufficient. The gold 1-hour moving average is still in the form of dead cross selling. So gold rebounds or continues to sell.The gold 1-hour pattern excludes the influence of the upper shadow line stimulated by yesterday's news. In fact, the whole rhythm is still fluctuating and falling. The upper shadow time is not long, and it is probably just a temptation to buy. After the ups and downs of gold last night, it rebounded again to the 3360 line or continued to fall under pressure. So gold continued to rebound under pressure and continued to sell at high prices below 3360.
Operation ideas:
Buy short-term gold at 3325-3328, stop loss at 3317, target at 3350-3370;
Sell short-term gold at 3357-3360, stop loss at 3368, target at 3340-3320;
Key points:
First support level: 3330, second support level: 3319, third support level: 3303
First resistance level: 3358, second resistance level: 3370, third resistance level: 3386

Gold----Buy near 3348, target 3369-3389Gold market analysis:
Looking back at last week's market, the market performance on Monday and Tuesday last week was quite abnormal, belonging to the rhythm of a big oscillation. The following three trading days were basically relatively normal, and the market rose all the way after the buy-in. The overall market was a bottoming-out and rebounding market. Recently, investors are very confused about whether the general trend is bullish or bearish? First of all, we need to distinguish how long the general trend cycle is? If you look at the weekly line, you can at least see a 2-4 week trend. If you want to see a trend for a month, then you have to look at the weekly K-shaped and monthly trend. I understand that the long-term trend is at least a trend of one month to half a year. With the current instability of the international situation, the trend of Russia and Ukraine, the situation in the Middle East, and Trump's global tariff war, I think the half-year trend is bullish. We are short-term traders, and basically can't see that far. Looking at the trend of one week at most is the limit. Playing with long-term trends requires a 100-point mentality, and playing with short-term trends only requires technology. The first thing every Monday is to figure out the trend of the week. Buy short-term climb at the weekly close. This week's thinking is bullish first. We estimate that there will be a decline in the second half of the week. Today's weekly line is treated as a low-price buy first, and pay attention to the retracement to the support to buy. The low point of Friday's retracement near 3348 is a new support, and it is also the starting point of the pattern support 3344. In addition, the hourly stepping point is near 3342. If it does not break 3342 today, insist on buying. If it breaks, adjust the thinking to be bearish in time. A small step on the Asian session is also an opportunity to get on the train.
Pressure 3397, support 3348, 3345, 3342, the watershed of strength and weakness in the market is 3342.
Fundamental analysis:
Last week, Trump increased tariffs on Canada and will soon increase tariffs on Brazil. There is no signal of stopping the tariff war. It is long-term bullish for gold. The situation in the Middle East has not completely stopped, and it is also a long-term suppression of the US dollar to support gold.
Operation suggestion:
Gold----Buy near 3348, target 3369-3389

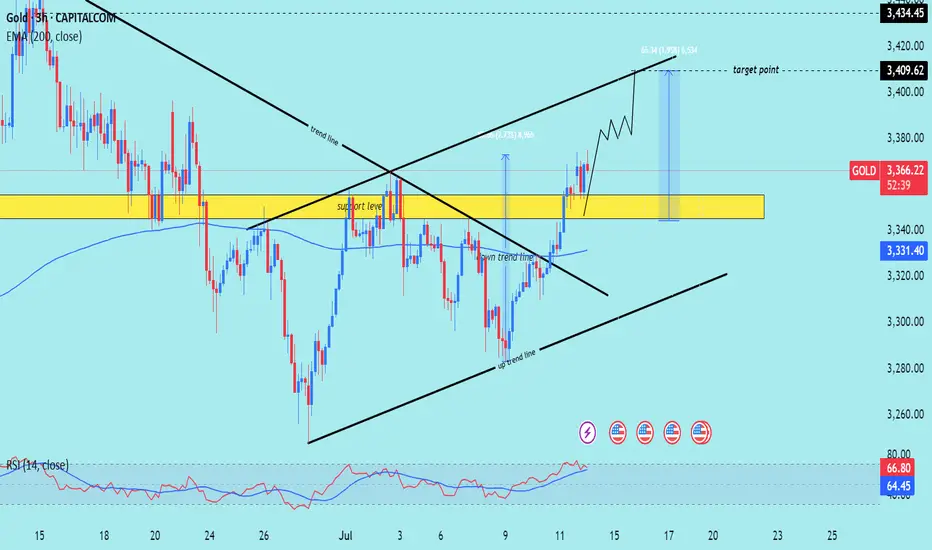
XUA/USD) Bullish Analysis Read The captionSMC trading point update
Technical analysis of Gold (XAU/USD) analysis on the 3-hour
---
Gold (XAU/USD) 3H Technical Analysis Summary
Market Structure: Bullish breakout
Price has successfully broken above both the downtrend line and the support zone (highlighted in yellow), signaling a shift in structure from bearish to bullish.
Key Support Zone:
The yellow zone (~3,335–3,355) was previously a resistance area. After the breakout, it is acting as a strong support level and has been retested.
Trendlines:
Downtrend line: Broken and retested.
Uptrend line: Guiding current price action, supporting higher lows and forming an ascending channel.
200 EMA (blue line):
Price is trading above the EMA 200 (~3,331), confirming bullish bias and providing dynamic support.
Momentum (RSI 14):
RSI is around 67.85, showing strong bullish momentum.
Nearing overbought, so a minor pullback or consolidation could occur before continuation.
Volume:
Increase in buying volume near breakout area suggests institutional interest or strong buyer conviction.
Mr SMC trading point
---
Conclusion:
Price has shifted into a bullish continuation pattern.
A successful break and retest of structure and trendlines increases the likelihood of further upside.
As long as price holds above the yellow support zone and the uptrend line, bullish momentum is favored.
Short-term pullbacks may offer new long opportunities.
---
Please support boost 🚀 this analysis)
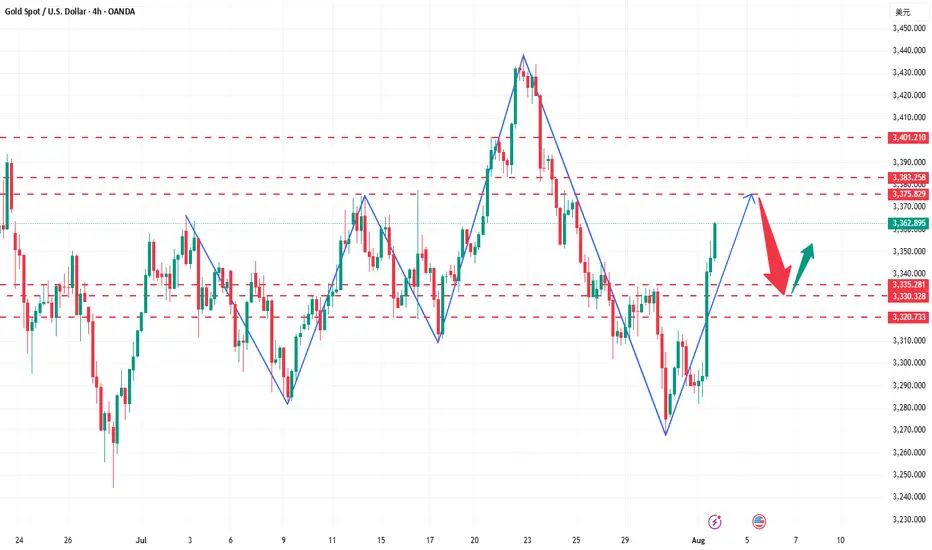
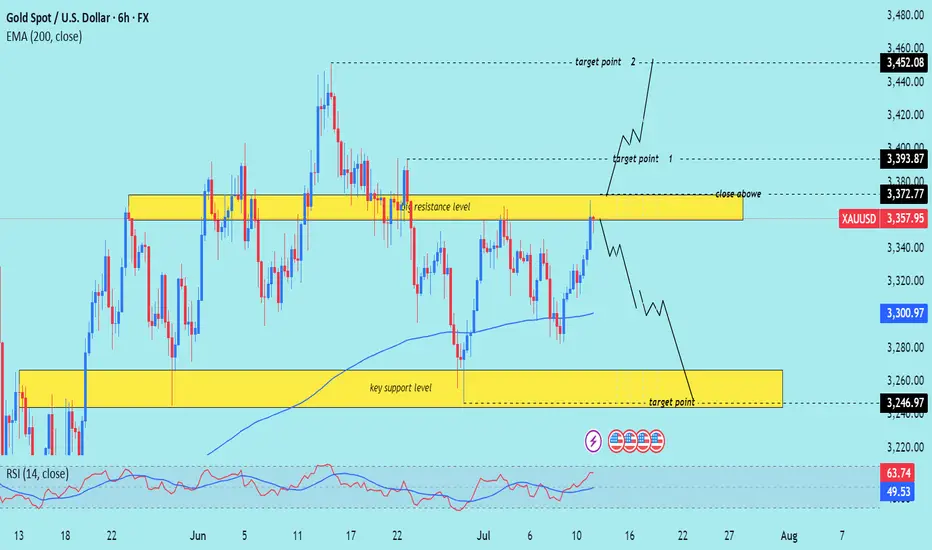
XAU/USD technical analysis setup Read The captionSMC trading point update
Technical analysis of (XAU/USD) on the 6-hour timeframe, focusing on a key resistance zone that could trigger either a bullish breakout or a bearish reversal.
---
Analysis Summary
Current Price: $3,357.95
Trend Context: Price is testing a strong resistance zone with a possible breakout or rejection in play.
---
Scenario 1 – Bullish Breakout
1. Resistance Zone: $3,357–$3,372
Multiple previous rejections.
A confirmed close above $3,372.77 signals bullish strength.
2. Upside Targets:
Target 1: $3,393.87
Target 2: $3,452.08
3. Indicators:
RSI at 63.74, approaching overbought but still with room to rally.
EMA 200 is trending upward, supporting bullish bias.
---
Scenario 2 – Bearish Rejection
1. If price fails to close above $3,372.77, a rejection from resistance is likely.
2. Downside Targets:
Reversal projected toward the key support zone at $3,246.97
EMA 200 at $3,300.97 may provide temporary support before breakdown.
---
Trade Ideas
Direction Entry Level Stop-Loss Target 1 Target 2
Bullish Close above $3,372 Below $3,346 $3,393.87 $3,452.08
Bearish Rejection from $3,357–$3,372 Above $3,380 $3,300 → $3,246.97
Mr SMC Trading point
---
Summary
This is a critical decision point for Gold. A breakout above resistance can propel price to $3,450, while rejection could drive price back to $3,246. The reaction at the current zone will dictate the next major swing.
Please support boost 🚀 this analysis)
The idea remains unchanged, NY3360-3365 is emptyThe idea remains unchanged during the NY period. Although gold has currently reached a high of around 3348, it has not stabilized above it. If gold successfully breaks through 3350 in the short term, it may reach 3360 or 3365. In the 4H cycle, it presents a step-by-step upward pattern. The K-line is temporarily fluctuating sideways near the upper track. At the same time, 3345 has formed a double top pattern. Combined with Thursday's low of 3310, an inverted triangle oscillation range of 3345-3310 is formed in the short term. This week's trend needs to pay close attention to the breakthrough direction of this range. Short-term long positions can be taken after the trend is confirmed.
XAUUSD@3330-3320 long TP 3345-3365
OANDA:XAUUSD
