Gold Bearish Rejection from Supply Zone (OB + FVG Confluence)Key Observations and SMC Components:
Market Structure Shift (MSS): The label "MSS" suggests that the previous bullish market structure has been broken to the downside, indicating a potential shift to a bearish trend.
Order Block (OB): A bearish Order Block is identified (labeled "OB"), which is typically the last up-close candle before the strong move down. This zone is a high-probability area where institutional selling pressure is expected to resume.
H1 FVG (Hourly Fair Value Gap): Within the Order Block, an H1 FVG (or Inefficiency) is identified. This is an area where price moved strongly without overlapping all three candles, leaving a gap. Fair Value Gaps are often used as targets for price to retrace and "fill" before continuing the dominant move.
CRT-L and CRT-H:
CRT-L (Current Range Top/High) marks the top of the range before the sharp drop.
CRT-H (Current Range Low/Bottom) marks the low point of the current swing leg.
Projected Move: The large green arrow and the curved line indicate the anticipated price action: a retracement (pullback) upwards into the H1 FVG and the OB zone, followed by a rejection and a continuation of the downward move towards and potentially below the CRT-H low.
Current Price Action: The price is currently at the very bottom of the sharp drop, hovering around $4,041.48. The dotted line and arrow show the expectation of a rally into the shaded resistance zone.
Trading Bias and Expectation
The overall bias is bearish. The analyst expects price to:
Rally (short-term bullish retracement): Move up to the area between approximately $4,065 and $4,080 (the OB and H1 FVG zone).
Reject and Trend (long-term bearish continuation): Find strong resistance in the OB/FVG zone, and then reverse to continue the downtrend, aiming to break the CRT-H low.
Goldprediction

GOLD HIGH PROBABILITY SETUPS SOON!!!🚨 XAUUSD HIGH PROBABILITY BUY SETUP 🚨
* Here We Can See Clearly The Next Potential Moves For GOLD Coming Hours/Days.
* Keep Your Eyes Close On Your Trading Positions.
* Happy PIP Hunting Traders.
FXKILLA.

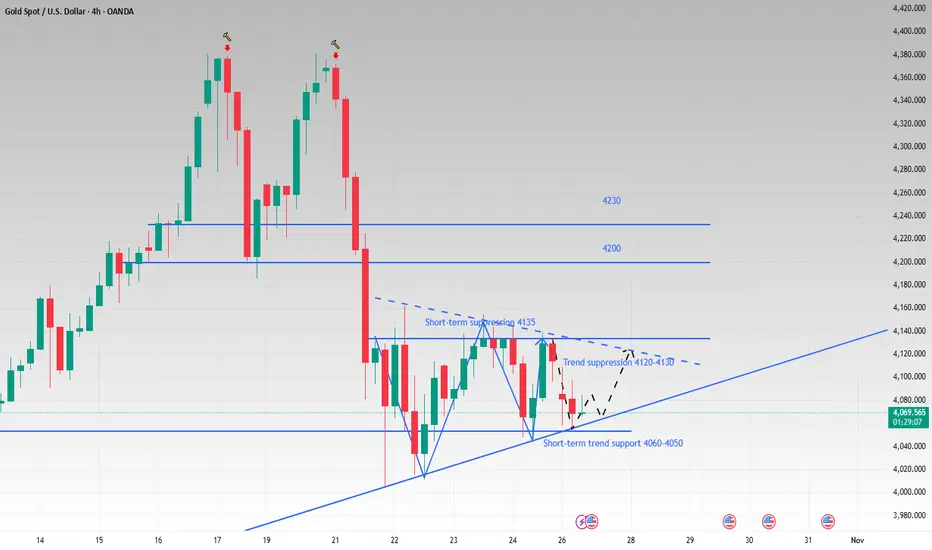
The triangle pattern breaks and looks at the directionLast week we repeatedly emphasized the importance of paying attention to the rising trend line of the 4H cycle. Until the price falls below this trend line, we will maintain our bullish stance. Although news of easing trade tensions between China and the United States over the weekend has brought a slight cooling to the market's tense mood, this has only temporarily suspended the bullish counterattack. Whether a real and effective consensus can be reached still requires attention to the APEC summit at the end of the month.
At the same time, the Federal Reserve's interest rate cut this week is almost a foregone conclusion, which has provided some support for the rise in gold prices. This has also contributed to the current relatively flat trend in gold prices, without as much fluctuation as last week. In addition to the rising trend line that we have been paying attention to, there is also a small downward trend line in the 4H chart, which makes the current trend fall into a triangle consolidation range.
The short-term support below is 4060-4050, and the trend suppression above is 4120-4130. Before the triangle pattern breaks to determine the future trading direction, we can sell high and buy low around this range.
The current hourly moving average is arranged downward, and it is expected to test the lower support again. If it falls back to the lower support and does not break, we can consider going long on gold.
Gold - Sell near 4097, target 4050-4020Gold Market Analysis:
Gold has recently experienced significant volatility. Once again, we remind everyone to respect the market when trading. Such extreme fluctuations are also the most likely to lead to margin calls. Last week, gold surged and then retreated, ultimately closing with a large negative weekly candlestick. This was the first negative weekly candlestick closing after nine consecutive weeks of positive days. Has a major top appeared? Current indicators and patterns suggest only a short-term top has appeared. A long-term top still needs to be confirmed on the weekly chart. A further negative closing this week could signal a weekly top. This week, our focus remains on a correction, and we will continue to follow this strategy. Major tops require time and space to form. Current fundamentals and international trends still support buying gold. The Federal Reserve's loose monetary policy and high debt levels are both favorable for gold buying. If this is merely a technical correction, gold prices will continue to set new highs.
Gold's potential correction from its highs lies between 4003 and 4161, with room for a 160-point correction. Gold plunged sharply in today's Asian session, leaving significant resistance. We should focus on the minor resistance level of 4097. If it fails to break above, selling will require further declines to find deeper support. Avoid selling near 4003 on the K-line chart. If the bottom of the oscillation pattern is broken this week, a deeper sell-off could occur.
Resistance levels are 4097 and 4035, while support levels are 4065 and 4045. The market's strength-weakness dividing line is 4097.
Fundamental Analysis:
For fundamental analysis, we are focusing solely on key data and geopolitical developments. This week will feature the Federal Reserve's significant interest rate decision, and the market currently anticipates continued easing.
Trading Recommendations:
Gold - Sell near 4097, target 4050-4020

Analysis of the latest gold price trends today!Market News:
In early Asian trading on Monday (October 27), spot gold prices opened sharply lower, falling nearly $50 to $4,058 per ounce. Over the weekend, China and the United States reached a preliminary consensus on the safe resolution of several key economic and trade issues. Market optimism regarding the international trade situation has significantly increased, dampening safe-haven demand for gold. In addition to trade factors, improved geopolitical dynamics and investor profit-taking have also weakened the appeal of London gold prices. Overall, international gold prices may fluctuate and adjust in the short term, but in the long term, the Federal Reserve's easing cycle and lingering potential risks may support a rebound. Expectations of a Fed rate cut, moderate inflation, and uncertainty surrounding the government shutdown provide a buffer, preventing a gold price collapse.
Technical Analysis:
From the daily chart, last Friday closed with a small bearish star candlestick pattern. Today's Asian session opened lower and closed higher, forming a "lower shadow," echoing the previous low of $4,044, forming the initial stage of a short-term double bottom support. While the MACD indicator maintains a death cross, the green momentum bar shows signs of narrowing, indicating that selling momentum is fading. The middle Bollinger Band is near $4080. The current price has returned above the middle band and has not fallen below the key support of the 10-day moving average ($4050). The daily buying trend structure has not been broken, and the low-open-high trend further confirms the strength of buying below. On the hourly chart, after a low Asian session, the price quickly dipped to $4058, forming a bullish candlestick pattern with a long lower shadow. Subsequently, the price continued to rise along the 5-day moving average, breaking through the resistance of the 20-day moving average and the middle Bollinger Band. The Bollinger Band opening is currently showing signs of widening. The MACD indicator has formed a golden cross below the zero axis, and the red momentum bar continues to expand, indicating sufficient short-term rebound momentum. However, it is important to note that the hourly RSI indicator is approaching the overbought 70 level, and the price is facing pressure from the previous range above $4100. A short-term correction may be needed, which provides technical logic for a short-term sell strategy. Overall, today's short-term gold trading strategy recommends selling at high rebounds, supplemented by buying at low pullbacks!
Gold Intraday Trading Strategy:
Short-term gold buy at 4005-4010, stop loss at 3995, target at 4080-4100;
Short-term gold sell at 4135-4140, stop loss at 4150, target at 4060-4030;
Key Points:
First Support Level: 4058, Second Support Level: 4025, Third Support Level: 4000
First Resistance Level: 4100, Second Resistance Level: 4138, Third Resistance Level: 4165

Gold analysis with trading ideasAfter nine consecutive weeks of strong gains, gold has entered a sharp correction phase. Driven by intense selling pressure, its nearly three-month winning streak has officially come to an end. However, given the persistently high levels of global geopolitical and economic uncertainty, the likelihood of a significant further decline in gold prices remains low, as safe-haven trading activity remains robust and dynamic. Currently, trade negotiations between the U.S. and China are still ongoing, while President Trump has announced the termination of all trade talks with Canada. Meanwhile, due to the U.S. Congress’ prolonged failure to pass an appropriations bill, the release of economic data continues to be disrupted, shifting traders’ focus back to central bank policies once again.
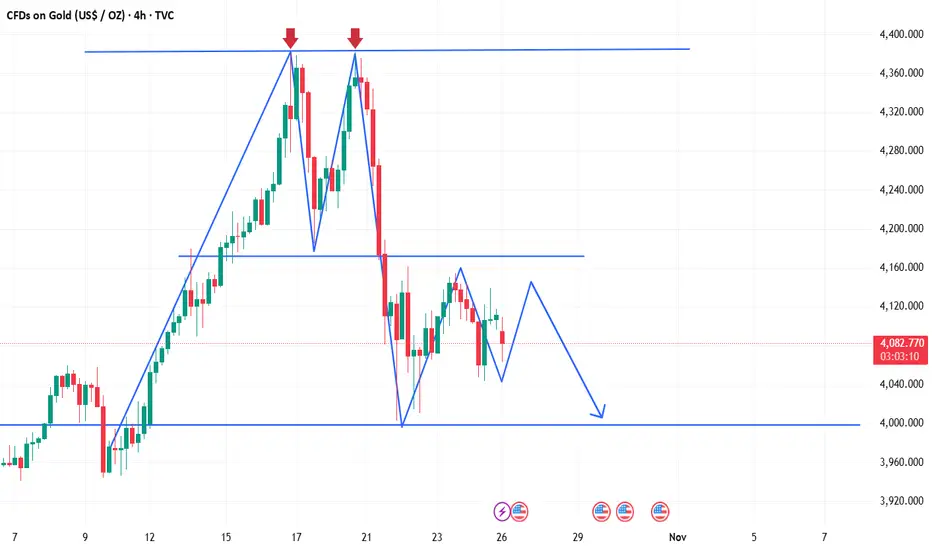
From a technical perspective, following the formation of a "double top" pattern on the 1-hour chart, gold has been oscillating under the resistance of the pattern’s neckline. Despite the bullish CPI data last Friday, gold bulls failed to push prices above the 4,160 level, indicating that short-term bullish momentum is still under significant pressure and gold is likely to remain in a wide-range consolidation. Looking at the 4-hour chart, after prices fell from the "double top" pattern, they rebounded with support from the acceleration line: the lower boundary of the range was reclaimed last Thursday, followed by a second bottoming-out and rebound on Friday—signaling that the short-term support at the lower boundary has been basically confirmed.
The key range currently lies between 4,060 and 4,170, and these two levels can be regarded as the dividing lines for short-term bullish and bearish trends. A break above 4,170 would suggest strengthened rebound momentum, potentially leading to a further test of the upper channel edge around the 4,300 area. Conversely, a break below 4,060 may trigger a continued decline toward the 4,000 support level—this forms the core framework for the current market movement.
Today’s trading strategy will revolve around the 4,000–4,170 range, prioritizing short positions at higher levels and long positions at lower levels. If prices break above 4,170, it will indicate that gold bulls have regained control, requiring a timely strategy adjustment to enter long positions on pullbacks.
Gold is weak. Short-term short selling is recommended.Spot gold rebounded on Friday, paring intraday losses after weaker-than-expected US Consumer Price Index (CPI) data, closing above 4,100. However, it remained in a negative trend for the week, ending the previous nine-week winning streak. The weak inflation data reinforced market expectations of a 25 basis point interest rate cut by the Federal Reserve at its October 29-30 monetary policy meeting. Market sentiment improved on hopes of a easing of the Sino-US trade standoff. The White House confirmed on Thursday that US President Trump will meet with the President of Korea on the sidelines of the APEC summit in South Korea on October 30, a development that could help ease recent trade tensions.
Technically, gold is showing initial signs of consolidation after a strong rebound. The short-term outlook has turned bearish, as gold prices are currently trading below the 21-, 50-, and 100-period simple moving averages (SMAs) on the 4-hour chart, suggesting fading bullish momentum. From a wave perspective, the 4-hour chart shows an ABC corrective wave pattern, with 4380 as the starting point for wave A. Currently, gold is in the stage of confirming the high point of a wave B rebound, with a high probability of a subsequent wave C decline.
On the 1-hour chart, after forming a double top at 4380 this week and then retreating, the overall market is currently in a consolidation phase with a more bearish outlook. Resistance lies above 4160-4185, while support lies below 4004. Range-bound trading is expected next Monday. If there is risk-averse news over the weekend or if 4160 is broken directly, the weak trend can be reversed.

Gold XAUUSD Macro map for 27 to 31 Oct 2025Macro map for 27 to 31 Oct 2025
Concentration of policy and inflation prints means policy expectations and real yields will drive the United States dollar, global equities, bitcoin, and gold. The hinge events are Wednesday FOMC, Thursday US GDP advance and German data, Friday US Core PCE and Chicago PMI. Secondary drivers are BoJ policy guidance and ECB tone, plus BoC.
Watch list
Real ten year yield and the DXY dollar index after FOMC and PCE
EUR front end versus USD front end after ECB and FOMC
VIX around the FOMC window and into PCE
US liquidity windows around 14:00 Eastern on Wednesday and 08:30 Eastern on Thursday and Friday
Gold outlook for next week
Set up
Gold trades the sign and size of moves in real yields and the dollar. Policy guidance and inflation prints are therefore the core drivers. A patient or cautious Fed, softer Core PCE, and any rise in macro uncertainty support gold through lower real yields and safe haven demand. A hawkish tilt and firmer PCE pressure it by lifting the opportunity cost of holding a non yielding asset.
Baseline view
The tape prefers a slow glide toward price stability without a growth accident. That backdrop keeps real yields contained or drifting lower and supports gold on dips. The opposite mix lifts real yields and weighs on the metal. Flows often scale in after the first spike around FOMC and PCE once spreads and liquidity stabilize.
Scenarios and probabilities
Upside continuation or breakout. Probability forty. Triggers are a patient FOMC and cooler PCE that push real yields down. A softer dollar would reinforce the move.
Balanced consolidation inside the recent weekly band. Probability thirty. Triggers are mixed signals across events and no major shift in real yields.
Pullback to prior support. Probability thirty. Triggers are firmer PCE or hawkish communication that lifts real yields. Dollar strength would confirm.
Key confirms and risks
Track the ten year real yield and the DXY. If real yields fall while the dollar is flat the setup still favors gold. If both rise, risk control becomes priority. Liquidity can thin quickly in the first minutes after data and during press events. Use predefined risk units and avoid adding into fast markets.

XAUUSD 1D: Short Setup – Retracement to FVG Before DropKey Observations:
Market Structure Shift (MSS):
A recent large bearish candle (the red candle around October 20th) appears to have broken below a significant short-term low, which is often termed a Market Structure Shift (MSS) in institutional trading concepts. This indicates a potential change from bullish to bearish momentum.
Fair Value Gap (FVG): An unfilled price area (marked by the gray shaded box) has been identified as a FVG.
This zone often acts as a magnet where price is expected to return to "fill" the inefficiency before continuing its main direction.
Liquidity/Return Levels (CRT-L and CRT-H):The Current Range Top CRT-L marks the top of the price inefficiency or the potential area where price could reverse after filling the FVG.
The Current Range Low CRT-H marks the level where price has recently closed.Projected Move: The analysis suggests a short-term relief rally or retracement (dotted line) to move higher into the FVG area 4160$ to 4210$. Once the price moves into or near the FVG and potentially the CRT-L, the expectation is a strong bearish rejection (large green arrow) that would push the price back down, possibly towards or below the recent low CRT-H.
Conclusion:The dominant short-term bias is bearish, but a temporary bullish retracement is anticipated to fill the Fair Value Gap before the bearish continuation.

XAU/USD Bullish trend analysis Read The captionSMC Trading point update
Technical analysis of XAU/USD – Bullish Continuation Setup (1H Chart)
Technical Overview:
Instrument: Gold Spot (XAU/USD)
Timeframe: 1 Hour
Current Price: $4,114
Next Target: $4,220
---
Chart Breakdown:
1. Demand Zone (Blue Box):
The price has respected a key bullish order block / demand zone between $4,040 – $4,080, showing strong buyer reaction (green arrows).
2. Ascending Trendline Support:
Multiple rejections from the ascending trendline confirm higher lows, signaling ongoing accumulation from buyers.
3. Fibonacci Retracement:
The market retraced around the 0.618 – 0.786 Fibonacci levels — a strong buy zone for continuation setups.
4. Moving Averages (EMA 50 & EMA 200):
EMA 50 (Blue) is trying to cross above the EMA 200 (Black), hinting at a possible bullish crossover.
A successful break above both EMAs would confirm bullish momentum.
5. Bullish Flag / Wedge Pattern:
The structure shows a bullish flag/wedge forming after an impulsive upward move — indicating potential for another breakout rally.
---
Trade Idea:
Buy Zone: $4,070 – $4,100
Target 1: $4,160
Target 2: $4,220 (main target on chart)
Invalidation (Stop Loss): Below $4,030
Mr SMC Trading point
---
Market Bias:
Bullish Bias – As long as the price holds above the highlighted demand zone and the ascending trendline, buyers remain in control. A breakout above recent highs will confirm momentum toward the next target.
---
Pelas support boost 🚀 this analysis

GOLDGOLD is showing signs of bullish sideways, any drop is an opportunity for buys.
Disclosure: We are part of Trade Nation's Influencer program and receive a monthly fee for using their TradingView charts in our analysis.

After the gold shock, there may be a chance to break below 4000
News:
Last Friday, the US released CPI data. The reported decline in the figure supports the Fed's interest rate cut, which is bullish for gold, pushing it as high as 4135. However, the overall gain was not particularly strong, with continued volatility due to the limited rebound in the data, closing around 4114.
Next week will be the Fed's interest rate decision. Next week is the Federal Reserve’s interest rate decision. A rate cut is a foregone conclusion, and the extent of the positive impact is already limited. The increase before and after the data is released is estimated to be small. Therefore, after the volatility, I am optimistic that the gold price will weaken and fall next week, and it may break below the 4,000 mark. The idea is to rebound and short.
Specifically:
After the double top of gold in 4 hours, gold still fluctuated back and forth under the pressure of the neckline of the double top in 4 hours. Although the CPI was bullish for gold on Friday, it did not allow the gold bulls to break through 4160. This shows that the gold bulls are still under pressure in the short term, and gold will continue to fluctuate in a large range. If gold cannot break through 4160 at the beginning of next week, it will still be bearish, and we will continue to pay attention to the support around 4000.
If gold is stimulated by safe-haven news next weekend or directly breaks through 4160, then gold bulls may start to fight back and continue to go long at that time.
Trading strategy:
Buy: 4135-4125, SL: 4145, TP: 4105-4080

Gold price analysis October 27GOLD ANALYSIS – Bullish wave structure remains intact
From the current wave outlook, gold has started to form a sequence of bullish impulses following a period of corrective movement. The key point of focus right now is the resistance zone at 4146 — this area represents a crucial threshold for the next bullish leg.
If buyers manage to push through this zone with strong momentum, the price could quickly retest or even break the all-time high (ATH) levels in the coming sessions.
For the upcoming week, the BUY setup continues to be the primary strategy as long as the structure remains valid. The 4056 support zone serves as the main base of this bullish setup — a break below it could temporarily weaken the path toward ATH recovery.
📈 Trading Plan:
BUY now: 4114
BUY trigger: Price rejection around 4056
Target: 4375

EURUSD Analysis week 44🌐Fundamental Analysis
Business activity in Germany and the Eurozone continued to improve in October. This positive data helped the Euro maintain its strength in the European session.
However, experts warn that the growth outlook remains fragile, despite the current favorable conditions.
In the US, CPI inflation in September is forecast to increase to 3.1%, with core CPI rising 0.3%. A higher than expected figure could strengthen the USD and put pressure on EUR/USD; conversely, weak data would support the Euro's recovery in the US session.
🕯Technical Analysis
EURUSD is making a strong upside recovery towards the resistance of 1.172. A break above the 1.162 zone would immediately become an important support zone supporting the EURUSD's upward momentum. The BUy strategy will be paid more attention next week. The weekly support zone of 1.158 will play a key role for the buyers, if this zone is broken, the pair will fall into a strong Downtrend.
📉Trading Signals
SELL EURUSD 1.172-1.174 Stoploss 1.179
BUY EURUSD 1.158-1.15600 Stoploss 1.153

Gold at a Critical Crossroads: Surge to $4700 or Drop to $3500?If the price breaks through the yellow zone, it could reach the red zone range. And if it doesn't cross the yellow zone, there's a chance it could head toward the 4700 range

XAUUSD Bearish Outlook – Liquidity Grab Into FVG ZoneThis is my new update for gold. On the 1H timeframe, we can see a double top followed by a change of character (CHOCH) to the downside, confirming bearish intent. I’ve marked two Fair Value Gaps (FVG 1 and FVG 2) as potential retracement zones.
Price has now reached a support level and bounced, forming equal highs (marked with dollar signs), indicating liquidity above. I expect a liquidity grab above these equal highs before a potential drop.
The retracement may reach FVG 1 (~50% Fibonacci) or FVG 2 (~61.8% Fibonacci). From either level, if we see a CHOCH to the downside on the 5M timeframe, that could be a strong sell confirmation, aligning with the 1H bearish structure.
My target is around $3,950, making this a high-probability short setup based on Smart Money Concepts.

Last trading day. Watch for resistance levels.After the CPI data was released as expected, while the results appear bullish for gold, the market reaction was muted, and the price rebound was relatively weak. This is likely because the current gains may have already overdrawn all positive expectations, and the market needs a period of cooling off.
On the 4-hour chart, gold prices rose on the data, returning to a range of fluctuations. The moving averages are showing a relatively flat trend. The 5-, 10-, and 20-minute moving averages intersect with the middle Bollinger Band in the 4100-4110 range, which also represents a significant short-term support level. The 30-minute moving average is nearing its intersection with the upper Bollinger Band in the 4170-4180 range.
Based on technical indicators, watch for resistance at 4160 in the short term, with a breakout at 4180. Focus on support at 4100-4110 below.
Quaid believes that as the last trading day of the week, the price may also fluctuate slightly around 4130. But if it suddenly starts to break upward, then we need to pay attention to the suppression situation above. When the price first hits around 4160 and fails to break upward effectively, short sell with a light position at this position and make a profit of 30-40 points.
A happy weekend is coming, Quaid hopes everyone reaches their profit targets this week.

Gold bulls under pressure await reversal
News:
Spot gold prices fluctuated within a narrow range, consolidating after a sharp pullback from all-time highs. Spot gold traded around $4,133 intraday, rising slightly after two consecutive days of decline, as safe-haven demand remained supported by a combination of economic anxiety and geopolitical tensions.
The US-China trade standoff remained a focus for investors, with reports that Washington was considering new export restrictions ahead of the US-China talks.
The US government shutdown, now in its fourth week, continued to weigh on market sentiment. Meanwhile, the prospect of further monetary easing from the Federal Reserve also impacted investor positioning.
Specifically:
The 4-hour level six-month moving average and the 2-hour level 66-day moving average of gold are resonating support at the 4160 line. Today, we will see its gains and losses. The 4-hour 5-day and 10-day moving averages are concentrated at the 4140 line. Breaking below this level today triggered further declines.
Currently, the upper side is focused on short-term resistance at 4160, while the lower side is focused on short-term support at 4065-4070. Gold is under pressure and struggling to break through. Trading strategies should prioritize shorting during rebounds and under pressure. For intermediate positions, be cautious in following orders and patiently wait for key entry points.
I'll provide detailed trading strategies on the channel, so stay tuned.
Trading strategy:
Buy: 4165-4160, SL: 4175, TP: 4120-4090

GOLD WEEKLY CHART MID/LONG TERM ROUTE MAPHey everyone,
Please check out our updated Weekly Chart Route Map, featuring updated revised key levels after completion of our last long term weekly chart idea for precise level-to-level tracking.
We’ve refreshed our long-term structure on the weekly chart. Price action recently rejected the 4294 level and is now range-bound between 4284 (resistance) and 4059 (support). This consolidation aligns with a detachment from the EMA5, highlighted on the chart with a circle. Even if a full detachment doesn’t materialize, a partial (halfway) correction remains the more probable scenario.
To determine the next directional move, we’ll need a decisive test and break of either boundary level. On the broader horizon, 3006 stands as the long-range pivotal swing zone, which may come into play if a major correction unfolds.
🔹 Note: The key distinction between a retracement range and a swing range is that swing ranges typically produce larger bounces and wider price reactions compared to standard retracement ranges.
We’ll continue to update this outlook throughout the week as the structure develops. Thank you all for your likes, comments and follows, we really appreciate it!
Mr Gold
GoldViewFX

GOLD on the RISE!XAUUSD moved as we analyzed. Now waiting for BreakOut from RESISTANCE to see if it will retesting and continue flying UP todsy or when markets reopen next week.

XAUUSD: The return of CPI and PPI newsAfter a series of absences from news, in today's trading session two CPI (Consumer Price Index) and PPI (Producer Price Index) will be announced. Therefore, OANDA:XAUUSD can be very volatile and we should be cautious in the last trading session of the week.
The CPI is forecast to be favorable for the dollar and the PPI is forecast to be slightly lower than the previous period , but we still need clearer confirmation to assess the trend of gold in the near future.
Some key levels that we need to pay attention to in today's trading session:
Resistance: , ,
Support:
Support:
Strong support:
Always be patient and wait for the price to reach the support and resistance zones above and get confirmation. Do not place limit orders or enter orders when the price is increasing or decreasing sharply.
Take advantage of the above support and resistance zones and trade short-term when the price reacts at these support and resistance zones.
Take profit when the price moves from 10 to 20 prices since entering the order at the support and resistance areas.
Wait for reactions such as Engulfing candles, Doji,... at the support and resistance zones.
Always set stop loss when trading and manage risks closely.
Note : Price may spike through support or resistance levels and then reverse. Therefore, it is crucial to patiently wait for the candle to close before entering a trade.
Victor Dan @ ZuperView

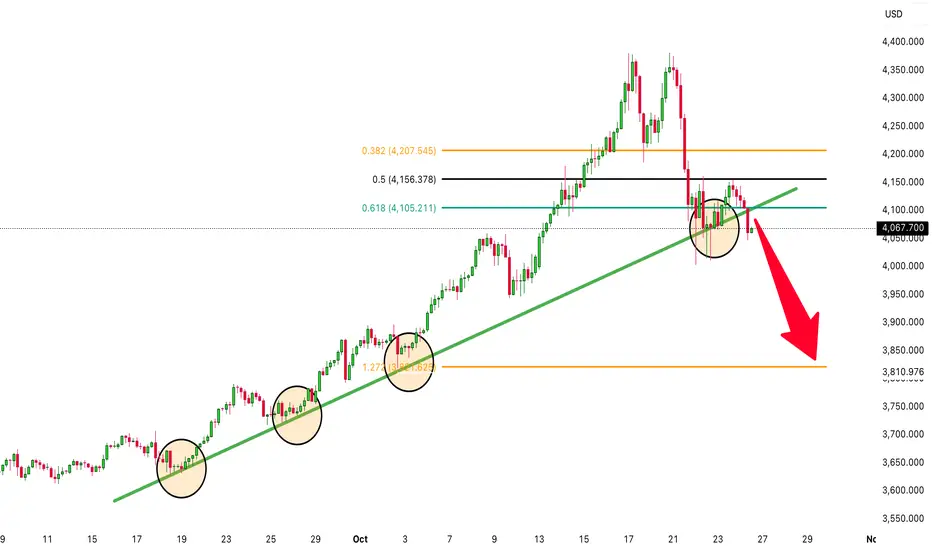
Time for GOLD To DROP! (XAUUSD is heading to the downside!)For many weeks gold (XAUUSD) has been sky rocketing to the upside, however there have been many new signals indicating that it could be a bearish move to the downside. Nothing keeps going up forever! Gold has broken major support levels including the trendline that has been holding it up for weeks. It has also been struggling to break above the fibonacci level of 0.50! Time to sell!
GOLD HIGH PROBABILITY SETUP SOON!!! 🚨 XAUUSD HIGH PROBABILITY BUY SETUP 🚨
* Here We Can See Clearly The Next Potential Moves For GOLD Coming Hours/Days.
* Keep Your Eyes Close On Your Trading Positions.
* Happy PIP Hunting Traders.
FXKILLA.
