“BOS Confirmed — Demand Retest for Next Bullish Leg🟡 GOLD (XAU/USD) – Bullish Continuation Setup from High Probability Demand Zone 🆙
🔍 Chart Breakdown & Key Insights
Price created a Break of Structure (BOS) to the upside → confirming bullish momentum ✔️
Retested the Demand Line + Support Zone → buyers defending strongly 💪
High Probability POI (previous accumulation zone) remains valid with liquidity swept below → smart money accumulation evidence 💰
Current pullback = healthy retracement into demand before potential continuation
🎯 Targets (With stickers)
🎯 Target Zone Price Region Sticker
TP1 → Retest recent high 4,165 – 4,175 🎯
TP2 → Liquidity above highs / extended target 4,180 – 4,195 🚀💸
TP1 hit possibility is HIGH due to bullish structure 📈
TP2 depends on strength of breakout ⬆️
📌 Trade Idea (High Probability Setup)
🟩 Buy Entry Zone:
➤ 4,120 – 4,130 (pullback entry at support)
🟢 Take-Profit:
➤ TP1: 4,170 – TP2: 4,190
📊 Risk-Reward Ratio: 1:2.5 – 1:3+ ✔️
🧭 Market Structure Sentiment
Factor Outlook
Trend Bullish 📈
Liquidity Upside still available 💧
Smart Money behavior Accumulation & continuation expected 💼
⚠️ Just watch if price breaks below the demand line → would weaken this bullish plan.
Goldprediction

XAUUSD BUYI took shot trade trade on asian session and price of gold went and touch demand zone were there was also bullish order block that push price to create another leg of W(Double bottom) and i expect price to pullback to a below marked Fair value gap and continue to BUY for a long term since buyers dominated the market for a while.

Slight fluctuations. Short sell in the resistance zone.Gold prices traded within a narrow range during Thursday's Asian and European sessions. Overall, however, they rebounded slowly after a pullback, a pattern that puts gold on track for a fourth consecutive monthly gain, extending the record-breaking rally in October when prices briefly approached the $4400 area.
This continued upward movement likely indicates that the current market still has strong support. After the previous pullback prompted some profit-taking, technical indicators continue to show strong underlying momentum, reinforcing the overall bullish trend.
Although the price action was limited today, gold has not yet broken out due to the US market being closed. Therefore, the focus should be on shorting in the short term. If the price remains in the dense resistance zone of 4170-4180, a small short position can be considered. If it breaks out upwards, then we will adjust our strategy accordingly.
Quaid believes that the possibility of breaking through the upper resistance level is unlikely. On the downside, continue to pay attention to the strong support at 4120-4130. If the pullback at the resistance level is large, then the next target is the 4110 level.
Trading Strategy:
Short at 4170-4180, stop loss at 4190, profit target 4140-4130.
I will adjust the strategy flexibly according to market fluctuations and update it in the channel.

Gold H1 - Can Gold reject 4167 and fall to 4133 today?🟡 XAUUSD – Intraday Smart Money Plan | by Ryan_TitanTrader (27/11)
📈 Market Context
Gold is trading inside an intraday consolidation after a strong H1 displacement. The session is now primed for liquidity engineering before the next leg.
Key narrative drivers traders must respect today:
• Stronger USD expectations continue to shape risk sentiment
• Institutional desks frequently exploit sweep zones during consolidation
• Range-bound conditions favor fakeouts → displacement → expansion mechanics
• Headlines around U.S. monetary tone amplify intraday volatility
The current chart highlights balanced liquidity both above and below structure, supporting a two-way SMC playbook.
🔎 Technical Framework – Smart Money Structure (H1)
Market is holding a rising channel, but internally ranging — a typical liquidity map scenario:
• Buy-side liquidity pocket: 4180 → 4182 (premium extreme)
• Sell-side liquidity pool: 4110 → 4133 (discount extreme / origin zone)
• Internal equilibrium zone: 4150–4170 chop region (no-trade area)
We expect this sequence:
Sweep → CHoCH/BOS → Displacement → Retest → Expansion.
🎯 Trade Plans for Today
🔴SELL GOLD 4180–4182 | SL 4190
Thesis: Premium liquidity sweep above local highs before downside displacement.
Activation rules:
• Price sweeps 4182 liquidity
• Bearish CHoCH/MSS + BOS down on M5–M15
• Imbalance retest / FVG entry after structure break
Targets:
• 4167 (nearest reaction)
• 4150 (equilibrium raid)
• 4135–4133 (discount retest)
🟢 BUY GOLD 4135–4133 | SL 4125
Thesis: Sell-side liquidity sweep into the origin zone before upside impulse.
Activation rules:
• Price taps 4133 pool (sweep below structure)
• Bullish CHoCH/MSS + BOS up on M5–M15
• FVG fill / bullish rejection wick confirmation
Targets:
• 4155+
• 4167 (reclaim zone)
• 4180+ (premium raid target)
⚠️ Risk Management
• Do NOT trade inside 4150–4170 without clear displacement
• Wait for CHoCH + BOS before execution
• Treat the upper and lower zones as liquidity traps, not trend entries
• Reduce size during news spikes unless structure confirms
• SL = wave invalidation, no averaging in chop
📝 Summary
Gold is in accumulation/redistribution mode. Desks may:
• Run buy-side liquidity at 4182, then displace down → retest discount
or
• Sweep sell-side liquidity at 4133, confirm CHoCH up → expand with impulse
Today is a liquidity session, not early trend chasing. Execute only after confirmation.
📍 Follow @Ryan_TitanTrader for daily Smart Money updates.

XAUUSD 30M — Retest Setup Toward Premium ZoneFOREXCOM:XAUUSD
Price is currently trading below trendline resistance after rejecting earlier highs. A potential pullback toward the 4,140–4,150 retest zone may offer a liquidity-based entry before continuation higher. As long as price holds above the invalidation zone, bullish structure remains valid.
Key Conditions
🔹 Bullish Scenario (Primary Bias)
Entry confirmation from: 4,140–4,150 zone
🎯 Target: 4,245–4,260
🛑 Invalidation/Stop: Below 4,120
A strong candle close above the trendline would further strengthen continuation.
Key Levels
Zone Type Level
Entry Zone 📍 4,140–4,150
Invalidation ❌ Below 4,120
Target 🎯 4,245–4,260
Trendline Break Confirmation Above 4,175
⚠️ Disclaimer: This analysis is for educational purposes only and not financial advice.

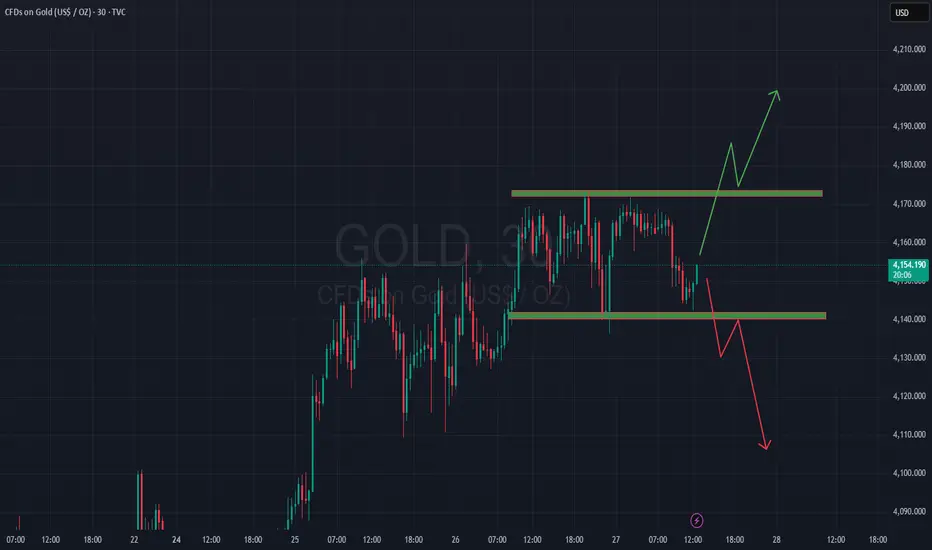
Gold is still moving sideways and waiting for a breakout1. Trendline Structure
Ascending Channel (red)
Upper trendline: price has been repeatedly rejected at the upper boundary → strong dynamic resistance.
Lower trendline: recently pierced slightly → indicates weakening buying pressure and increased correction risk.
2. Key Resistance
4,186 – 4,210: Strong supply zone + confluence with the upper trendline.
This is a zone that price will struggle to break without strong volume.
→ If price breaks above and successfully retests → the next target is the 4,210 area.
3. Key Support
4,105 – 4,110: Major support zone, confluence with EMA & the 0.5 Fibonacci level.
→ High probability that buyers will step in around this area.
4. Overview
Major Resistance: 4,186 – 4,210
Major Support: 4,105 – 4,110
Short-term Trend: weakening, leaning toward a corrective move.
Key Signal: a break below 4,140 → confirms a drop toward the support zone.
Bullish Scenario: only activated if the price reclaims 4,186.
BUY GOLD : 4107 - 4109
Stoploss : 4097
Take Profit : 100-300-500pips
SELL GOLD : 4209 - 4211
Stoploss : 4221
Take Profit : 100-300-500pips
Bullish trendCAPITALCOM:GOLD is consolidating the 4160-4170 as a very strong resistance. If it crosses. The next stop is around 4200. If it bounces back we can see 4140 as a support.

Buy after a pullback. Target price: 4200.From the daily chart perspective, gold has now returned above the moving average band, indicating a recovery in short-term bullish sentiment. While the sustainability of the rally remains to be seen, technical patterns suggest that prices may further test the resistance level of 4170-4180. If this level is broken, the next key resistance level to watch is the upper edge of the range at 4200-4210.
It's worth noting that due to the Thanksgiving holiday in the latter half of this week, market activity has slowed, potentially increasing the risk of abnormal price fluctuations due to insufficient liquidity. Range-bound trading may be the most reasonable scenario at present.
From the 4-hour chart, gold is expected to maintain a high-level consolidation pattern in the short term. The key support level to watch is the 4130-4120 area, which is also where the 5-day and 10-day moving averages intersect and can serve as a short-term dividing line between bullish and bearish trends.
The first resistance level is at 4180-4190. Only after a successful breakout can the space to reach the 4200 level be opened, but this may require the support of positive fundamental factors.
In summary, given the special market environment during the holiday, the recommended strategy is to primarily buy on dips, but strict position control is necessary to mitigate the risk of sudden fluctuations. Key short-term resistance is expected in the 4180-4200 area, while key short-term support is around 4130. Overall, caution is advised, and investors should be wary of the risks associated with market manipulation in a low-liquidity environment.
Trading Strategy: Buy on dips to 4140-4150, with a stop-loss at 4130 and a target of 4200.
I will adjust the strategy flexibly based on market fluctuations and update the information in the channel.

US MARKETS CLOSED TODAY - THANKSGIVING🚨 US MARKETS CLOSED TODAY - THANKSGIVING 🦃
Current Price: $4,150 - $4,156 📊
Yesterday's Close: $4,130
Monthly Performance: +3.94% ✅
Yearly Performance: +57.69% 🔥
Status: 🟡 HOLIDAY - THIN TRADING
🎉 MAJOR BULLISH NEWS! DEUTSCHE BANK UPGRADES FORECAST! 📈
BREAKING: Deutsche Bank raised its 2026 gold price forecast to $4,450/oz from $4,000, citing stabilizing investor flows and persistent central bank demand. The bank now expects a $3,950-$4,950 range next year
This is HUGE news for gold bulls! Major institution showing strong confidence in gold's future!
📊 IMPORTANT: TODAY'S MARKET CONDITIONS
🦃 Thanksgiving Holiday Schedule:
Gold will NOT be traded on November 27, 2025 due to U.S. Thanksgiving holiday
What This Means:
❌ US markets CLOSED all day
⚠️ Very thin liquidity globally
⚠️ Wide spreads expected
⚠️ Price gaps possible
✅ Good time to review positions
Friday (Nov 28):
Markets open but shortened hours
Very low volume expected (Black Friday)
Many traders still on holiday
💎 DEUTSCHE BANK FORECAST DETAILS
The Upgrade:
Deutsche Bank's new average forecast for 2026 stands at $4,450/oz, up from previous $4,000/oz. Bank anticipates gold to trade within range of $3,950 to $4,950 per ounce in 2026, with possible high near $4,950/oz - approximately 14% above current December 2026 futures prices
Why They're Bullish:
Key drivers: resilient investor demand, strong central-bank buying, limited supply response. Third-quarter supply-demand data supports continued central bank bid, with inelastic demand from central banks and ETF investment diverting supply from jewelry market. Overall growth in demand outpaces supply
Gold's unusually wide trading range in 2025—the largest since 1980—underpins constructive outlook for 2026
📈 CURRENT TECHNICAL ANALYSIS
Market Structure: BULLISH CONSOLIDATION 🟢
Gold trading near two-week highs above $4,170 after recent rally. Consolidating gains before next move.
Key Development:
Gold shrugging off Tuesday's small dip and pushing to multi-day highs above $4,170 per troy ounce. Move higher comes as US Dollar loses steam, even though US Treasury yields trying to rebound
Support Levels 🔵
Support 1: $4,130 - $4,140 (Yesterday's close - Immediate)
Support 2: $4,059 - $4,100 (Strong zone)
Support 3: $3,977 (55-day SMA)
Support 4: $3,886 (October 28 low)
Support 5: $3,750 (50% Fib retracement)
Resistance Levels 🔴
Resistance 1: $4,170 - $4,173 (Current highs)
Resistance 2: $4,245 (November 13 peak)
Resistance 3: $4,254 - $4,280 (Major barrier)
Resistance 4: $4,380 - $4,381 (All-time high - October 17)
📊 TECHNICAL INDICATORS
RSI: Heading toward 60 (Bullish momentum building) 🟢
ADX: Holding above 19 (Trend slowly gaining strength) ✅
Moving Averages: All pointing UP - Bullish alignment ✅
For now, momentum still leans bullish: Relative Strength Index heading toward 60, and with Average Directional Index holding above 19, underlying trend looks like it's slowly gaining strength
🎯 TRADING STRATEGY FOR THANKSGIVING WEEK
TODAY (Wednesday - Thanksgiving):
⚠️ DO NOT TRADE!
Reasons:
Markets closed
Zero liquidity
No meaningful price discovery
High risk of gaps
Best Action:
Review your positions
Plan for Friday/next week
Take the day off!
FRIDAY (Black Friday - Nov 28):
Trade with EXTREME Caution!
On November 28, XAUUSD may continue to rise, but price reversal still possible. Key support and resistance levels expected at $4,059.90 and $4,254.97
Strategy:
Wait for normal hours to resume
Use smaller position sizes
Expect wider spreads
Watch for gaps from Thursday close
NEXT WEEK (December Trading):
Back to Normal - Key Levels:
BULLISH Scenario (65%):
IF holds above $4,130-$4,140
Target: $4,245 → $4,280 → $4,380
Entry: Pullback to $4,140-$4,150
BEARISH Scenario (35%):
IF breaks below $4,100
Target: $4,060 → $3,977
Entry: Break and retest of $4,100
🌍 FUNDAMENTAL OUTLOOK
BULLISH FACTORS ⬆️⬆️⬆️
✅ Deutsche Bank Upgrade - Major vote of confidence!
✅ Analysts predict gold may reach $4,456-$4,509 by end of November
✅ Central banks purchased 634 tonnes YTD, WGC expects 750-900 tonnes for 2025
✅ Fed Rate Cut Expected - December odds rising
✅ Dollar Weakness - DXY losing momentum
✅ Demand > Supply - Structural bull market
✅ ETF Inflows - First net buying in 4 years
✅ Geopolitical Tensions - Safe-haven support
Key Quote:
Central banks planning record high gold allocations. Gold positioned as "ultimate protection against black swan tail risk events." ETFs returned to net accumulation in 2025 after four years of outflows
Risk Factors ⬇️
⚠️ Profit Taking - After 57% yearly gain
⚠️ Technical Overbought - Short-term
⚠️ Holiday Volatility - Thin markets
⚠️ Strong US Data - Could delay Fed cuts
💡 WEEK RECAP & OUTLOOK
This Week's Performance:
Current XAU/USD exchange rate: $4,155.98. Over past year, XAU/USD changed by 57.69%, trading within 52-week range of $2,583.49 to $4,381.60
Gold rose to $4,138.45 on November 25, up 0.07% from previous day. Over past month, gold's price risen 3.94%, up 57.22% compared to same time last year
November Performance:
✅ Recovered from $3,886 low
✅ Now at $4,150+ (Multi-week highs)
✅ +3.94% for the month
✅ On track for analysts' $4,456-$4,509 target
🔮 FORECAST & TARGETS
End of November (3 Days):
Expected: $4,200-$4,300 range
Target hit probability: 70%
December 2025:
Range: $4,150-$4,400
Target: Retest all-time high $4,381
2026 Targets (Deutsche Bank):
Average: $4,450/oz
Range: $3,950-$4,950
Potential High: $4,950 (+19% from current)
Long-term (Other Analysts):
Some forecasts: $5,000+ by late 2026
Ultra-bullish: $6,000+ by 2027-2028
🏆 PROFESSIONAL ANALYSIS SUMMARY
Gold is in a STRONG POSITION entering the holiday period. The Deutsche Bank upgrade is a major institutional endorsement of the bull market.
The Big Picture:
Technical: Bullish trend intact, consolidating at highs
Fundamental: Demand > Supply, Central bank buying strong
Sentiment: Major banks turning more bullish
Positioning: Healthy after recent consolidation
Key Insight:
Gold's upward trajectory is structurally supported rather than merely cyclical
This means the rally has LEGS - it's not just speculation, it's backed by real supply/demand fundamentals!
💪 TRADING PSYCHOLOGY - HOLIDAY EDITION
Take a Break!
Markets are closed, you should be too! Use today to:
Spend time with family 🦃
Review your trading journal
Plan for December
Recharge your mental energy
Remember: The best trade is sometimes NO trade!
🎯 POST-HOLIDAY TRADING PLAN
Friday (Nov 28):
⚠️ Avoid trading (thin liquidity)
Watch for any gaps
Let market settle
Monday (Dec 2):
Resume normal trading
Watch $4,140 support
Target $4,245 if bullish
Key Levels to Watch:
Above $4,170: Bullish → Target $4,245+
Below $4,130: Caution → Support at $4,100
📊 SUPPORT/RESISTANCE SUMMARY
Critical Support: $4,130-$4,140
Strong Support: $4,100, $3,977
Weak Resistance: $4,170, $4,200
Strong Resistance: $4,245, $4,280, $4,380
Breakout Level: $4,245 (Opens $4,380 retest)
Breakdown Level: $4,100 (Triggers correction)
🔔 THANKSGIVING MESSAGE
Happy Thanksgiving! 🦃
Whether you're trading gold or not, take time today to be grateful. The markets will be here tomorrow, next week, and next year. But today is for family, friends, and reflection.
Three Things to Be Grateful For in Trading:
Opportunity - Markets give us chances every day
Learning - Every trade teaches us something
Community - We're all in this together!
Enjoy your day! 🙏
⚠️ FINAL REMINDERS
For Today:
Markets CLOSED ❌
No trading possible
Relax and recharge 🦃
For Friday:
Shortened hours
Very low volume
Trade with extreme caution
Smaller positions
For Next Week:
U.S. third-quarter GDP data may influence gold prices
Back to normal volume
December rate decision approaching
Year-end positioning begins
📈 YEAR-END OUTLOOK
December Catalysts:
Fed rate decision (Dec 17-18)
Year-end positioning
Q4 GDP data
Holiday season (thin trading Dec 24-Jan 1)
2026 Setup:
With Deutsche Bank's $4,450 target and bullish structure, gold entering 2026 with strong momentum!
🦃 Happy Thanksgiving from the Trading Desk!
📱 Enjoy the holiday - markets resume Friday
💎 Stay blessed and grateful
🙏 See you next week for December trading!
#Gold #XAUUSD #Thanksgiving #DeutscheBank #BullMarket #GoldForecast #HappyThanksgiving #MarketHoliday #2026Outlook #TradingBreak

Gold - This is the bullrun top!⚰️Gold ( OANDA:XAUUSD ) is slowly reversing now:
🔎Analysis summary:
Starting back in the end of 2015, Gold established another major bullish cycle. Ever since the rounding bottom breakout, Gold has been rallying higher and higher. But at this exact moment, Gold retests major resistance and is slowly starting to create a reversal.
📝Levels to watch:
$4,000
SwingTraderPhil
SwingTrading.Simplified. | Investing.Simplified. | #LONGTERMVISION

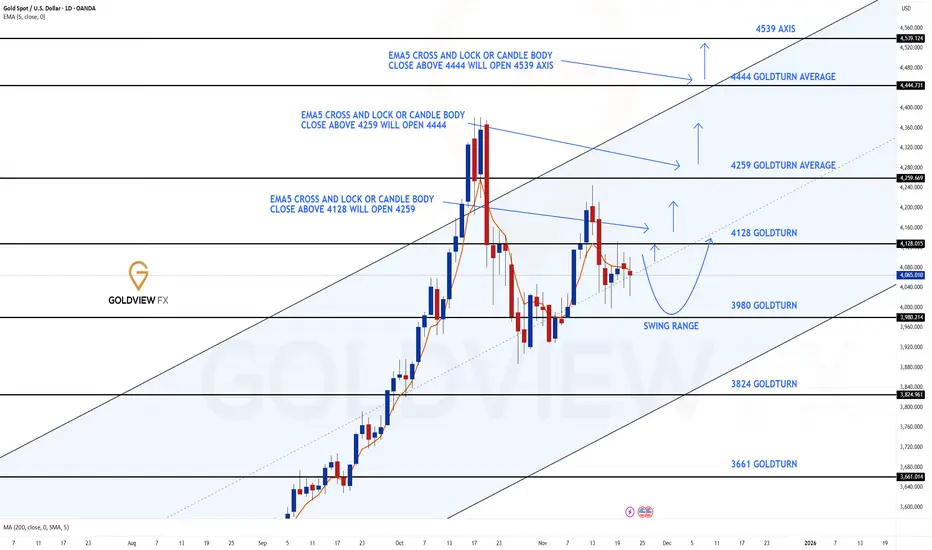
GOLD DAILY CHART ROUTE MAPHey everyone,
Please see our updated Daily chart route map with updated levels.
Price is currently playing between the longer daily chart range 4128 and 3980, with the channel half-line acting as support.
If this support holds, we should see a move toward the 4128 target. A body close or ema5 cross and lock below the half-line would open the swing range for a test and bounce. We're also watching for a break above 41238 to confirm a continuation above.
This is the beauty of our Goldturn channels, which we draw in our unique way, using averages rather than price. This enables us to identify fake-outs and breakouts clearly, as minimal noise in the way our channels are drawn.
We will use our smaller timeframe analysis on the 1H and 4H chart to buy dips from the weighted Goldturns for 30 to 40 pips clean. Ranging markets are perfectly suited for this type of trading, instead of trying to hold longer positions and getting chopped up in the swings up and down in the range.
We will keep the above in mind when taking buys from dips. Our updated levels and weighted levels will allow us to track the movement down and then catch bounces up using our smaller timeframe ideas.
Our long term bias is Bullish and therefore we look forward to drops from rejections, which allows us to continue to use our smaller timeframes to buy dips using our levels and setups.
Buying dips allows us to safely manage any swings rather then chasing the bull from the top.
Thank you all for your likes, comments and follows, we really appreciate it!
Mr Gold
GoldViewFX
XAUUSD (GOLD) I Firm Support Holding Above 4,000Welcome back! Let me know your thoughts in the comments!
** XAUUSD Analysis - Listen to video!
We recommend that you keep this on your watch list and enter when the entry criteria of your strategy is met.
Please support this idea with a LIKE and COMMENT if you find it useful and Click "Follow" on our profile if you'd like these trade ideas delivered straight to your email in the future.
Thanks for your continued support!

Gold H1 – Liquidity Plays as Hassett Leads Fed Chair Race🟡 XAUUSD – Intraday Smart Money Plan | by Ryan_TitanTrader (26/11)
📈 Market Context
Gold opens the week reacting to fresh political headlines as Kevin Hassett emerges as the frontrunner for Trump’s next Fed Chair.
This matters for gold because:
• A hawkish-leaning Fed Chair pick typically strengthens USD and weighs on gold.
• Markets may price in tighter policy expectations, increasing short-term bearish pressure.
• Political volatility ahead of the official announcement often triggers liquidity grabs on both sides.
With sentiment shifting toward a stronger USD, gold is positioned for classic SMC-style sweeps around key premium and discount zones.
🔎 Technical Analysis (1H – Smart Money Structure)
• Market Structure
Price has tapped into a minor premium zone and is showing early rejection signs.
Below, the 4140–4138 area aligns with intraday demand and the origin of recent displacement.
• Premium Sell Zone (1H Supply)
4210 – 4212
• Sits above current buy-side liquidity
• Clear premium relative to intraday structure
• High-probability sweep zone before any downside displacement
• SL region: 4220 liquidity pocket
• Discount Buy Zone (1H Demand)
4140 – 4138
• Previous CHoCH origin
• Aligns with discount retracement
• Confluence with unmitigated internal demand block
• SL region: 4130 sell-side liquidity
• Liquidity Map
• Buy-side: 4212 → 4220
• Sell-side: 4138 → 4130
Expect the typical SMC sequence:
Sweep → CHoCH → Displacement → Retest → Expansion.
🔴 Sell Setup – Premium Reaction
Entry: 4210 – 4212
Stop-Loss: 4220
Take-Profit:
→ 4160 (reaction level)
→ 4145 (mid-range liquidity)
→ 4140–4138 (discount zone retest)
📌 Only activate after a liquidity sweep + bearish CHoCH on M5–M15.
🟢 Buy Setup – Discount Reaction
Entry: 4140 – 4138
Stop-Loss: 4130
Take-Profit:
→ 4160 (intraday reaction)
→ 4185 (premium edge)
→ 4210 (liquidity sweep target)
📌 Valid only after sell-side sweep + bullish CHoCH.
⚠️ Risk Management Notes
• Headlines around the Fed Chair nomination may create sudden USD strength spikes—wait for structure shifts.
• Avoid trading inside the chop zone 4150–4180 without clear displacement.
• Treat today as a liquidity-driven session, not a directional trend day.
📝 Summary
Gold is rotating between premium and discount zones as markets digest news of Kevin Hassett leading the Fed Chair race, a development that could tilt expectations toward firmer policy.
Institutional players are likely to hunt liquidity above 4210 or below 4140 before committing to direction.
Key Levels Today (26/11)
🔴 Sell Zone: 4210–4212
🟢 Buy Zone: 4140–4138
Prepare for:
Accumulation → Sweep → Displacement → Retest → Target.
📍 Follow @Ryan_TitanTrader for daily Smart Money updates.

Market outlook and investment strategy: I am bullish.#XAUUSD TVC:GOLD OANDA:XAUUSD
Judging from the structural trend and the performance of gold in different timeframes, gold has formed a short-term double bottom structure based on the trend line, and the prototype of the W pattern is gradually emerging.
Although the price retreated slightly after touching the channel resistance level around 4160 in the evening, it did not break the current upward structure, and the market is still dominated by bulls. Meanwhile, influenced by multiple positive factors such as geopolitical uncertainties and rising market speculation about a December rate cut, gold still has the potential for further gains.
Therefore, based on the current trend structure and fundamental logic, in the future trading process, we can first pay attention to the short-term resistance of 4170-4180, which is a key resistance under the triangle consolidation pattern. When it first touches this level, we can try to short gold with a small position and set the stop loss above 4185 to prevent the risk of a strong bullish breakout.
Meanwhile, if this strategy is effective, we need to pay attention to the subsequent rebound after the gold price falls back and stabilizes, which will help confirm the completion of the W pattern. At that time, we will focus on the breakout of the neckline at 4200-4205. If it can stabilize above this level, the upside potential will be further opened up, and it may extend to 4240-4245, or even higher!
In summary, our trading strategy must closely follow the confirmation signals of the trend structure. Therefore, it is essential to strictly control position size and stop-loss. We will continue to monitor market dynamics and optimize our trading strategy accordingly.

Gold Trade Set Up Nov 26 2025Price pushed higher in Asia but engulfed to the downside in London so now i will be waiting for either a 15m engulfing/CISD to the upside to target BSL or a push lower to lower SSL

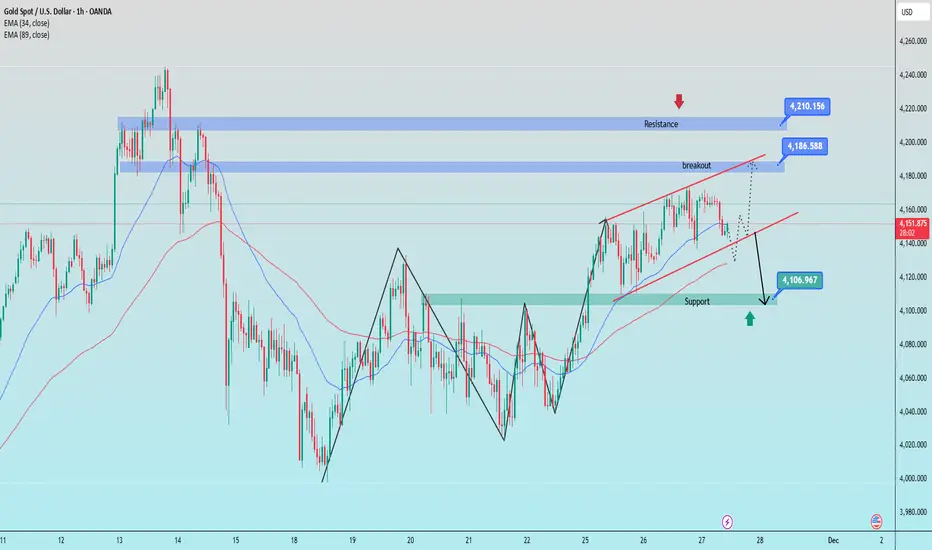
Gold Price Poised for Breakout as Bullish Channel StrengthensHi!
Market Structure Overview
Price is moving within a clearly defined ascending channel, forming higher highs and higher lows. The recent pullback corrected only about 35% of the previous bullish leg, indicating that buyers are still in control and momentum remains positive.
Key Support Zone (Green Area 4,150–4,175)
This zone represents a former supply that has now flipped into a potential demand area. Price is currently pushing into it from below, and the reaction here will determine the next major move. A clean break and hold above this zone would signal strength and open the path toward higher targets.
Breakout Scenario
If price breaks above the green resistance block, the chart suggests a bullish continuation toward the major supply zone highlighted in red (4,220). The drawn arrow implies that momentum could accelerate once the breakout confirms, aligning with the channel’s upper boundary.
Upside Target (Red Zone 4,220)
This red area represents a strong supply where sellers previously stepped in aggressively. Should price reach this level again, some form of reaction or correction is likely.
Downside Risk
If the breakout fails and price rejects the green zone, a retracement back toward the mid-channel dashed line or even the lower channel boundary would be the next logical move.
Disclaimer: As part of ThinkMarkets’ Influencer Program, I am sponsored to share and publish their charts in my analysis.

Gold weekly chart with buy and sell levelsNo big update this week heading away for a few days.
As always wait for levels these levels will come into play all week

GOLD at cut n reverse area? whats next??#GOLD.. market just made a fresh resistance area that is around 4170
keep close and if market hold it in that case we can expect a drop from here.
NOTE: we will go for cut n reverse above 4170 on confirmation.
good luck
trade wisely

XAUUSD 30M – Breakout + Retest Play | Smart Money BiasFOREXCOM:XAUUSD
Price successfully broke out of the descending structure and reclaimed previous resistance as support, showing bullish order flow. Two demand zones are visible:
First Entry Zone: 4,148–4,158
Layer Entry (Strong Demand): 4,120–4,132
If price retests either zone and holds support, continuation toward higher liquidity remains likely. Liquidity sits above 4,195–4,210, with extended draw toward 4,238–4,245.
Scenarios
✅ Bullish Continuation (Primary Bias)
Hold above 4,148–4,158
🎯 Target 1: 4,178
🎯 Target 2: 4,205
🎯 Target 3 (Final): 4,238–4,245 zone
🧱 Layer Entry:
If first zone fails → looking for reaction at 4,120–4,132 demand.
❌ Invalidation:
Break and close below 4,112 (structure flips bearish)
📌 Key Levels
Support: 4,148 / 4,132 / 4,112
Resistance: 4,178 / 4,205 / 4,238–4,245
⚠️ Educational only — not financial advice.

XAUUSD - buy gold...XAUUSD was recently in a short term downtrend for a few weeks but has now shown some clear bullish movements ahead. XAUUSD (Gold) has broken out of a downward trend channel that was acting as strong resistance, The price is very likely to head to the next strong resistance level which is marked as the take profit zone (green line). Time to buy GOLD!

Gold continues its upward trend. Continue buying.Gold prices remained range-bound above 4110 on Tuesday, with the short-term upward trend unchanged. Yesterday's article clearly stated that after breaking through the key resistance zone of 4110-4130, a short-term pullback to near support levels could present a buying opportunity, but one should not be overly optimistic about this upward move.
Recently, the most influential news is the expectation of a December rate cut by the Federal Reserve, and Tuesday's news that Ukraine has agreed to the terms of a peace agreement. One is positive, the other negative, but the expectation of a rate cut alone is unlikely to drive a significant rise in gold prices.
The expectation of a Fed rate cut forms the core support currently, reinforced by dovish comments from several officials. If subsequent economic data is weak, the upward momentum in gold prices will continue. Geopolitical risks have not completely subsided; details of the Russia-Ukraine peace agreement and the Middle East conflict remain uncertain, and market risk aversion could escalate at any time.
Technically, Tuesday's daily candlestick chart shows intense competition between bulls and bears; the 4-hour chart shows a bullish moving average alignment, with the Bollinger Bands widening upwards, and gold prices trading along the upper band, indicating a slightly stronger short-term trend. In the short term, a buy-on-dips strategy is recommended, with a key focus on the resistance level around 4180.
Trading Strategy:
Buy at 4130-4135, stop loss at 4120, take profit at 4180; if it breaks through, watch the 4200 level.I will adjust the strategy flexibly according to market fluctuations and update it in the channel.

XAUUSD GOLD Bullish Momentum. Here's My Trade PlanI'm closely watching XAUUSD (Gold) 🟡. Price has broken bullish structure and continues to trend upward on the 4H time frame 📈. As long as equity indices remain under selling pressure, we can expect risk-off capital flow into gold 💼➡️🪙.
I'm watching for a healthy pullback into the 61.8% Fibonacci retracement zone 🔄✨. If this level holds as support and price shifts bullish again with a break in market structure, I’ll be anticipating a continuation to the upside with a potential long setup 🛒📈.
Not financial advice. ⚠️
