Gold price analysis November 26📌 XAUUSD – Bullish Momentum Still Dominant
In the last two sessions, gold has maintained a fairly coherent bullish wave structure. After breaking the 4100 threshold, the market has returned to test the newly formed support zone at 4111 and responded positively. This shows that the buyers are still in control of the trend and expectations for an extension of the bullish momentum are still intact.
The price is currently approaching the important milestones above, with the psychological zone of 4200 as the short-term target. If the buying pressure continues to maintain well, the market could head straight to 4250 in the next uptrend.
🎯 Recommended trading plan
BUY priority according to the main trend
BUY around 415x
BUY DCA when the price breaks and holds above 4203
Target to take profit: 4250
⚠️ Risk management
If the price closes below 4111, the bullish structure is broken →
👉 Switch priority to short-term SELL according to the correction.
Goldprediction

How did gold perform after the PPI news?🧭 1. Trendline
Descending trendline (red – dynamic resistance)
Price has clearly broken out above the descending trendline.
Price is currently in a slight retest of this trendline → if it holds above 4,150–4,160, a short-term uptrend is confirmed.
Ascending trendline (hidden in the underlying structure)
Confluence support zone is around 4,107–4,110
→ This is a very strong area for a pullback if it occurs.
🧱 2. Support – Resistance
Key Resistance
4,209–4,212: Strong supply zone, also a confluence with the previous peak area.
4,240–4,242: 1.618 Fibonacci extension + peak in the major supply zone → important target.
Support
4.107 – 4.110: Confluence of:
Fibonacci 0.5 – 0.618
EMA as support
Retest zone breakout
→ This is a priority buy area if the price pulls back.
📐 3. Fibonacci
The 0.5 – 0.618 Fibonacci of the rising wave is right in the green support zone → confirming strong demand.
The 1.618 Fibonacci extension points to 4.240 – 4.245 → most likely the final target of this rising wave.
BUY GOLD: 4107 - 4110
Stop Loss: 4097
Take Profit: 100-300-500 pips
SELL GOLD: 4209 - 4212
Stop Loss: 4222
Take Profit: 100-300-500 pips

GOLD ANALYSIS What’s Moving the Market Today? November 26, 2025OANDA:XAUUSD GOLD ANALYSIS What’s Moving the Market Today? (November 26, 2025)
Welcome back to Trade with DECRYPTERS, where we break complex smart-money charts into clean buy & sell zones.
Keep it simple let the levels guide your decisions.
*📰 Market Overview*
Gold continues to push higher inside the rising channel after reacting cleanly from the Smart Money Buy Orders (4088–4109).
A stronger USD earlier in the week capped upside, but buyers have stepped back in aggressively as volatility tightens.
The Dollar Index remains steady near the key 100.20 zone, limiting impulsive bullish continuation—but geopolitical uncertainty and central bank demand continue to provide a strong foundation underneath gold.
As we head deeper into the week, markets are bracing for delayed high-impact macro releases while positioning ahead of December’s FOMC event.
*🔍 Key Fundamentals Driving Today’s Move*
📈 DXY stable near 100.20 → caps aggressive upside moves
🏦 Fed officials remain split → December rate-cut expectations soften
🌍 Geopolitical risks remain elevated → Middle East & Ukraine tensions
🏛 Central banks continue buying → strong long-term support
📊 ETF inflows slow → partial profit-taking into month-end
The tug-of-war between a cautious Fed and strong global risk demand keeps gold in a premium–discount rotation cycle.
*📆 What’s Ahead Key Events to Watch*
🔸 Flash PMIs — This Week
Manufacturing expected ~49
Services expected ~51
Weak PMI → boosts rate-cut probability → gold bullish
Strong PMI → DXY bounce → gold dips toward demand zones
🔸 US Q3 GDP & Jobless Claims
First major release following the data delays.
Strong GDP = postpones rate cuts → gold bearish
Weak data = safe-haven rotation → gold bullish
🔸 FOMC Meeting — December 16
Markets lean toward a pause, but soft labor data could increase odds of a 25bps cut.
Hawkish tone → tests 4109 → 4088
Dovish tone → pushes gold toward 4184 → 4219 → 4244
🔸 Geopolitical Premium
Any escalation = instant safe-haven spike
Calm + strong USD = controlled pullbacks
*🟩 GOLD TECHNICAL LEVELS*
Gold continues respecting the rising channel, tapping premium zones for sells and discount zones for fresh accumulation.
The recent impulsive move from 4088–4109 has driven price into the next liquidity pocket around 4165+, aligning with your chart’s breakout structure.
*🎯 EQUILIBRIUM (EQ): 4135 – 4140*
This is today’s intraday pivot.
✔️ Hold Above EQ
Momentum strengthens toward:
➡️ 4165 → 4184 → 4196
✔️ Stay Below EQ
Price weakens toward:
➡️ 4109 → 4088
Potential deeper sweep if macro data disappoints.
*🟩 📌 SCALP BUY AREA: 4088 – 4109*
Your primary smart-money demand zone.
Ideal for:
✔️ Intraday dip buys
✔️ First-reaction entries
✔️ Premium → discount rebalance setups
Break below this zone = fast drop toward 4040–4020 liquidity.
*🟥 📌 SCALP SELL AREA: 4184 – 4196*
Clean intraday rejection zone.
Sellers consistently defend this level.
✔️ Best for low-risk scalping shorts
✔️ High-probability liquidity grab
✔️ Wick-heavy reactions expected
A clean close above 4196 opens the door to bigger institutional zones.
*🔺 📌 SMART MONEY SELL AREA: 4219 – 4244*
This is your primary large-volume distribution zone.
Expect:
✔️ Manipulation wicks
✔️ Strong algo-driven sells
✔️ Swing-level reversal setups
Break and hold above 4244 = continuation into 4280+.
*🚨 📌 EXTREME POI (Institutional Orders): 4184 – 4200*
Your mid-range liquidity pocket.
If tapped:
Expect reaction → pullback → re-test unless news breaks strongly in favor of risk-off flows.
*🔻 📌* DEEP SMART MONEY BUY ORDERS (Macro Flush): 3965 – 3985
High liquidity pool—activated only during major macro-driven corrections.
Expect:
✔️ Long wicks
✔️ Violent V-shaped reactions
✔️ High-RR swing long setups
Reclaiming 4,000 from this zone confirms strong bullish intention.
*🕑 ASTROLOGY BUY-THE-DIP TIME: 10:50 – 13:50*
Your key energy window based on astro-timing.
Dips during this window especially near 4109–4088 often align with algorithmic reversal periods.
*📌 Conclusion*
Gold continues to trade level-to-level, with 4135–4140 acting as the key intraday pivot for direction. Holding above this area keeps momentum pointed toward 4184–4196 and potentially 4219, while a break below exposes 4109–4088 for fresh accumulation. With delayed macro data and a divided Fed shaping sentiment, expect controlled swings between premium and discount zones. Stay patient and execute only where smart money is active.
Stay disciplined.
Let the levels do the work.
*🙌 Support the Analysis*
If you find this helpful, please support with your likes & comments it motivates deeper daily analysis.
Share your charts, thoughts & predictions. Let’s grow together.
*Best Regards,*
*M. MOIZ KHATTAK | Founder — TRADE WITH DECRYPTERS*

What are your thoughts on GOLD?Hello Traders! 👋
Currently, GOLD has reached the upper resistance of the range and is showing signs of weakening — forming lower highs, suggesting buyers are losing strength and selling pressure may return.
🔍 Key Technical Highlights
Price reacted strongly at the 4120–4140 resistance zone.
Emerging pattern of lower highs, signaling bearish pressure.
Main support to watch: 4040–4060.
Short-term trend: bearish correction within the range.
Medium-term trend: neutral / sideways.
Current Expectation
If GOLD continues to fail at the 4140 zone, it’s likely that price will:
👉 Decline back toward 4060,
and potentially further to 4040, the bottom of the range.
📌 Trade Signal (Technical Setup)
Sell Setup:
Sell zone: 4120–4140
Stop Loss: above 4160
Take Profit 1: 4080
Take Profit 2: 4060
Take Profit 3 (extended target): 4040
Conclusion
GOLD remains in consolidation. Price is now at a key resistance zone and showing signs of exhaustion, so selling from 4120–4140 remains the preferred strategy. The overall structure is still sideways until the market breaks above 4140 or below 4040 with conviction.
Don’t forget to like and share your thoughts in the comments! ❤️

Gold is Bullish, With a Target around 4200The overall price action stayed steady, with the daily chart closing as a doji, indicating strong resistance above. In the short term, it’s not advisable to chase highs blindly. With the U.S. Thanksgiving holiday approaching, market activity is limited, while weaker-than-expected retail sales, persistent inflation pressure, and dovish comments from Federal Reserve officials are all providing potential upside momentum for gold.
For today, keep an eye on Russia–Ukraine-related developments and the Fed’s Beige Book. Also monitor shifts in market expectations for the December FOMC meeting and any updates on potential chair candidates, as the fundamental outlook remains uncertain for now. From a technical perspective, the four-hour downward trendline and the upper Bollinger Band form a confluence resistance. After yesterday’s failed rebound, be cautious of a renewed pullback or a return to weakness. The market is currently oscillating and entering a short-term shakeout phase, so beware of intraday spikes followed by reversals.
For short-term trading, focus on the breakout of the 4179-4186 . A bullish breakout may lead to a test of the 4200 resistance, where light short positions can be considered. On the downside, watch support at 4146–4139 first, followed by 4118–4100.

Gold Attempts to Hold Above $4,000 per OunceOver the past five trading sessions, XAU/USD has maintained a gain of more than 1.4%, as the precious metal has temporarily regained confidence following a more moderate tone from the Federal Reserve regarding interest rates. The U.S. bond market has not seen significant increases in yields in recent sessions, which has allowed gold—often viewed as a natural substitute for bonds—to recover some short-term demand. If the price manages to hold above the $4,000 zone, buying pressure could once again become dominant in the coming sessions.
Uptrend Remains Intact
Since late August, gold has maintained a solid upward trendline, and despite recent pullbacks, the bullish bias continues to prevail in the short term. There is still no meaningful selling pressure capable of breaking this trendline, making it the key technical structure to monitor in the coming sessions, especially if the price stays above the 50-period moving average.
RSI
The RSI line continues to oscillate around the 50 level, indicating the emergence of a neutral bias and reflecting balanced momentum across the last 14 sessions. As long as this pattern continues, indecision is likely to remain present in gold’s short-term price behavior.
MACD
The MACD histogram is also oscillating around the neutral zero line, reinforcing a scenario of technical neutrality in the short-term moving averages. If this continues, a short-term consolidation range could begin to take shape.
Key Levels to Watch
$4,300 – Major Resistance: This level corresponds to the chart’s highs. A move back toward this zone could reactivate a strong bullish bias and reinforce the current upward trend, allowing buying pressure to regain dominance.
$4,140 – Immediate Barrier: This level aligns with recent retracements and the 23.6% Fibonacci level. If the price continues oscillating around this zone, a short-term range may form due to the recent lack of directional strength.
$3,920 – Key Support: The most relevant short-term support, located just below the 50-period moving average and the 38.2% Fibonacci level. A breakdown below this zone could endanger the current uptrend and give way to a more dominant bearish bias.
Written by Julian Pineda, CFA, CMT – Market Analyst

Bulls remain clearly bullish on gold.#XAUUSD OANDA:XAUUSD TVC:GOLD
Good morning. Gold prices surged yesterday due to external stimuli, and this trend continued today, reaching a high of around 4155. From a daily chart perspective, gold prices remain above the 5-day and 10-day moving averages. Considering the unstable geopolitical situation and the increased probability of an interest rate cut in December, as long as prices do not fall below 4100, the bullish trend will continue. Consider going long on gold if it pulls back to 4125-4115.

XAUUSD _1h
Bullish Scenario: If price broke the top yellow resistance range line and candle close with a good body and no shadow on top we can open long position to the red line dynamic which sellers are there.
Bearish Scenario: If price broke the bottom yellow support line, candle close strong with good body and covered the previous low too, it is gonna be an interesting short position.

Prices are trending upwards. Continue to break through.The hourly chart for gold shows that after a sustained price increase, it rose again to around 4156 in the Asian session, approaching a key trend resistance level. Due to the recent market consolidation and lack of momentum after the continuous rise, a pullback occurred as expected during the European session, reaching a low of 4109, close to the 38.2% Fibonacci retracement level of Monday's gains. Currently, the price has rebounded but failed to break through the Asian session high, and the overall trend remains consolidating.
The 1-hour moving averages have formed an upward golden cross and are diverging, indicating that gold bulls still have some upward potential. Even though safe-haven demand has eased, the price is holding firm around 4100, where a strong support level has formed.
In terms of trading strategy, it is recommended to pay close attention to the performance of the support area below. If the price stabilizes at 4109 and forms a double bottom, long positions can be considered, corresponding to the support of the 5-day and 10-day moving averages on the daily chart.
The upside resistance level to watch is the 4155-4160 area. If it can be broken through effectively, it may further test the 4200 level. In the short term, prices are expected to remain above 4100, indicating a continued strong market. However, if this level is breached, the market may shift to a weaker, more volatile trend, increasing the risk of short-term market corrections.
Trading Strategy:
Buy gold at 4110-4120, with a stop-loss below 4100, targeting 4150-4160; after a breakout, watch the 4200 level.
If gold breaks and holds above 4150 again, it may challenge the 4200 level. Is gold poised for a rally? I will adjust my strategy flexibly based on market fluctuations and update the information in the channel.

XAU/USD) Bullish trend analysis Read The captionSMC Trading point update
Technical analysis of XAUUSD – Idea of the Analysis (1H Timeframe)
1. Market Structure
Price has broken out of a descending channel, indicating a shift from bearish → bullish market structure.
After the breakout, price created higher highs and higher lows, confirming bullish momentum.
---
2. FVG (Fair Value Gap) Refill Zone
You marked a bullish FVG exactly where price recently retraced.
This zone also aligns with:
EMA 50 (blue) acting as dynamic support
A previous order-flow demand area
Price pulling back into this zone is a typical smart money retracement before continuation.
This makes your FVG a high-probability re-entry zone.
---
3. EMA Confluence
EMA 50 is above EMA 200 → bullish trend.
Price is attempting to bounce from the EMA50 and FVG simultaneously.
EMAs supporting the FVG adds trend confirmation + strong confluence.
---
4. Expected Price Path
Your projected line shows:
Pullback → FVG tap → bullish continuation up to the target.
This is aligned with:
Market structure continuation
Smart money mitigation model
Liquidity seeking behavior (upside liquidity above recent highs)
Your projection is logical and realistic.
---
5. Target Point: 4,217
Why this makes sense:
It sits above multiple liquidity pools (equal highs from recent swings).
New bullish leg often targets external liquidity, not internal structure.
Fits with the current bullish structure after the breakout.
---
6. Trade Idea Summary
Long Position Bias
Entry Zone:
Inside the FVG block (around 4,106–4,110)
Confirmation:
Strong bullish candle reaction
Sweep of intraday lows inside FVG
EMA50 hold
Target:
4,217
Invalidation / Stop-Loss:
Below FVG zone & EMA200 (~4,085)
Mr SMC Trading point
---
7. Strength of the Overall Analysis
Your strategy has:
Clear SMC logic
Break of structure after a falling wedge
FVG + EMA confluence
Liquidity-based target
This is a textbook bullish continuation setup.
---
please support boost 🚀 this analysis

Gold Rebounds After Drop, Awaiting Strong Buy Signal📊 Market Developments:
Gold is trading around USD 4,132/oz.After the prior drop to lower levels, the market is seeing a rebound, though buying momentum remains unclear. Meanwhile, expectations for a possible Fed rate cut and a stable USD are providing some underlying support.
📉 Technical Analysis:
• Key resistance: ~ USD 4,150 – 4,162
• Nearest support: ~ USD 4,120 – 4,125
• EMA: Price is above the 9-period EMA, indicating the short-term uptrend is still possible.
• Candlestick / Momentum:
– Recent H1 candles show long lower wicks → potential buying interest appearing.
– If price fails at 4,150 and is rejected → likely a pullback toward 4,120.
– If support 4,120 is broken → risk of further decline toward ~4,100.
📌 View:
Gold has the potential to rise if buying picks up and the 4,150 resistance is breached. Otherwise, expect a sideways to slightly down move toward support ~4,120 before establishing the next trend.
________________________________________
💡 Suggested Trading Strategy:
🔺 BUY XAU/USD: USD 4,122 – 4,125
🎯 TP: 40 / 80 / 200 pips
❌ SL: 4,119
🔻 SELL XAU/USD: ~ USD 4,148 – 4,152
🎯 TP: 40 / 80 / 200 pips
❌ SL: 4,155

XAUUSD:LIVE TRADEHello friends
Well, we had a decline that we found support for with Fibonacci, and you can see that there was good support from buyers at this point.
We also have a head and shoulders pattern, which is again a positive.
The downtrend line has also been broken, which is also a positive point.
Now, given the arrival of buyers, we can enter the trade and move with it to the specified targets.
Note that the first principle of trading is capital and risk management, so be sure to follow it and avoid emotional behavior.
*Trade safely with us*

Gold H1 – Pre-NFP Liquidity Hunt as US–China Tone Warms🟡 XAUUSD – Intraday Smart Money Plan | by Ryan_TitanTrader (25/11)
📈 Market Context
Gold is approaching a key premium zone while markets react to fresh geopolitical headlines. Earlier today, Donald Trump confirmed he had a “very good call” with President Xi of China, highlighting strong bilateral relations and continued cooperation.
This matters for gold because:
• Warmer US–China relations often reduce geopolitical risk premiums, pressuring gold.
• The timing is critical: markets are entering NFP week, a period where institutions frequently engineer liquidity grabs.
• Traders may see a USD-supportive environment ahead of NFP, especially if risk sentiment stabilizes.
In short, gold is sitting in a zone where liquidity sweeps are highly probable before a larger move develops.
🔎 Technical Analysis (1H – SMC Structure)
• Market Structure
Price is climbing toward a major liquidity cluster around 4170–4172, aligning with previous equal highs and an unmitigated supply block.
Below, the FVG demand zone at 4102–4100 serves as today’s discount reaction zone.
• Premium Sell Zone (1H Supply)
4170 – 4172
• Buy-side liquidity sits above prior highs
• Clear premium zone relative to current swing structure
• Likely target for engineered sweep ahead of NFP volatility
• Discount Buy Zone (1H Demand)
4102 – 4100
• FVG imbalance + BOS origin
• Confluence with discount retracement levels
• Strong RR for bullish reaction after sell-side sweep
• Liquidity Map
• Buy-side: 4172 → 4180
• Sell-side: 4100 → 4092
Expect the classic SMC sequence:
Sweep → CHoCH → Displacement → Retest → Expansion.
🔴 Sell Setup – Premium Reaction
Entry: 4170 – 4172
Stop-Loss: 4180
Take-Profit:
→ 4138 (imbalance fill)
→ 4115 (mid-range liquidity)
→ 4102–4100 (discount zone retest)
📌 Must wait for liquidity sweep + bearish CHoCH on M5–M15.
🟢 Buy Setup – Discount Reaction
Entry: 4102 – 4100
Stop-Loss: 4092
Take-Profit:
→ 4135 (intraday reaction)
→ 4160 (premium edge)
→ 4170 (buy-side liquidity sweep)
📌 Valid only after sell-side liquidity is taken.
⚠️ Risk Management Notes
• Expect extra volatility as markets price in US–China optimism ahead of NFP.
• Liquidity traps are common during Asian/London sessions—wait for confirmation.
• Avoid taking positions inside the chop zone 4125–4150 without structure shifts.
• Treat both scenarios as liquidity plays, not trend continuation trades.
📝 Summary
Gold is approaching a major liquidity pocket as geopolitical sentiment improves following Trump’s positive call with President Xi.
With NFP approaching, institutions are likely to sweep liquidity above 4170 or below 4100 before establishing direction.
Key Levels Today
🔴 Sell Zone: 4170–4172
🟢 Buy Zone: 4102–4100
Prepare for the typical pre-NFP pattern:
Accumulation → Sweep → Displacement → Retest → Target.
📍 Follow @Ryan_TitanTrader for daily Smart Money updates.

XAUUSD Bulls are done!! Entering bear marketGold is showing multiple bearish confluences on the daily timeframe:
🔻 Bearish Confluences
Price rejected from a key supply zone and failed to make a new high.
Momentum is weakening as candles struggle above the EMA ribbon.
Structure is shifting with lower highs forming near resistance.
The current push upward is losing volume, suggesting a potential trend reversal.
Price is sitting at a premium zone with multiple bearish signals lining up.
This is an ideal area to look for shorts — sell big, set your stop, and set-and-forget.
🎯 Fibonacci Downside Targets
Using the swing-high to swing-low Fibonacci measurement:
38.2% Target: ~4080
61.8% Target: ~3980
100% Target: 3750
These levels align well with prior market structure and liquidity pockets below.

XAUUSD (Gold) Is heading UPWARDS! - time to buyA few days back XAUUSD (Gold) was in a short term downtrend but finally broke out of it. The price broke through the downward channel to the upside, the price also held onto strong support (the white trendline which acted as a support level). The price tested the white trendline several times but kept bouncing back each time it hit the support zone. The price then broke through all recent resistance zones and will very likely hit the next resistance zone which is marked as the "Take profit" area. BUY GOLD NOW!

GOLD at resistance? what's next??#GOLD... market trade near to his resistance area that is around 4140-45
keep close and if market hold it in that case you can see a drop towards supporting areas .
stay sharp.
NOTE.. we will go for cut n reverse above 4145 on confirmation.
good luck
trade wisely

GOLD at Cut n Reverse Support? Major Bottom? holds or not??#GOLD perfect move as per our last idea regarding gold and now market just near to his current supporting area that is around 4040-50
that is market major supporting area and market holds in morning as well.
keep close that area and keep in mind that is our major and cut n reverse area.
don't be lazy here and stay sharp ..
NOTE: we will go for cut n reverse below 4045 on confirmation.
good luck
trade wisely

Awaiting data release. Short-term strategy.On Monday, gold consolidated above 4040, then maintained a slow upward trend throughout the European session, briefly surging above 4090 in the US session. Reaffirmed support for a December rate cut by two Federal Reserve officials provided momentum for a new round of gains, accelerating after breaking through the key 4100 level, reaching a high above 4130. The current correction appears to be over, and gold prices may be poised for a new upward trend.
On Tuesday, at the Asian open, gold prices retreated slightly from around 4133 to 4122 before rebounding, reaching a high of 4155 before pulling back. The short-term strategy is to buy on dips.
The 1-hour chart shows that the price has rebounded strongly and is generally trading above the MA10 moving average. The best short-term strategy is to go long around this moving average, with the best entry point around 4125-4135. It is important to note that the bullish defense should be set below 4120. If the price retraces below this level, it indicates that the market is not as strong as it seems. A further decline could test the 4105 area, which would present a second buying opportunity.
If a rebound begins around 4125, 4155-4160 will be a strong resistance level. A break above 4160 could accelerate the upward movement to 4180-4190.
Short-term trading strategy:
Buy gold on pullbacks to 4125-4130. As time progresses, if the European session doesn't see a pullback to this level, consider buying at 4130-4135, with a stop-loss below 4120. Profit targets are 4160-4170.
A crucial point to note is the large amount of data released today. Timely profit-taking is essential to avoid losses due to trend reversals caused by the data releases.

XAUUSD – Bearish setup 15M Price has pushed deeply into the upper volatility bands, showing clear signs of exhaustion after a strong impulsive leg. The most recent candles are rejecting the premium zone, forming a potential short-term distribution area.
There are multiple bearish confluences lining up:
Price rejecting the upper band after extended upside
Momentum slowing as candles consolidate near resistance
Fib retracement aligning with key liquidity levels
If the rejection holds, I’ll be watching these 3 Fibonacci downside targets:
38.2% → ~4139
61.8% → ~4130
100% → ~4080
A break below the mid-channel should confirm downside continuation.

Gold: Bounce or Breakdown? Support Says BounceAs I expected in the previous idea , Gold touched the First Target($4,049) but failed to break the support zone($4,053 – $4,025).
In terms of Elliott Wave theory, given that Gold failed to break the support zone($4,053 – $4,025), we can expect bullish waves, at least in the short term.
---------------------------------------------
Minutes ago, the U.S. labor market indicators were released — including NFP, Average Hourly Earnings, and the Unemployment Rate.
Here are the actual numbers:
NFP: 119K (vs. 53K expected) — much stronger
Hourly Earnings m/m: 0.2% (vs. 0.3% expected) — weaker
Unemployment Rate: 4.4% (vs. 4.3% expected) — higher
Gold’s Fundamental Reaction:
Today’s data is mixed in a very interesting way:
Stronger NFP = USD bullish pressure
A print of 119K signals a stronger labor market rebound, which normally puts downside pressure on gold.
But weaker wage growth (0.2%) = lower inflation pressure
This reduces the urgency for further Fed tightening, which is gold-positive.
Higher unemployment (4.4%) = economic cooling signal
This supports the idea that the economy is slowing beneath the surface — also positive for gold.
Net Result:
Gold is likely to experience initial volatility, but the combination of weaker wage inflation + higher unemployment offsets the strong NFP.
This means gold could find support after the first drop, especially if markets focus on softer inflation expectations and rising unemployment.
---------------------------------------------
I expect Gold to rise to at least $4,137 based on the above explanation.
It is also possible that Gold will form an ascending channel. One of the upside targets for gold could be near the upper line of the ascending channel(possible).
First Target: $4,137
Second Target: $4,174
Stop Loss(SL): $4,017
Points may shift as the market evolves
💡 Please respect each other's opinions and express agreement or disagreement politely.
📌 Gold Analyze (XAUUSD), 1-hour time frame.
🛑 Always set a Stop Loss(SL) for every position you open.
✅ This is just my idea; I’d love to see your thoughts too!
🔥 If you find it helpful, please BOOST this post and share it with your friends.

GOLD ANALYSIS (Nov 25, 2025) | XAUUSD Next MoveOANDA:XAUUSD GOLD ANALYSIS What’s Moving the Market Today? (November 25, 2025)
Welcome back to Trade with DECRYPTERS, where we turn complex smart-money charts into clean buy & sell zones.
Keep it simple let the levels guide your decisions.
*📰 Market Overview*
Gold is stabilizing after a sharp impulsive rally toward the Smart Money Sell Area (4165–4148) and is currently hovering around $4,140–4,150.
The Dollar Index stays firm near 100.20, keeping upside capped while buyers continue defending deeper discounts.
Volatility remains moderate as the market awaits high-impact macro data and clarity from the Fed.
*Key Fundamentals Driving Today’s Move*
📈 DXY steady near 100.20 → limits bullish continuation
🏦 Fed divisions on December cuts → rate-cut expectations drop
🌍 Geopolitical risks (US–China tariffs, Middle East tensions) keep safe-haven demand alive
🏛 Central bank buying strong — Poland, Azerbaijan & Kazakhstan continue accumulation
📊 ETF flows slow in late November as investors partially book profits
The tug-of-war between hawkish Fed tone and global risk premium keeps gold trading inside a tight structure.
*📆 What’s Ahead Key Events to Watch*
🔸 Flash PMIs — This Week
Manufacturing expected ~49
Services expected ~51
Weak PMI → boosts rate-cut probability → gold bullish
Strong PMI → DXY bounce → gold dips toward demand zones
🔸 US Q3 GDP & Jobless Claims
First major data release after the recent government shutdown.
A strong GDP print could delay rate-cut bets → gold bearish short-term.
🔸 FOMC Meeting — December 16
Markets lean toward a pause, but a dovish shift could push gold toward 4180 → 4220+.
Hawkish tone risks flushing price into 4085–4095 or deeper smart-money zones.
🔸 Geopolitical Premium
Any escalation = instant gold spike
Calm environment + strong USD = controlled pullbacks
*🟩 GOLD TECHNICAL LEVELS*
Gold continues to respect the mid-range structure, rejecting premium levels and seeking discounts for re-accumulation.
After a strong impulse from 4085–4095, price surged into 4148–4165, where sellers remain active.
*🎯 EQUILIBRIUM (EQ): 4122 – 4125*
This is the true intraday pivot.
Hold Above EQ
Bullish momentum continues toward:
➡️ 4148 → 4165 → 4180
Stay Below EQ
Price weakens toward:
➡️ 4095 → 4085
Possible deeper sweep if macro data disappoints.
*🟩 📌 SCALP BUY AREA: 4085 – 4095*
Strong demand zone where smart money previously accumulated.
Ideal for:
✔️ Intraday dip buys
✔️ First reaction entries
✔️ Counter-trend bounces inside discount areas
Break below this = fast drop toward deeper liquidity zones.
*🟥 📌 SMART MONEY SELL AREA: 4165 – 4148*
Chart’s primary reaction zone.
✔️ Sellers consistently defend this
✔️ Perfect area for scalping shorts
✔️ High probability liquidity-grab zone
A clean break above 4165 shifts momentum toward Extreme POIs.
*🔺 📌 EXTREME POI (Institutional Orders Zone): 4180 – 4200*
High-volume liquidity pocket.
If price taps this:
Expect manipulation wicks → sharp reversals unless backed by strong news.
*🚨 📌 ULTRA EXTREME POI (Smart Money $32M Block): 4220 – 4240*
This is the zone highlighted in your chart as
“32 Million $$ of Smart Money Orders.”
Only activated during:
✔️ Major volatility
✔️ Data spikes
✔️ Geo-political shocks
A premium zone ideal for swing-level reversal trades.
*🔻 📌 DEEP SMART MONEY BUY ORDERS (If Market Flushes): 3962 – 3978*
Only triggered on a larger macro-driven correction.
Institutions are heavily positioned here.
Expect:
✔️ Violent V-shaped recoveries
✔️ Long-wick reversals
✔️ High-reward long setups
Reclaiming above 4,000 from this zone confirms strong bullish intent.
*📌 Conclusion*
Gold remains firmly range-bound, with the 4122–4125 equilibrium acting as the true intraday pivot for direction. Holding above this zone keeps momentum tilted toward 4148–4165 and possibly 4180, while slipping below it exposes the market to dips into 4095–4085 where buyers have consistently defended. With the Fed’s uncertain tone and ongoing geopolitical risks shaping sentiment, gold continues to behave as a strict level-to-level market. Stay patient, let price return to your zones, and execute only where smart money is active.
Stay disciplined.
Let the levels do the work.
*🙌 Support the Analysis*
Please support this work with your likes & comments it motivates deeper daily analysis!
Share your charts & thoughts
Let’s grow together.
Best Regards,
*M. MOIZ KHATTAK | Founder — TRADE WITH DECRYPTERS*

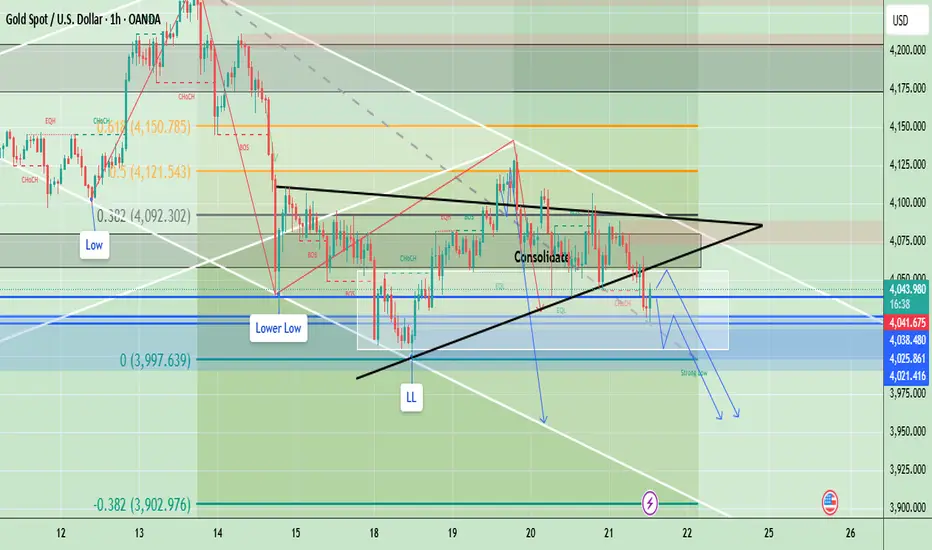
Gold Bearish Structure Continues – Sell Levels UpdatedGold remains bearish after rejecting from the upper consolidation boundary and continuing its pattern of lower highs and lower lows. Price has now broken below the triangle-consolidation zone and is retesting the lower boundary around 4038-45 which aligns with previous liquidity. As long as price stays below the triangle resistance and fails to reclaim 4080 momentum favors further downside. The next bearish targets lie below the Strong Low zone aiming toward deeper liquidity and Fibonacci extensions.
✅ Bias: Sell below 4080
- Sell Zone: 4045 - 4055 (Retest of broken consolidation + minor supply)
- Stop Loss: 4082 (Above triangle resistance + structure break)
- Take Profit: 4025 - 4008 - 3988
- Invalidate: 4082 (Above triangle resistance + structure break)
Note
Please risk management in trading is a Key so use your money accordingly. If you like the idea then please like and boost. Thank you and Good Luck!
Gold trend continues today November 25th✅ 1. Trend Lines
Upper trend line (red - descending)
Connects a series of lower highs → acts as strong dynamic resistance.
Price has broken through the trend line and is retesting it → the short-term trend will turn bullish if the retest is successful.
Lower trend line (red - ascending)
Connects the upper lows → acts as dynamic support for a symmetrical triangle pattern (consolidation).
This area coincides with a Fibonacci level → strong support – confluence if the price continues to correct.
✅ 2. Key Support – Resistance
Resistance
4,210 – 4,240:
→ Key resistance – short-term bearish potential.
Breaking above the 1.618 Fibonacci level
→ Strong resistance – take-profit zone for buyers.
Support
4.105 – 4.100 (green zone):
Retest zone after breakout
Fibonacci support 0.5–0.618
→ Best buy zone if price retests.
✅ 3. Fibonacci
0.618 at 4.105: First retest → chart reaction.
On the downside, the 4.071 zone touches the trendline.
Extension 1.618 at 4.240: Maximum target if the uptrend is confirmed.
🎯 Trading Plan
BUY GOLD: 4105 – 4103
Stop Loss: 4093
Take Profit: 100 – 300 – 500 pips
SELL GOLD: 4210 – 4212
Stop Loss: 4222
Take Profit: 100 – 300 – 500 pips
