GOLD ROUTE MAP UPDATEHey Everyone,
Great start to the week with our 1H chart idea playing out as analysed.
We started with our Bullish target 3653 being hit, followed with emA5 cross and lock opening 3678 - This was also hit perfectly completing the setup.
We will now look for a ema56 cross and lock above 3678 for a continuation into 3702 or failure to lock above 3678 will follow with a rejection into the lower Goldturns for support and bounce.
We will keep the above in mind when taking buys from dips. Our updated levels and weighted levels will allow us to track the movement down and then catch bounces up.
We will continue to buy dips using our support levels taking 20 to 40 pips. As stated before each of our level structures give 20 to 40 pip bounces, which is enough for a nice entry and exit. If you back test the levels we shared every week for the past 24 months, you can see how effectively they were used to trade with or against short/mid term swings and trends.
The swing range give bigger bounces then our weighted levels that's the difference between weighted levels and swing ranges.
BULLISH TARGET
3653 - DONE
EMA5 CROSS AND LOCK ABOVE 3653 WILL OPEN THE FOLLOWING BULLISH TARGETS
3678 - DONE
EMA5 CROSS AND LOCK ABOVE 3678 WILL OPEN THE FOLLOWING BULLISH TARGET
3702
EMA5 CROSS AND LOCK ABOVE 3702 WILL OPEN THE FOLLOWING BULLISH TARGET
3727
EMA5 CROSS AND LOCK ABOVE 3727 WILL OPEN THE FOLLOWING BULLISH TARGET
3747
EMA5 CROSS AND LOCK ABOVE 3747 WILL OPEN THE FOLLOWING BULLISH TARGET
3768
BEARISH TARGETS
3622
EMA5 CROSS AND LOCK BELOW 3622 WILL OPEN THE FOLLOWING BEARISH TARGET
3585
EMA5 CROSS AND LOCK BELOW 3585 WILL OPEN THE SWING RANGE
3556
3528
As always, we will keep you all updated with regular updates throughout the week and how we manage the active ideas and setups. Thank you all for your likes, comments and follows, we really appreciate it!
Mr Gold
GoldViewFX
Goldprediction

GOLD BULLISH TREND: Possible Buys From 3,640This week, my idea is for gold to continue pushing higher toward the all-time high liquidity. Price has recently broken structure to the upside, which confirms the bullish trend we’ve been seeing.
With this continuation, a new nearby demand zone has formed that I’ll be watching closely. Ideally, I’d like to see a pullback into that point of interest to allow proper accumulation before the next move up.
Confluences for GOLD Buys:
- Structure break to the upside confirms the bullish trend
- Clean, unmitigated 3hr demand zone below
- Higher and lower time frames both showing bullish control
- DXY remains bearish, which supports the bullish bias on gold
- No major news expected to disrupt the move
P.S. If gold respects the ATH and rejects it, breaking below my demand, then I’ll either look for short-term sells or wait for a deeper demand zone.

Gold on the eve of interest rate cut: opportunity or trap?Gold Technical Analysis: Further analyzing gold's trend from a technical perspective, since its decline from the 3675 high, the daily chart has failed to show a clear unilateral direction. Instead, it has exhibited a pattern of alternating negative and positive fluctuations with narrowing amplitudes. Furthermore, the K-line chart continues to trade above the unilateral moving average. This pattern clearly points to a period of consolidation within a bullish trend, rather than a trend reversal. This week's daily chart should focus on two key support levels: the 3600 area represents a short-term watershed between strength and weakness. If broken, the market could shift from strong fluctuations to weak corrections. The 3500 area represents a medium-term bull-bear reversal line. A breach of this level could trigger a fundamental trend reversal. Therefore, 3600 should be the primary defensive line.
The 4-hour chart shows more volatile gold: the Bollinger Bands continue to narrow, and the moving averages are highly converging. This indicates a complete lack of momentum needed for a unilateral rise or fall. For the time being, the 3615-3660 range is the preferred range. Based on cyclical patterns, the probability of a breakout of the Bollinger Bands on Monday and Tuesday is extremely low before the bands open. Therefore, high-certainty trading can be conducted on these two trading days around 3615 (lower support) - 3660 (upper resistance), without excessive expectations for a breakout outside the range.
Based on real-time trends, gold has completed a short-term correction since the opening. Based on the logic of oscillation, long positions can be established within the day based on support near the lower edge of the range: enter near 3625-3620 (aligned with the lower edge of the 4-hour range), targeting upward fluctuations. Focus on the 3650-3660 area (where the upper edge of the 4-hour range overlaps with key resistance on the daily chart). If the price rebounds to the 3660-3655 range and finds resistance, a small position can be used to test short positions, targeting a pullback to the 3635-3630 area, forming a closed-loop buy-low-sell-high strategy within the range. Note that after the adjustment, the current price is in the middle of the range. Direct entry is not recommended for now. Wait until the price approaches the -3625-3620 support level or the 3655-3660 resistance level before placing orders based on K-line stabilization/pressure signals to improve trading accuracy. Overall, the recommended short-term trading strategy for gold today is to primarily buy on dips, supplemented by higher rebounds. Focus on the 3655-3665 resistance level on the upside, and the 3625-3615 support level on the downside.

Gold price "V-shaped rebound", short-term bullish
💡Message Strategy
After hitting a record high last week, gold prices briefly encountered resistance and pulled back. However, buoyed by expectations of a Fed rate cut, gold prices remained stable above $3,600, fluctuating at a high level. The overall bullish trend remains strong.
Market news remained largely unchanged. Earlier, Fed Chairman Powell delivered a dovish speech, indicating downside risks in the job market and the possibility of a Fed rate cut. The subsequent release of dismal US non-farm payroll data, with new initial jobless claims reaching a four-year high, signaled a continued cooling in the labor market and further validated Powell's comments.
Furthermore, US President Trump has repeatedly pressured the Fed to slash interest rates as soon as possible. These factors have fueled high market expectations for a Fed rate cut, driving gold's recent rally. Although the rally encountered resistance last week, the rate cut and the international situation have limited any decline in gold prices.
📊Technical aspects
Initial jobless claims in the United States hit a nearly four-year high, further solidifying expectations of a Federal Reserve rate cut. This led to a short-term plunge in the US dollar and US Treasury yields, pushing gold prices back from their lows. Market expectations for a Fed rate cut remain high, providing significant support for gold prices.
Therefore, we recommend a volatile upward trend. Focus on support at $3,640, followed by $3,620, and upward pressure at $3,670.
From a technical perspective, the daily RSI remains in overbought territory, indicating limited short-term upward momentum and the possibility of continued range-bound consolidation. A break above the $3,658 resistance level could push the price back towards the all-time high of $3,675 and further challenge the psychological barrier of $3,700.
💰Strategy Package
Long Position:3640,SL:3620,Target:3680-3700

Gold Correction After ATH – Bearish Waves Ahead?Gold( OANDA:XAUUSD ) has been in a correction mode for the past four days after creating a new All-Time High (ATH) . The question is whether the correction will continue or not.
Over the past 4 days, US indices were released, but Gold was not greatly affected by these indices, although the manner in which the US indices were announced was in favor of Gold ( Maybe gold is saturated with buying. ).
Gold is currently trading in the Support zone($3,644-$3,636) and near the Support line.
In terms of Elliott Wave theory , it seems that Gold has completed the Double Three Correction structure(WXY), and we can expect bearish waves .
I expect Gold to break the Support zone($3,644-$3,636) AFTER breaking the Support line and fall to at least $3,624(First Target) .
Second Target: Support lines
Stop Loss (SL) = $3,662
Please respect each other's ideas and express them politely if you agree or disagree.
Gold Analyze (XAUUSD), 15-minute time frame.
Be sure to follow the updated ideas.
Do not forget to put a Stop loss for your positions (For every position you want to open).
Please follow your strategy; this is just my idea, and I will gladly see your ideas in this post.
Please do not forget the ✅ ' like ' ✅ button 🙏😊 & Share it with your friends; thanks, and Trade safe.

Gold 1H – Fed Week: Liquidity Sweeps Before FOMCGold on the 1H timeframe is ranging around 3,643 after a series of ChoCH/BOS prints. Liquidity is stacked above the intraday buy zone at 3,658–3,656 and higher at 3,676–3,678, while discount liquidity sits near 3,615–3,613. With markets pricing a potential Fed cut this week and dot-plot guidance in focus, expect engineered spikes into premium followed by mean reversion before any sustained move.
________________________________________
📌 Key Structure & Liquidity Zones (1H):
• 🔴 SELL ZONE 3,676 – 3,678 (SL 3,683): Premium resistance for engineered sweep/rejection targeting 3,665 → 3,655 → 3,645.
• 🟢 BUY ZONE 3,658 – 3,656 (SL 3,651): Intraday demand inside prior consolidation targeting 3,665 → 3,670 → 3,675+.
• 🟢 BUY SUPPORT 3,615 – 3,613 (SL 3,610): Discount demand at the base of structure targeting 3,630 → 3,645 → 3,655+.
________________________________________
📊 Trading Ideas (Scenario-Based):
🔺 Buy Setup – Intraday Reclaim (3,658–3,656)
• Entry: 3,658 – 3,656
• Stop Loss: 3,651
• Take Profits:
TP1: 3,665
TP2: 3,670
TP3: 3,675+
👉 Look for a sweep into the zone and an H1 close back above 3,656 to confirm order-flow continuation.
🔺 Buy Setup – Deep Discount Sweep (3,615–3,613)
• Entry: 3,615 – 3,613
• Stop Loss: 3,610
• Take Profits:
TP1: 3,630
TP2: 3,645
TP3: 3,655+
👉 High R:R if liquidity runs into protected demand before New York session.
🔻 Sell Setup – Premium Sweep to Resistance (3,676–3,678)
• Entry: 3,676 – 3,678
• Stop Loss: 3,683
• Take Profits:
TP1: 3,665
TP2: 3,655
TP3: 3,645
👉 Expect stop-run above recent highs into premium; invalidate on strong H1 close above 3,683.
________________________________________
🔑 Strategy Note
Into Fed week, smart money often runs both sides of the book. Bias today favors: discount buys at 3,658–3,656 and 3,615–3,613, and a premium fade at 3,676–3,678. Use reduced size, wait for structure confirmation, and avoid holding through any unexpected Fed headlines or USD spikes.

Which comes first, 3600 or 3700?International gold prices continued to fluctuate within a narrow range, hovering around the 3640 level. The range continued to narrow, and market sentiment clearly became more cautious. This phenomenon is due to investors entering a cautious wait-and-see phase regarding the upcoming Federal Reserve interest rate decision, which has weakened trading appetite and led to low price volatility.
From the 1-hour candlestick chart, gold prices are currently under pressure from a short-term downward trend line, with 3650 becoming the core bull-bear dividing line for today's market. If prices remain below 3650, short-term range-bound consolidation is likely, and caution is advised regarding the risk of a subsequent test of support. If prices break through and stabilize at 3650, it will indicate that short-term resistance has been broken, bullish momentum is expected to be re-released, and the market may resume its strong upward trend, heading towards the previous highs of 3656-3660.
Regarding downward support, the primary focus is on the lower band of the ascending channel. If this fails, strong support will focus on the 3600 mark. This level is not only a key support level that has been repeatedly tested previously, but also a crucial defensive line for the bullish trend on the daily chart. A break below this level would trigger a periodic correction.
Considering the high market uncertainty before the Fed’s interest rate decision is implemented, the recommended operating strategy is to focus on short-term trading: whether going long or short, positions must be strictly controlled to avoid large losses due to sudden fluctuations in news. The core principle is to “quit while you are ahead.”

Gold continues to fluctuate before the US interest rate decisionGold, after last Friday's continuation of the previous day's bottoming out and rebound, continued to fall into a range-bound oscillation mode, and after opening today, it continued to retreat to around 3626 before rising. Although there is no breakthrough between the bulls and bears at present, it is still in a tug-of-war, and the support below will also be maintained near the low point of 3626. This position is also the first watershed related to whether gold can continue to fall in the later period. The key pressure above is maintained near the previous secondary high point of 3655. This position is also the key suppression point for the recent retracement after multiple touches. It is also the shoulder position of the head and shoulders top, which also plays a role. It plays a connecting role, and once this position continues to suppress, gold may be under pressure again in the later period. If it does not break through again this week, gold may retreat again next week to test the support level of 3610. Although the daily line is still in a high sideways trend, the upward momentum has also declined significantly. If it bottoms out and rebounds, it needs a secondary definition of the European session, which is also an advance forecast of the US session. If gold rebounds to 3645-3655 during the day, short it and target around 3630-20. The strength of the European session may also determine the direction of the US session.

Will Gold Fly Again 3650 + ? Gold Looking For A High Pump
Gold Will Break The Triangle TL And Hit The BSL 3675
Have A Buy Trendline And RBS Green Box

The support is not broken,continue to go long when it falls backThe overall gold price is currently fluctuating and consolidating at a high level. Although gold has a slight correction in the Asian session this morning, it has not fallen out of the upward channel.
The market focus is still on the Federal Reserve's interest rate cut. In addition to this news, the fourth US-China meeting in Spain today is also worthy of our attention. If the two sides can reach a good negotiation on the tariff issue this time, then gold may fall. Otherwise, the price of gold will continue to rise.
Currently, gold has rebounded again and is consolidating around 3645. The short-term pressure from 3655-3665 is still there. If it fails to effectively break through this resistance area, then gold still has room for a short-term correction. Pay attention to the short-term support of 3635-3625 below. If the support is not broken, you can still consider going long on gold.
Can gold break through the resistance level?Whether you go long or short, you can make money, the only exception is the greedy. To invest, you must block excitement, or at least don't get excited at the wrong time. Emotions play a key role in all transactions. Spend all your time studying trends, never go against the trends, learn to follow, and then you can learn the essence. There is no invincible general in the financial market, and a person cannot make money beyond the scope of cognition. Investing itself is an assessment of self-cognition.
After gold fell to 3626, it rebounded slightly. It is still in a state of volatility as a whole, and the volatility is narrowing. From a technical point of view, the bullish momentum has not been exhausted, and the sideways movement of the gold market at this stage is far from over. From a big cycle perspective, 3675 is not a high point. However, as the interest rate decision approaches, both bulls and bears may turn to wait and see, and the short-term market is expected to be dominated by fluctuations, waiting for the Fed's monetary policy guidance! The upper resistance level is the pressure level formed by the two recent high points, and the support is at the lower track of the rising channel and the strong support of 3600.

XAUUSD on Rangbound XAUUSD is on rangbound on H4 3655-3620 is the consolidation zone along both rising and falling pattern on H4.
What possible scenario we have?
• XAUUSD on undisputed bullish rising wedge I'm holding my buy trades from 3632-3635 range and my Targets will be 3648 the 3656 , if golds remains above 3630-3627
• secondly if H4 candle closes below 3645 then we can do scalp within Rangbound also if 3620 flips below on H4 then my target will be 3590-3580.
All the entires should be taken once all the rules are applied

XAUUSD Looks Ready for a Big MoveHey everyone, Ken here!
Looking at the XAUUSD chart today, I see a lot of interesting things. The price isn’t rushing upward, but moving step by step – almost like buyers are slowly taking control.
Personally, I won’t jump in just yet. I’d like to see a clear rejection first. If that scenario plays out, my target would be around 3,683 .
What really matters here isn’t just the number, but patience. I’ll wait for price to return to the marked level, then watch volume and candlestick patterns for confirmation.
What about you? Do you think this setup makes sense? Share your thoughts in the comments!

3655-3625 oscillation structure, sell high and buy low#XAUUSD OANDA:XAUUSD
Over the weekend, I reminded everyone to pay attention to a hidden piece of news.💻
China and the United States are currently holding their fourth round of talks in Spain on economic and trade issues, which involves tariffs. The outcome of the game between the two major powers will also affect the trend of gold. 📊The two sides are still negotiating, so please continue to pay attention.👀
Gold continued to fluctuate in the box at the opening today, fell slightly during the day and rebounded after testing the support below again. 🌈The short-term upward pressure still remains at 3655-3665. 📉I have repeatedly emphasized that only by breaking through and stabilizing above can gold continue to open up upward space. If it is difficult to break through during the day, gold will continue to fluctuate and pull back.
The price of gold is still in an upward channel. The correction range of gold at high levels is limited. The short-term support below is 3635-3625.🥅 Before it effectively falls below the support, it is difficult for gold to change the volatile pattern. However, if the price breaks below support and breaks the box structure, it is very likely to test the 3600 mark, or even the important support level of 3580.🐻
If the 3655-3625 box is not broken during the day, the buy low-sell high strategy will be maintained. 📊If it falls back to 3635-3625, you can continue to go long on gold, with the target at 3655-3665. If the upper resistance is touched, you can short gold with a light position.

Price Action & Market StructureVery informative video discussing price action & market structure. Most importantly this week we have major impact news (FOMC) with expectancy of a interest rate cut which will move the markets significantly due to the fact we haven't had cuts since December 2024 during this time lots of money will transfer from both sides buyers & sellers so play it safe wait for perfect conditions with reserved risk to reward ratios to optimize your account.

XAUUSD AKA GOLDI wont go against the bias but we can see gold taking liquidity on the downside and price is bullish so we can see price go higher from next week.

With the interest rate cut coming, will gold fall or soar?The market is ever-changing. It's important to follow the trend; the trend is king. Plan your trades, trade your plans. How far one can go depends on who they walk with. How much a person can achieve in the market depends on who guides him. Let's witness what kind of turmoil gold will face next week with the Federal Reserve interest rate.
Gold has grasped the overall rhythm very well this week, the trading plan was executed smoothly, and the profit performance was satisfactory. After a slight pullback on Friday, gold rose again, and was suppressed near 3655-3660 above, and the oscillation stopped. This position also plays a role of connecting the above and the following. If this position continues to fail to break through, gold may pull back again next week to test the support position below. Although it is still in a high sideways trend at the close, the upward momentum has also declined significantly. I think whether the bulls can regroup next week is particularly important, which directly affects the later trend. Next week's interest rate decision has become the focus. Both market news and technical aspects are bullish for gold. Let us wait and see next week. If you feel your recent trading results are unsatisfactory and would like to avoid detours through clearer trading strategies and risk control, please feel free to discuss this with me.
Gold is currently in a high-level volatile pattern. After rising sharply and falling on Tuesday, it fell into a yin-yang alternating sweeping market. Before the Fed's interest rate decision, it is expected that the deadlock will be difficult to break. The market is waiting for guidance on policy direction. The key support is at the top and bottom conversion point and starting point of the 3610-3600 area. The bullish trend is maintained above it. If it breaks down, it may peak in stages. The trend suppression below Tuesday's highest point of 3674 is obvious. Next week, focus on the short-term support of the 3635-3630 area. If the Asian session tends to test the decline, the focus of the support below is near Thursday's low of 3610. If it breaks down, look at the 3600 and 3580 areas. If it breaks through the 3655 resistance above, it will turn strong in the short term and look at 3660 and the previous high. After breaking the high, focus on the 3680-3690 area. Maintain the overall range operation idea and follow the break.

Can gold continue to rise next week?With the right direction, the journey is not a problem. Time will prove your strength, and strength will win the future. Let trust become profit. The market is ever-changing, and following the trend is the best path. When the trend emerges, act accordingly; don't buy against the tide.
Gold had a relatively perfect week. After a slight pullback on Friday, it rose again. It found resistance around 3656-60 before oscillating and stalling. This level serves as a bridge between the past and the future. Next week's interest rate decision will be a key focus, and both market news and technical indicators are bullish for gold. Let's wait and see. If your current trading is not ideal, I hope I can help you avoid mistakes.
From the 4-hour analysis, the support below is 3628-30, and the short-term bullish strong dividing line is 3600. If the daily level stabilizes above this position, it can continue to maintain the rhythm of pulling back to low and buying in line with the bullish trend. The main strategy is to buy on dips.
I will remind you of the specific operation strategy during the trading session, so please pay attention to it in time.

GU, UJ & Gold: Calm Before the Storm | Fed, BoJ, BoE AheadThe markets have been stuck in ranges for weeks, GBPUSD, USDJPY, and Gold all moving sideways. In this video, I share a clear perspective on why that’s happening and what could finally trigger a breakout.
Here’s what you’ll gain:
✅A simple breakdown of the range structures on GBPUSD, USDJPY, and Gold.
✅The key economic events next week that could shake the market (Fed, BoJ, BoE, UK CPI & labour data).
✅Likely breakout scenarios and the triggers to watch.
✅How to avoid getting trapped while the price is still consolidating.
This is the “calm before the storm” phase, and knowing how to position yourself ahead of it could make all the difference.
👉 Drop a comment with the pair you’re watching most closely.
Trade smart, trade consciously.
Disclaimer:
Based on experience and what I see on the charts, this is my take. It’s not financial advice, always do your research and consult a licensed advisor before trading.

GOLDGOLD has been quite bullish and it has tapped our yearly target. If it maintains 3600 we are expecting further upside.
Disclosure: We are part of Trade Nation's Influencer program and receive a monthly fee for using their TradingView charts in our analysis.

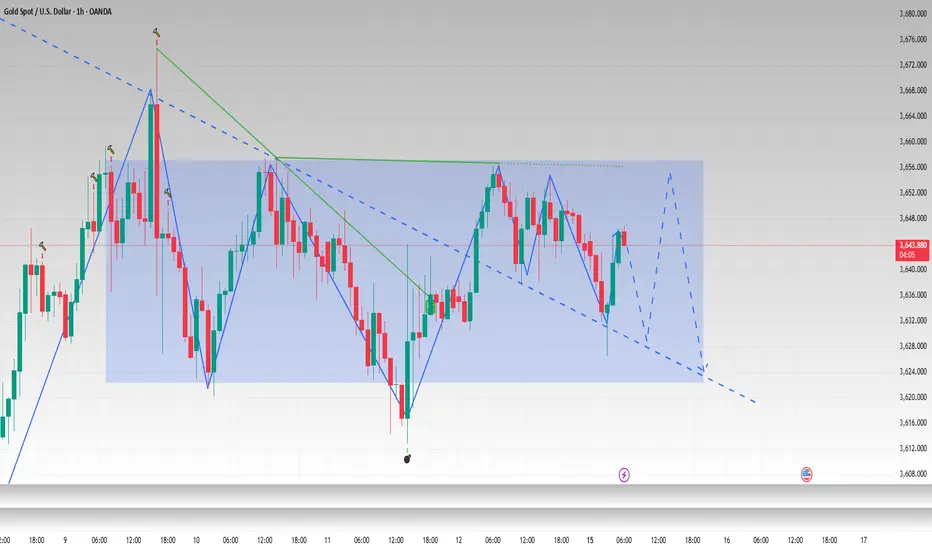
GOLD 1H CHART ROUTE MAP UPDATE & TRADING PLAN FOR THE WEEKHey Everyone,
Please see our updated 1h chart levels and targets for the coming week.
We are seeing price play between two weighted levels with a gap above at 3653 and a gap below at 3622. We will need to see ema5 cross and lock on either weighted level to determine the next range.
We will see levels tested side by side until one of the weighted levels break and lock to confirm direction for the next range.
We will keep the above in mind when taking buys from dips. Our updated levels and weighted levels will allow us to track the movement down and then catch bounces up.
We will continue to buy dips using our support levels taking 20 to 40 pips. As stated before each of our level structures give 20 to 40 pip bounces, which is enough for a nice entry and exit. If you back test the levels we shared every week for the past 24 months, you can see how effectively they were used to trade with or against short/mid term swings and trends.
The swing range give bigger bounces then our weighted levels that's the difference between weighted levels and swing ranges.
BULLISH TARGET
3653
EMA5 CROSS AND LOCK ABOVE 3653 WILL OPEN THE FOLLOWING BULLISH TARGETS
3678
EMA5 CROSS AND LOCK ABOVE 3678 WILL OPEN THE FOLLOWING BULLISH TARGET
3702
EMA5 CROSS AND LOCK ABOVE 3702 WILL OPEN THE FOLLOWING BULLISH TARGET
3727
EMA5 CROSS AND LOCK ABOVE 3727 WILL OPEN THE FOLLOWING BULLISH TARGET
3747
EMA5 CROSS AND LOCK ABOVE 3747 WILL OPEN THE FOLLOWING BULLISH TARGET
3768
BEARISH TARGETS
3622
EMA5 CROSS AND LOCK BELOW 3622 WILL OPEN THE FOLLOWING BEARISH TARGET
3585
EMA5 CROSS AND LOCK BELOW 3585 WILL OPEN THE SWING RANGE
3556
3528
As always, we will keep you all updated with regular updates throughout the week and how we manage the active ideas and setups. Thank you all for your likes, comments and follows, we really appreciate it!
Mr Gold
GoldViewFX

GOLD 4H CHART ROUTE MAP UPDATE & TRADING PLAN FOR THE WEEKHey Everyone,
Please see our updated 4h chart levels and targets for the coming week.
We are seeing price play between two weighted levels with a gap above at 3655 and a gap below at 3615. We will need to see ema5 cross and lock on either weighted level to determine the next range.
We will see levels tested side by side until one of the weighted levels break and lock to confirm direction for the next range.
We will keep the above in mind when taking buys from dips. Our updated levels and weighted levels will allow us to track the movement down and then catch bounces up.
We will continue to buy dips using our support levels taking 20 to 40 pips. As stated before each of our level structures give 20 to 40 pip bounces, which is enough for a nice entry and exit. If you back test the levels we shared every week for the past 24 months, you can see how effectively they were used to trade with or against short/mid term swings and trends.
The swing range give bigger bounces then our weighted levels that's the difference between weighted levels and swing ranges.
BULLISH TARGET
3655
EMA5 CROSS AND LOCK ABOVE 3655 WILL OPEN THE FOLLOWING BULLISH TARGETS
3696
EMA5 CROSS AND LOCK ABOVE 3696 WILL OPEN THE FOLLOWING BULLISH TARGET
3738
BEARISH TARGETS
3615
EMA5 CROSS AND LOCK BELOW 3615 WILL OPEN THE FOLLOWING BEARISH TARGET
3583
EMA5 CROSS AND LOCK BELOW 3583 WILL OPEN THE FOLLOWING BEARISH TARGET
3545
EMA5 CROSS AND LOCK BELOW 3545 WILL OPEN THE FOLLOWING BEARISH TARGET
3509
EMA5 CROSS AND LOCK BELOW 3509 WILL OPEN THE SWING RANGE
3458
3409
EMA5 CROSS AND LOCK BELOW 3409 WILL OPEN THE SECONDARY SWING RANGE
3360
3320
As always, we will keep you all updated with regular updates throughout the week and how we manage the active ideas and setups. Thank you all for your likes, comments and follows, we really appreciate it!
Mr Gold
GoldViewFX

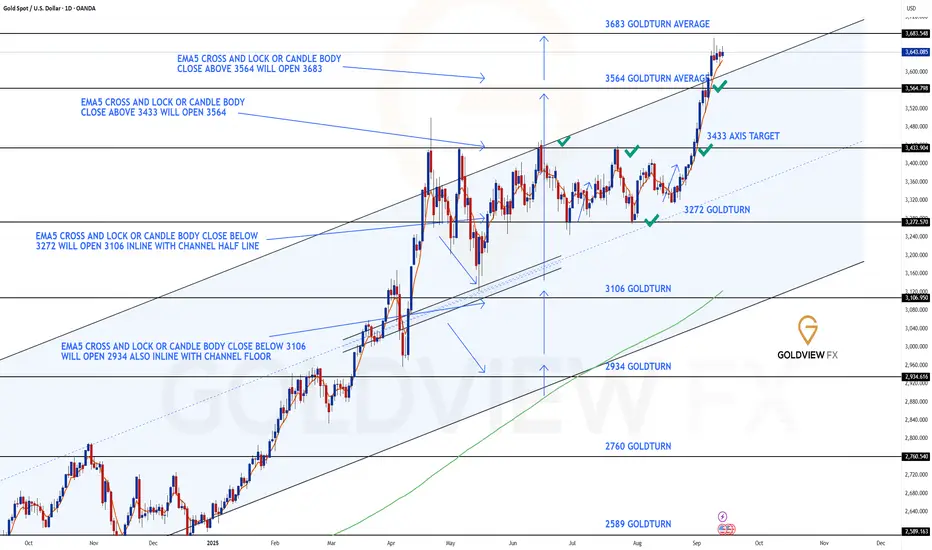
GOLD DAILY CHART ROUTE MAPDaily Chart Update
3564 Target Hit, Fresh Gap at 3683 & Breakout Confirmation
As projected in our previous update, the 3564 target has now been reached perfectly following EMA5 lock confirmation above 3433. This milestone completes the initial breakout structure and validates the bullish momentum sequence laid out earlier.
With 3564 achieved, price action has now opened a long-range gap toward 3683. The EMA5 cross and lock above 3564 provides strong continuation evidence, but we must now monitor whether support can be sustained above the channel top. A successful hold here will confirm continuation higher; however, a break back within the channel would classify this as a fake breakout attempt.
Current Outlook
🔹 3564 Target Reached
Upside momentum played out as expected, with EMA5 lock above 3433 providing early confirmation. The move delivered a clean hit of the 3564 target zone.
🔹 Next Objective – 3683
Momentum now extends toward 3683, with EMA5 lock above 3564 giving weight to this projection. Sustaining price above the channel top remains crucial to validating the next leg higher.
🔹 Breakout Validation Needed
Continuation depends on maintaining support above channel resistance. Failure to hold here risks invalidating the breakout and shifting price back into the prior range.
Updated Key Levels
📉 Support – 3272 (pivotal floor)
📉 Short-Term Supports – 3433 & 3564
📈 Resistance / Next Upside Objective – 3683
Thanks as always for your continued support,
Mr Gold
GoldViewFX