XAU/USD Bullish trend analysis Read The captionSMC Trading point update
Technical analysis of XAU/USD Bullish Channel Setup (4H Timeframe)
---
Chart Summary:
Pair: Gold Spot (XAU/USD)
Timeframe: 4H
Exchange: OANDA
Current Price: $3,759.85
EMA 50: $3,718.68 (short-term support)
EMA 200: $3,576.42 (major support)
---
Key Elements in Chart:
1. Ascending Channel Formation
Price is moving inside a clear rising channel (higher highs & higher lows).
Upper and lower boundaries are acting as dynamic resistance & support.
2. Support Levels (Yellow Zones)
$3,720–3,740 zone: strong support with EMA 50 confluence.
$3,600–3,620 zone: deeper support, aligned with EMA 200.
3. Breakout & Retest
Price broke a short-term descending trendline, signaling bullish continuation.
Retest of support level confirms buyers are active.
4. Bullish Projection
Based on measured move (previous impulse), projection suggests a rally towards $3,877.07 (target point).
Mr SMC Trading point
---
Conclusion:
The chart signals a bullish continuation inside the ascending channel.
Bullish Scenario: Holding above the $3,720–3,740 support zone, price is expected to rally toward the $3,877 target.
Invalidation: A 4H close below $3,718 (EMA 50) could open a deeper correction toward the $3,600 support (EMA 200).
---
Pelas support boost 🚀 this analysis
Goldprediction

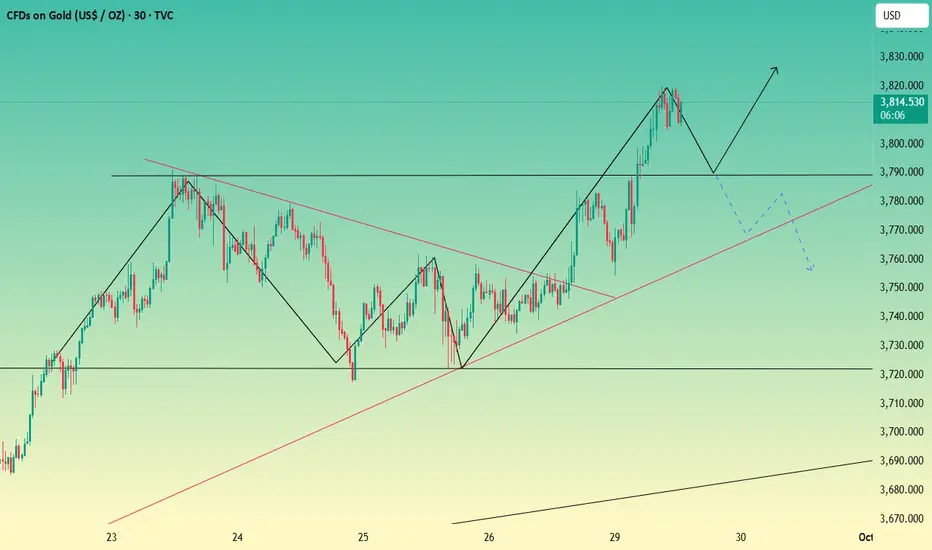
Gold Buy Setup – Buy the Dip Towards 3868 Target1. Trend:
Price is in a clear uptrend within a rising channel (highlighted in pink).
Currently, price is at the upper boundary of the channel, showing a potential short-term pullback before continuing higher.
2. Key Levels:
Entry Point: Around 3,766 – 3,765 (blue zone).
Stop Loss: Around 3,748 (below the channel support).
Target Point: 3,868 (top blue line).
3. Chart Pattern:
Price has formed a bullish flag/channel.
The projected move suggests a pullback to support (blue entry zone), then a bounce to the target area.
4. Risk-to-Reward Ratio:
Risk: ~18 points (from 3,766 entry to 3,748 stop loss).
Reward: ~100 points (from 3,766 entry to 3,868 target).
R:R ≈ 1:5.5, which is very favorable.
---
Trading Idea
Bias: Bullish (Buy setup)
Plan:
Wait for price to drop near 3,765 entry zone.
Place stop loss just below support at 3,748.
Target the upper zone around 3,868.
---
Summary
This chart shows a buy-the-dip strategy within an uptrend.
The plan is to enter near the channel support, with a tight stop loss, aiming for a continuation of the bullish move toward the target.
✅ Strong R:R setup
✅ Trend-following trade
⚠ Risk: If price breaks below 3,748, trend may reverse or consolidate deeper.

Gold surges strongly. Bullish trend continues?The current market trend is very clear: any price pullback is a buying opportunity. Quaid advises against speculating on the top and shorting the market. The overall trend shows extremely strong bullish momentum, with continuous price increases and a vertical upward movement in the moving average system, indicating strong upward momentum and no signs of a top reversal.
The key historical support level of 3800 has become a solid foundation. The first resistance level is 3835, and the second is 3850. Quaid believes that investors should patiently wait for a pullback before continuing to buy.
It's important to note that while the uptrend is strong, strict stop-loss orders must be used for every trade to avoid large price corrections. The current trend is volatile, and once the market changes, it is easy to cause a large correction. While being bullish, one needs to be cautious.
Trading Strategy:
Buy on dips around 3810; stop loss at 3800; target profit range 3835-3850.

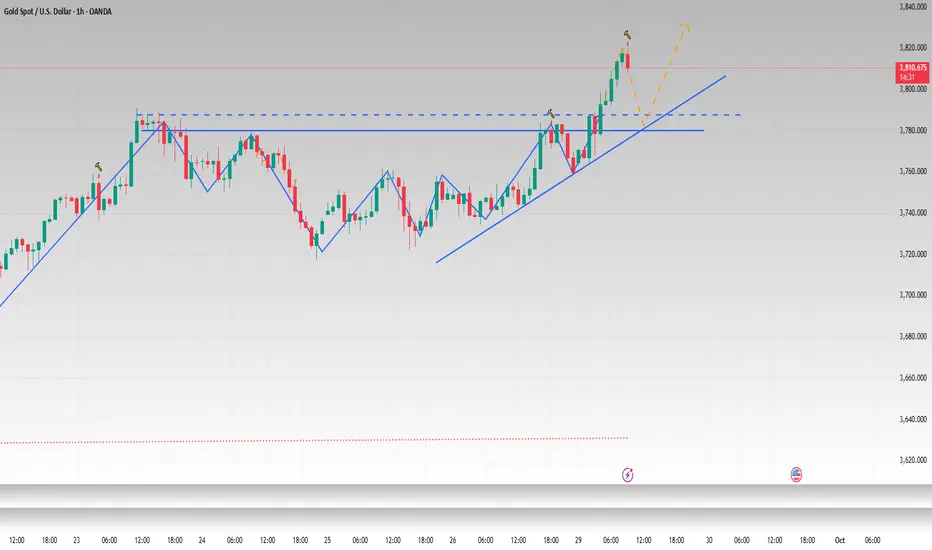
9.29 Gold price hits a new highOn the hourly chart, gold successfully broke through the $3,700 mark last week and continued its strong performance by breaking through $3,800 on Monday. For support, the $3,800 mark is a key level. Gold prices surged higher this morning, and after a breakout, prices continued to rise. For upward pressure, the intraday high, also a historical high, at $3,819 is also near the upper limit of the daily Bollinger Band. If gold prices stabilize at $3,800 and reach new all-time highs, the upward trend is expected, with no predictions of a top. The 5-day moving average and the MACD indicator are forming a golden cross, while the KDJ and RSI indicators are forming a golden cross in overbought territory. Short-term technical indicators suggest that bulls maintain their advantage.

Expectations of a Fed rate cut + risk of a government shutdown?
News:
US PCE data maintains expectations of rate cuts, gold prices supported
The US Congress failed to pass a funding bill before the end of the fiscal year on Tuesday, prompting a partial government shutdown starting on Wednesday. This risk could delay the release of Friday's non-farm payroll report, affecting market sentiment regarding the economy and expectations for Federal Reserve policy.
Specifically:
Concerns about a US government shutdown have fueled a continued influx of safe-haven funds into the gold market. After stabilizing in the 3760 area early in the session, the price surged sharply, reaching a new all-time high and currently hovering around $3810.
From a market perspective, gold bulls remain strong. This morning's low of 3760 has become key support for bulls. As long as this area remains below, the market remains bullish; any unexpected break below this level would only be a temporary correction.
Strategy:
Long Position3790-3800,SL:3780,Target:3820-3835

Bulls Charge Ahead—Gold’s Path to 3835–3845Brothers, it seems that we were too conservative in setting the TP. Now gold has broken through 3810, far exceeding the TP: 3785 set in our last long transaction.
Because a large amount of safe-haven buying funds poured into the gold market, it continued to set new historical highs, stimulating gold to break through 3800 and continue its rise to above 3810, fully highlighting the strong bullish sentiment in the market. At present, with the support of fundamental factors that are bullish for gold, it is difficult for the gold market to reverse in a short period of time. At best, it is just a short-term adjustment.
In addition, we can look for wave patterns from the candlestick chart. From the previous trend, it is not difficult to see that after a short-term consolidation, gold will pull up and retrace to form a secondary low point, and then it will wave again to $75-80 to reach a new high. Then according to this rule, after the volatile rise, gold formed a secondary low near 3760 on Friday. If we look up to the fluctuation range of $75-80, gold is likely to continue to rise to the 3835-3845 area.
So, for current short-term trading. First of all, we still consider going long on gold.
1. If gold first retreats to the 3800-3790 area, we can prioritize going long on gold.
2. If gold continues its upward trend and first reaches the 3835-3845 area, we can consider going short on gold.

Gold breaks through 3800, should we go short or long?Looking back at the current upward cycle of international gold, the price started from a low of 3313 and has been steadily rising all the way relying on the bull trend. As of now, the cumulative increase has exceeded 500 US dollars. This increase is basically the same as the 500 US dollar band increase caused by changes in tariff policies. From the historical trend, after a similar increase, the market tends to enter the "momentum rebalancing" stage, especially when the price breaks through the key mark of 3810 US dollars, it will officially enter the short-term risk area. The riskiness of this zone stems primarily from the substantial profits accumulated from long positions initiated at $3,313. Some investors are taking profits at high levels, leading to a temporary increase in selling pressure. Based on historical gold fluctuations, after such surges exceeding $500, a typical technical correction typically begins at $100. The core function of this correction is to "digest profit-taking and repair overbought indicators" to accumulate momentum for the subsequent "second bull run", which is a necessary link in the trend continuation process.
Today, I'm considering shorting gold in the 3813-3818 resistance range, with the initial retracement target at 3800-3780.
Due to the rapid market fluctuations, please stay tuned to my channel for detailed trading tips, including execution details for both long and short-term trades. If you'd like, please share your current positions so we can analyze whether it's safer to hold on or adjust and change positions promptly.
Gold at Key Decision Zone: Breakout or Breakdown?Hello guys!
Let's analyze Gold!
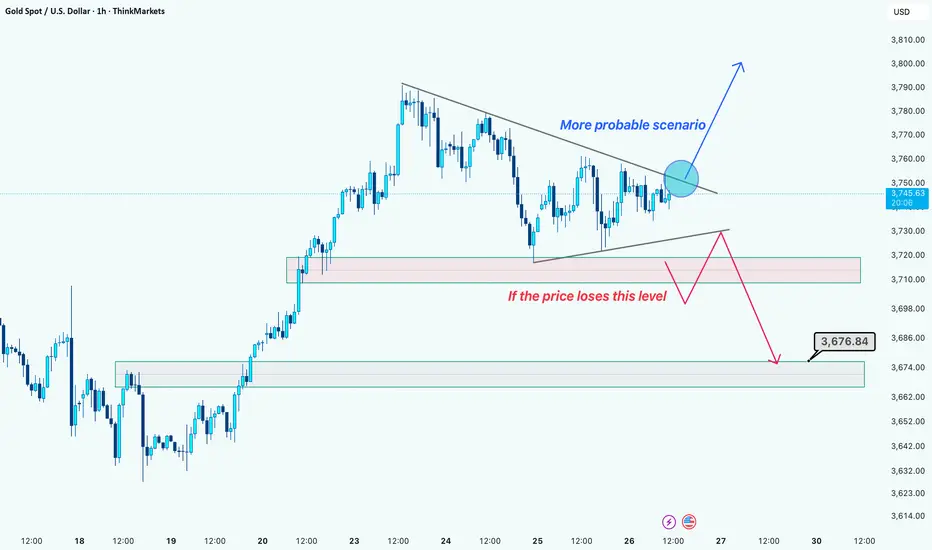
🔸 Current Market Structure
Price is consolidating inside a symmetrical triangle after a strong bullish run.
Momentum remains positive, but sellers are defending the upper trendline.
Key short-term support is around 3,720 – 3,710 zone.
🔺 Bullish Scenario (More Probable)
If price breaks above the triangle resistance, we could see continuation toward 3,770 – 3,790 levels.
Structure favors buyers as long as price holds above 3,720.
🔻 Bearish Scenario (Alternative)
If the price loses the 3,710 support zone, sellers may take control.
Downside targets:
First support: 3,690 – 3,680 zone
Key target: 3,676 area
🔹 Conclusion
More probable scenario: A bullish breakout continuation.
Risk to watch: If the support fails, the price could quickly revisit 3,676.
Best approach: Wait for a confirmed breakout before entering.
Disclaimer: As part of ThinkMarkets’ Influencer Program, I am sponsored to share and publish their charts in my analysis.

5 Mistakes Even Veteran Traders Make!Whether you're new or experienced, you can still fall into these 5 DEADLY mistakes. I'm here to point them out!
Mistake #1: Not understanding what you’re trading.
You’re trading forex, right? But do you know what pips or lots are? How currency pairs move? Or how news impacts them? Too many people dive in just because they see others profiting, without knowing what they’re betting on. That’s the difference between investing and gambling.
Don’t jump into the ocean without knowing what’s underwater.
Mistake #2: Not managing your money.
Most traders obsess over making money but forget how to protect it. It’s human nature—everyone wants fast cash! But if you trade big without control, one bad move can wipe out a month or even a year’s gains. Remember, keeping your capital safe is priority number one; profits come as a result.
As long as you’ve got the forest, you won’t run out of firewood.
Mistake #3: No clear trading plan.
Are you entering trades based on feelings? Exiting because of a “hunch”? That’s not trading—it’s playing the lottery! A trading plan is your compass, your map to stay on track. It needs clear entry points, stop-loss levels, and profit targets. Most importantly, you MUST stick to it!
Sticking to strategy doesn't make us invincible, but it can help us retreat safely.
Mistake #4: FOMO – Fear of Missing Out!
You see prices soaring and chase them, or you copy someone’s trade because they’re showing off profits. Then, when you lose, you blame the market or some “expert,” forgetting it was YOUR choice to trade. Drop this habit! Stop following the crowd and own your trading decisions.
You can’t live by envying someone else’s wallet.
Mistake #5: Trading addiction and chasing short-term wins.
Win one trade, and you want more. Lose one, and you want to “get even” with the market. This traps you in a cycle of overtrading and rash decisions. Profits don’t come from trading a lot—they come from trading RIGHT.
Don’t let emotions take over. Remember, When emotions rise, logic falls.
These 5 mistakes can burn all your money, no matter how much you have. Be honest with yourself and learn from them. I believe if you avoid these traps and stay disciplined, the door to success will open wide.
I’m Anfibo, just sharing what I know about finance.

GOLD HIGH PROBABILITY SETUP SOON!!!🚨 XAUUSD HIGH PROBABILITY SELL SETUP 🚨
* Here We Can See Clearly The Next Potential Move For GOLD Coming Hours/Days.
* Keep Your Eyes Close On Your Trading Positions.
* Happy PIP Hunting Traders.
FXKILLA.

3780-3790: A potential price reversal point; buy on dips.On Friday night, we expect gold to hit a new high of 3800-3810 after holding the key support of 3765-3755. At present, gold has broken through the expected target and is expected to move towards 3830.
The current geopolitical situation has worsened, and the new round of tariffs that came into effect on October 1st has continuously stimulated the market's risk aversion sentiment, causing investors to flock to the gold market to seek risk shelter. Today's news needs to focus on the U.S. trading session. Members of the U.S. Congress from both parties are negotiating on avoiding a government shutdown. The U.S. government faces the risk of shutdown. If it is not effectively resolved, this will affect the subsequent release of key data such as NFP CPI.
With the rising gold price, it has broken through previous resistance and reached a new high. The previous high of 3780-3790 has become a key level for a potential trend reversal. During the European session, if gold retraces to this range, we can consider buying gold with a target of 3820-3830.
Buying momentum continues. Has the top been reached yet?Witnessing history once again, gold hit a new all-time high during the Asian trading session, surging by nearly $48.
Why did gold surge again at the start of this week?
1. Growing concerns about a US government shutdown prompted investors to seek safety in traditional store-of-value assets, thus weakening demand for the US dollar and driving gold higher.
2. Ongoing geopolitical tensions, including UN sanctions against Iran, and other risk-averse factors, will continue to benefit gold.
After gold broke through a new high, the previous high of 3790 has now become a potential support level. For buyers, they need to see the price close above the psychological level of 3800 to provide additional support for the record-breaking rally. In the short term, expect some price retracement.
Quaid believes that if the price remains above 3800 during the European session, the next target could be 3850. A decisive break above 3850 could push gold further to around 3880.
Trading Strategy:
Buy around 3790, with a stop loss at 3780, and target profit between 3835 and 3850.
If the price remains above 3800 during the European session without any retracement, consider a small long position at 3800.

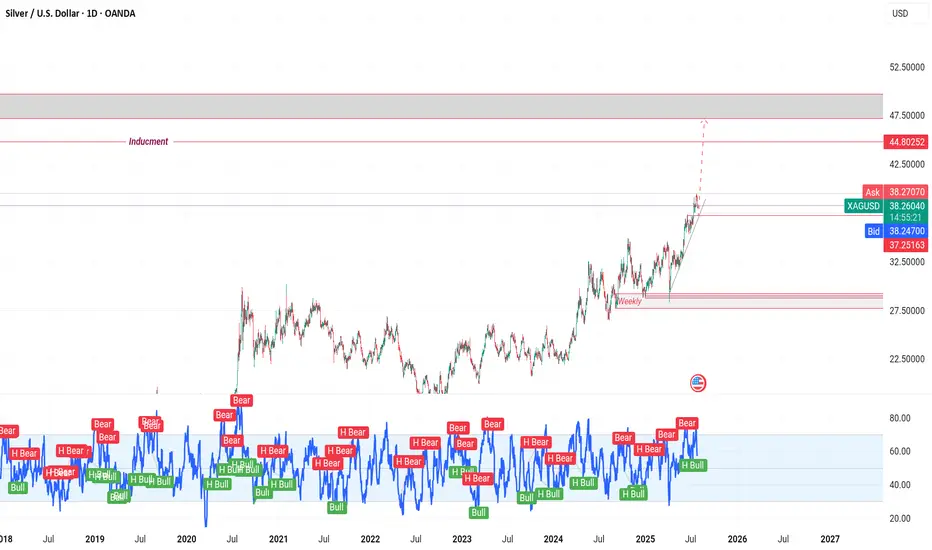
XAG/USD on high time frame
"Hello, for investors in XAG/USD, the $37 zone appears to be a low-risk area for buying. Both technical and fundamental analyses suggest that the price is likely to move higher towards $48."
If you require further insights or have additional information to discuss, feel free to share!
XAUUSD on swing upside XAUUSD is still intact on bullish trend towards 3930!!
In our previous commantary we are expecting 3830 with the next session.
My stance on XAUUSD?
I'm expecting bit retracement for again pump.
-First point of buying will be 3785-3795 area , just H4 candle should closes above it , my target will be 3830 then 3845. Although i took buy at 3800 and holding.
- Secondly if H4 candle closes below 3780 then our buying will be compromised.
Additional TIP: Buy the dips

Gold Bulls Eyeing $3,800+ – Key Buy Areas RevealedGold is currently holding inside a rising channel structure after making an ATH near $3,790. The market has pulled back from the high and is consolidating around key trendline support. The immediate buy area lies near $3,730–$3,740, which also aligns with the trendline support. A deeper dip towards $3,710–$3,715 could offer a stronger buy trigger zone if price retests.
On the upside, gold will likely revisit the $3,790 ATH, and a sustained move above this level may extend towards $3,800–$3,820 in the coming sessions. Overall, the market bias remains bullish as long as price holds above the $3,710–$3,692 support region, with consolidations and pullbacks seen as part of the broader upward trend.
🔑 Key Levels to Watch:
- Resistance: $3,760–$3,765
- Support: Immediate support $3,730 and strong support $3,710–$3,715
📌 Buy Zone & Buy Trigger:
- Buy Zone: $3,720–$3,730
- Buy Trigger: The buy trigger area is $3,760–$3,765, where a breakout above the descending resistance from the ATH would indicate renewed bullish momentum.
Note
Please risk management in trading is a Key so use your money accordingly. If you like the idea then please like and boost. Thank you and Good Luck!

Gold price analysis September 29The market recorded strong buying pressure at the beginning of the week when the price was supported from the support zone of 3757. The bullish momentum is taking the price to new highs, and there is currently no notable resistance zone. The Fibonacci area around 3834 becomes the nearest target. In the short term, if there are corrections during the day or during the week, it will still be a potential opportunity to increase buying positions, especially when the market is looking forward to the Nonfarm data at the end of the week.
Trading plan:
BUY when there is a price rejection signal at the support zones of 3707 – 3730 – 3757
Expected target: 3830

International dynamics shift. Gold prices rise.Information Summary:
The United Nations imposed a new round of tough sanctions on Iran, directly impacting its economy and nuclear program, triggering a sharp escalation in regional tensions. Iran's assertive stance and refusal to compromise have fueled market concerns about escalating conflict. The rapid decline in gold prices was followed by a strong pullback, which fully confirmed the strong bullish sentiment in the market. It is expected that this geopolitical driver will continue to provide strong upward momentum for gold prices.
Market Analysis:
From a technical perspective, gold closed with a solid bullish candlestick on the daily chart, forming a classic bullish bottoming-out pattern and fully reversing earlier losses. The current gold price has firmly stood above all major moving averages, especially near the 3755 line, which has transformed from resistance to strong support. Influenced by the international situation, bullish momentum is strong in the market.
Quaid recommends going long in line with the market, targeting the 3800 integer mark, and continuing to hold positions after breaking through.

𝐌𝐓𝐗 | Pitstop Zone to Continue the 1,300 Pip Potential Rally1️⃣ Key Levels
• 729 – 737 → Major golden support zone.
• 759 – 760 → Key resistance / breakout trigger.
• 691 – 683 → Strongest potential buy zone of the week.
⸻
2️⃣ Expected Scenarios
• Bearish:
• 4H close below 759 → retest of the 729–737 support zone.
• 4H close below 729 → extension toward 709 → 700 → 691.
• Zone 691–683 is the most important potential reversal area this week, with multiple confluences, possibly triggering a strong rally toward the 3800 high again.
• Bullish:
• 4H close above 760 → continuation toward 780 → 791.
• 4H close above 792 → further bullish momentum targeting 808 → 817 → 830.
⸻
⚖️ Summary
The market is positioned between critical zones:
• Holding above 759–760 confirms strength toward 830.
• Breaking below 729 increases the probability of testing the 691–683 demand zone, which could be the week’s strongest reversal setup.

The opportunity for gold short position at 3780-3790 is hereThe gold market saw a slight rebound after opening today, indicating that bulls and bears are still in a game in the short term. Although prices have rebounded, the overall trend has not yet broken away from the previously formed range of fluctuations, indicating that market sentiment is relatively cautious. From a technical perspective, gold prices have recently attempted to rise many times but have failed to effectively break through the key resistance area, indicating that the selling pressure from above is still relatively obvious. Combining last week's trading performance, prices repeatedly encountered resistance and retreated within the 3775-3785 range, forming a relatively clear technical resistance zone and providing a valuable trading reference.
In this context, today's trading strategy can continue last week's overall thinking and maintain a judgment framework based on range fluctuations. If the gold price rebounds to the 3780 to 3790 area during the session and then shows signs of pressure again, such as a long upper shadow or insufficient trading volume, investors may consider establishing short positions in batches within this range and set reasonable stop-loss levels to control risks. At the same time, it is important to closely monitor the market's reaction to key economic data or macroeconomic policy developments, particularly changes in the US dollar index and US Treasury yields, as these factors will directly influence gold's short-term trend.
Furthermore, the market is currently at a critical stage of selecting a corrective direction. If prices effectively break through previous highs and stabilize above the range, this could trigger a surge in technical buying, necessitating timely adjustments to holding strategies. Conversely, if prices fall below the lower limit of the range, the downward trend could accelerate. Therefore, before a clear breakthrough signal appears, it is recommended to wait and see or adopt a high-selling and low-buying approach to avoid blindly chasing highs and selling lows. Overall, a cautious approach is recommended at this stage, combining technical indicators with market dynamics to respond flexibly and enhance trading discipline and success rates.

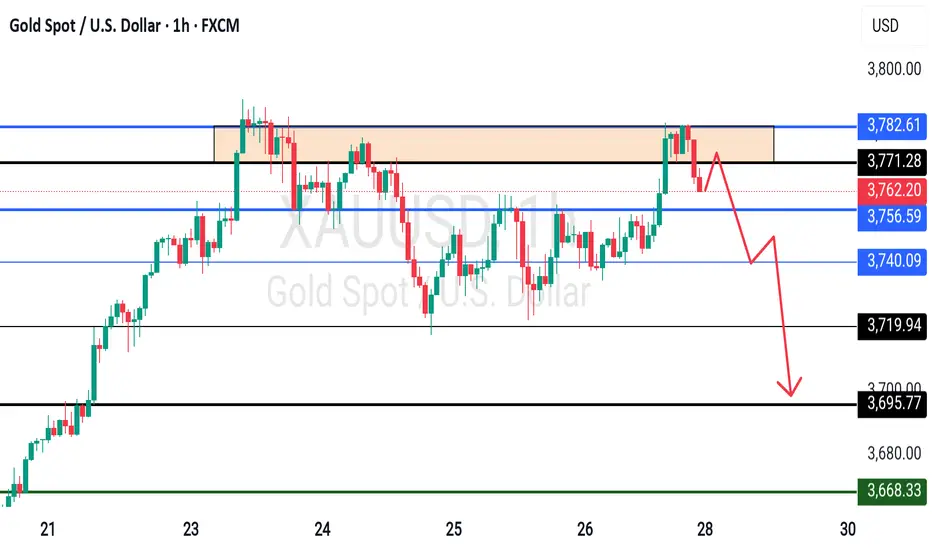
Double top expected, short at the beginning of the weekLast week, after a brief sideways consolidation following the opening, gold surged steadily and hit a new all-time high around 3,791. However, after a pullback correction on Wednesday, its upward momentum weakened relatively. During Friday’s U.S. trading session, gold rallied to around 3,783 before pulling back, closing near the 3,759 level.
Technically, the daily chart shows a single bearish candlestick for the pullback, while Friday formed a small bullish candlestick with an upper wick—once again standing above the moving average system. This suggests gold is relatively in the early stage of preparing for a second rally. The weekly chart also closed as a medium bullish candlestick, indicating the overall broad market sentiment remains bullish. Driven by a series of bullish patterns, gold may see a trend reversal (breakout) move next week. After all, the pullback from Friday’s U.S. session high could very well be a short-term "washout" by bears.
For gold to refresh its highs next week, Friday’s secondary high must be broken in a timely manner. Meanwhile, during pullbacks, the 3,770 level—now a top-bottom conversion zone—will act as a key short-term resistance. If gold opens under pressure below this level on Monday, it may break lower again later. On the 1-hour chart, if gold fails to extend its upward move, a "double top" pattern could form.
A series of major economic data releases are scheduled for next week. Gold will likely trade in a consolidation range early next week, given the lack of significant news triggers initially. Focus on the resistance at 3,790 first—we expect a pullback initially, with support to watch around the 3,720 zone. If Monday’s rebound lacks strength, prioritize short positions on rallies.
As market conditions change rapidly, please follow my channel for specific trading key points, including execution details for both long-term and short-term trades. If you are willing, feel free to share your current position status—we can analyze together whether it is safer to hold patiently or adjust and rebalance your positions in a timely manner.
Short Term Market Outlook XAU/USDWhat goes up must come down!
🎯15m chart analysis 🎯
As most experienced gold traders are already aware of its aggressive ranging behaviour many new retail gold traders fail to understand this causing them to get chewed up and spit out in this power house of a pair.
Having an edge against this aggressive range is the key to being able to trade gold successfully long term.
I have highlighted some important areas for you guys to keep an eye out for pull backs, look for rejections and candle closures above and below these zones. Overall market sentiment remains bullish so take sells with extra caution and lighten your positions up. I will keep you guys updated with further levels throughout the week, subscribe and turn notifications on 👁️👁️
Good luck to everybody, let’s make some money this week 💥

GOLD High placed? What's next??#GOLD.. market placed a very reasonable high so far and now going to break his supporting area.
Kep close upside region that can play major role in next move.
Don't be lazy here.
NOTE: we will go for cut n reverse above region not before that.
Good luck
Trade wisely