Bulls and Bears Poised to StrikeGold is currently fluctuating in a narrow range around 3635-3655, with no clear signs of a breakthrough. However, judging from the current structure, gold has been showing an overall volatile upward trend since it rebounded near 3615.
What needs to be paid close attention to at present is the support performance near 3635. If gold can stand firmly above 3635, it will perfectly maintain the volatile upward structure and provide the prerequisite for breaking through the short-term resistance area of 3655-3665. Once gold uses this as a basis and breaks through the 3655-3665 area, then gold is expected to set a new high again, and even hit the area near 3700.
Since the bulls are still in an advantageous position and the overall structure of the market is oscillating upward, we have no reason not to execute long trades based on the long structure. Therefore, I think that in short-term trading, we can consider going moderately long on gold in the 3640-3630 area.
Goldprediction

3655 accurately shorted gold to seize the opportunity of declineGold fluctuated higher today, rising from 3630 all the way to 3657. However, after encountering resistance at this level during the European session, it ultimately retreated. The overall trend remains consistent with our previous analysis and strategy. Today's strategy is to short on rebounds around 3655, watching for pullbacks. The current low has been around 3637, resulting in a small short-term gain of approximately 150 pips. Congratulations to those who followed this strategy for a solid win! For those who are short-term traders, it's recommended to lock in profits or lower your stop-loss to avoid profit taking. For those holding medium-term positions, manage your positions appropriately and patiently await the next wave of opportunities. Following the trend and executing your plan are the keys to stable profits in the market.

European session sees retracement, US session hits new highGood morning, everyone. Although gold has rebounded at present, it has not effectively broken through and stabilized above the short-term resistance of 3655-3660. In the short term, this resistance range still exerts a certain pressure on the gold price, but this does not mean that we give up the judgment that gold may reach a new high.
First of all, looking at the daily gold chart, we can find that yesterday's daily line closed with a negative line, but gold did not fall but rebounded and rose. This is not only the impact of data, but also shows that the buying funds in the current market are very strong. As I told you before, big changes in the market will only occur after the Fed's interest rate cut basis point is clear next week.
But at the same time, brothers need to be clear that we should be alert to the false break of gold. Therefore, we can give a floating space of about $5, relying on 3655-3665 to see the short-term suppression. It may fall back when encountering resistance here in the European session. You can try to short with a light position. The short-term support should focus on 3645-3635 below. If it falls back and the support is not broken, gold will continue to rise. In particular, be alert that gold in the US market may rebound to a new high based on the support level. If the European session directly returns to the lower support, we can go long on gold first.

Wait for new highs and go long on pullbacksA good day starts with profits, now let's analyze the trend of gold today.📊
Gold is currently consolidating around 3650, with 3655-3665 forming short-term resistance above. The 4H MACD indicator is correcting a top divergence. Having first touched this resistance level in the European session, gold may experience a pullback. 📉As the price of gold continues to rise, the short-term support also moves up. Pay attention to the short-term support area formed by 3640-3630. 🌈If gold retraces support and then rebounds above this resistance level, it could first reach 3675, or even reach a new high of 3690-3700, as we anticipated yesterday.🚀
Intraday operations are mainly long at low levels, supplemented by short at high levels, and participate in trading in key ranges.
Gold (XAU): $3700 is the next key resistanceGold (XAU): $3700 is the next key resistance
Gold has continued its impressive rally, with $3,700 emerging as the next key resistance level.
The first breakout above the $3,400 psychological zone occurred in late April, followed by a period of consolidation and repeated tests of that level.
Last week, the asset gained strong momentum, breaking decisively above this zone and reaching a new all-time high (ATH) of around $3,500.
This week, the bullish trend has extended further, with XAU/USD approaching the next critical psychological barrier near $3,700.
The key question remains: How much further can ongoing global economic tensions drive gold’s upward movement?
Resistance Level: $3,700
Support Levels: $3,600 / $3,500
Key Zone to Watch: $3,400
📌 This analysis is for educational purposes only. Please exercise caution and trade responsibly.
If you found this helpful, like, follow me, subscribe, share and comment.

XAUUSD Gold Intraday Move 12.09.2025Intraday Analysis
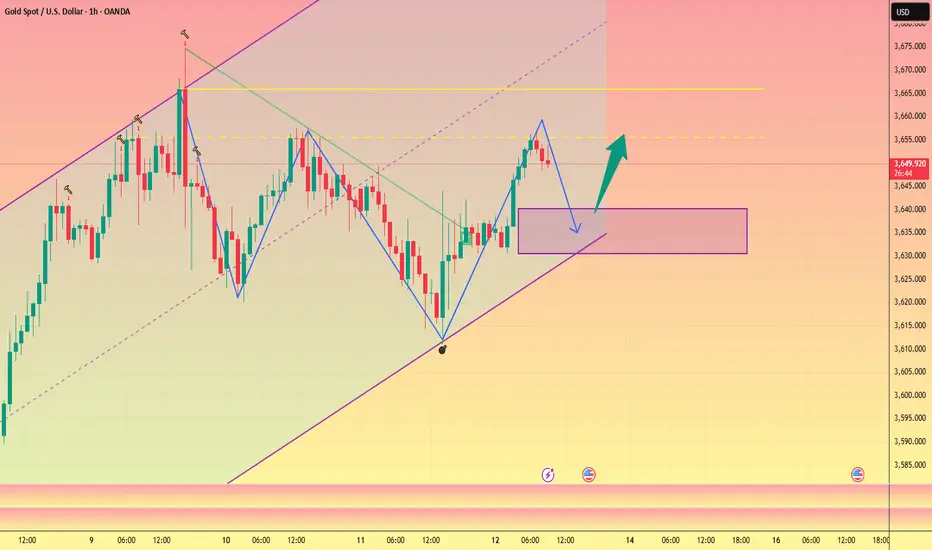
The market has recently broken out of a descending trendline, showing signs of bullish momentum. After the breakout, price retraced toward previous supply turned demand zones, creating potential buying opportunities at key levels.
Key Observations:
Trendline Breakout:
The downward trendline has been broken, indicating a possible shift in momentum from bearish to bullish. Retests of the broken structure often provide high-probability entries.
Demand Zones:
Zone 1 (3630–3633): This level aligns with a prior consolidation area and trendline retest. A bounce here could trigger continuation toward higher resistance.
Zone 2 (3612–3616): This is a deeper support zone and serves as a secondary buying opportunity if the first level fails.
Targets and Risk Management:
For Zone 1, the upside target is 3657 with a protective stop below 3622.
For Zone 2, the upside target is 3640 with a stop below 3606.
Both setups provide a favorable risk-to-reward ratio.
Confirmation Requirement:
Entries should only be considered once at least two confirmations are present. Possible confirmations include:
Bullish candlestick patterns (engulfing, pin bar, or strong rejection wicks).
Break of minor intraday structure to the upside.
Volume spike or momentum divergence supporting the bullish bias.
Conclusion:
The bias remains bullish while above 3612. The first area of interest is 3630–3633 for a potential long entry toward 3657. If price dips deeper, the 3612–3616 zone provides the next opportunity for a bounce targeting 3640. Proper confirmation is essential before committing to trades, and stops should be respected to manage risk effectively.

Gold Price Analysis September 12Gold continues to maintain a strong upward momentum in recent sessions and has not yet shown clear signs of a significant correction. Today's strategy still prioritizes looking for buying opportunities, especially in breakout areas - where buyers' money is waiting to push prices to the historical peak (ATH).
In the Tokyo session, the price broke the downtrend line on the H1 frame and completed the DOW pattern, opening up new upward momentum with a target of 3690.
📌 Important observation area:
Key Level 3340: If the price closes below this area, selling pressure will return and the market may enter short-term corrections.
📈 Trading strategy:
BUY at the newly formed DOW area
BUY when the price rejects support at 3640
BUY DCA when breaking resistance at 3660
🎯 Target: 3690

Will gold still rise?Gold has staged a rebound after testing the lows and is currently trading around the 3,638 level. As noted in this morning’s update, the short-term pullback is a result of profit-taking following the sharp rally—a relatively healthy price movement. As long as the $3,600 level holds, the market will remain in a bullish trend. However, it is now in a phase of long-short tug-of-war at high levels, especially since a correction is needed on the daily timeframe. The market is likely to swing up and down over the next couple of days as we await news on the Federal Reserve’s interest rate cut next week.
If you’ve been struggling with your current positions or have seen underwhelming trading performance lately, it may be time to reevaluate your strategy and risk management settings. Feel free to reach out for discussions and exchanges.

GOLD ROUTE MAP UPDATEHey Everyone,
This is the 1H chart route map we tracked this week - played out beautifully to completion.
After hitting 3658, we saw no further EMA5 cross and lock, which led to the rejection. As expected, the lower Goldturns acted as support, giving us the planned dip-buying opportunities.
First, 3638 held as support with multiple bounces.
Then we got a cross-and-lock break below 3638, which opened 3613.
That target was hit and provided a support bounce back into 3638 today.
Right now, price action is playing between 3613 and 3638. An EMA5 cross and lock at either level will determine the next range.
We will keep the above in mind when taking buys from dips. Our updated levels and weighted levels will allow us to track the movement down and then catch bounces up.
We will continue to buy dips using our support levels taking 20 to 40 pips. As stated before each of our level structures give 20 to 40 pip bounces, which is enough for a nice entry and exit. If you back test the levels we shared every week for the past 24 months, you can see how effectively they were used to trade with or against short/mid term swings and trends.
As always, we will keep you all updated with regular updates throughout the week and how we manage the active ideas and setups. Thank you all for your likes, comments and follows, we really appreciate it!
Mr Gold
GoldViewFX

Gold 1H – Demand Sweep Before Premium ExpansionGold on the 1H timeframe is consolidating near 3,644 after multiple ChoCHs, showing engineered liquidity grabs. Price has defined clear demand footprints at 3,620 and deeper at 3,593, while premium supply is stacked near 3,673–3,680. This structure suggests a possible retracement into discount zones before expansion toward premium liquidity.
________________________________________
📌 Key Structure & Liquidity Zones (1H):
• 🔼 Buy Zone 3,620 – 3,618 (SL 3,613): Fresh demand block aligned with bullish order flow.
• 🔼 Buy Zone 3,593 – 3,591 (SL 3,596): Deeper liquidity sweep, high R:R demand area.
• 🔽 Sell Zone 3,673 – 3,671 (SL 3,680): Premium supply pocket for short-term liquidity grabs.
________________________________________
📊 Trading Ideas (Scenario-Based):
🔺 Buy Setup – Shallow Demand Reaction
• Entry: 3,620 – 3,618
• Stop Loss: 3,613
• Take Profits:
TP1: 3,635
TP2: 3,650
TP3: 3,665+
👉 Expect a bounce from shallow demand before retesting premium zones.
🔺 Buy Setup – Deeper Liquidity Sweep
• Entry: 3,593 – 3,591
• Stop Loss: 3,596
• Take Profits:
TP1: 3,610
TP2: 3,625
TP3: 3,645+
👉 Ideal entry for swing traders seeking higher R:R after liquidity engineering.
🔻 Sell Setup – Premium Rejection
• Entry: 3,673 – 3,671
• Stop Loss: 3,680
• Take Profits:
TP1: 3,660
TP2: 3,650
TP3: 3,635
👉 Scalp opportunity at premium supply; bias remains bullish so manage risk tightly.
________________________________________
🔑 Strategy Note
Bias remains bullish, but smart money may engineer a dip into 3,620 or deeper 3,593 demand before expansion. Cleaner setups favor buying dips; shorts from 3,673 are counter-trend scalp plays only.

Focus on CPI, 3640, 3620 long and short key pointsThe market focuses on CPI data, and in the short term 3640-3660 becomes the dividing line between bulls and bears for gold.
From the news perspective, due to the sharp decline in employment rate, the employment and economic environment in the United States have been affected, and a September interest rate cut is almost a foregone conclusion, which has prompted the recent continuous rise in gold prices. Whether the interim high of 3675 means that gold has peaked remains to be seen.
From a technical perspective, gold rebounded yesterday to correct Tuesday's decline, reaching a high of around 3657 before continuing its technically bearish downward trend and retreating to around 3640. Today, gold's overall volatility in the Asian and European sessions was limited, with 3640-3660 forming a short-term upper pressure, also becoming the dividing line between bulls and bears.
If the CPI data is bullish for gold, the first thing gold needs to do is to break through the short-term pressure of 3640-3660. Once it breaks through strongly and stabilizes above 3660, gold will continue to rise and is expected to set a new high of 690-3700.
On the contrary, if the CPI unexpectedly falls short, gold will only rebound tentatively but will be unable to break through the short-term suppression of 3640-3660, then the bears will officially counterattack and the market will briefly bid farewell to the bulls. A break below 3600 would target the key support level of 3580.
In summary, focus on the 3640-3660 resistance level and the 3620-3610 support level. If the European session sees a pullback to support without a break, a small, light position can be considered, For cautious traders, it's advisable to set the stop-loss order with a buffer of $3-5, depending on their account size.with a potential profit target of $10-$30. More conservative traders can wait for the CPI data before entering a trade.
Gold 1H – CPI Liquidity Play Before ExpansionGold on the 1H timeframe is consolidating near 3,633 after multiple ChoCHs and engineered liquidity grabs. With CPI news today, price is expected to sweep both premium and discount liquidity zones. The structure suggests engineered spikes toward 3,688–3,691 or dips into 3,595–3,592 before expansion.
________________________________________
📌 Key Structure & Liquidity Zones (1H):
• 🔴 SELL ZONE 3,643 – 3,645 (SL 3,650): Premium supply pocket for short-term rejection.
• 🔴 SELL ZONE 3,688 – 3,691 (SL 3,696): Premium sweep zone targeting 3,680 → 3,670 → 3,660 → 3,650 with extended open target at 3,625.
• 🟢 BUY ZONE 3,595 – 3,592 (SL 3,587): Discount demand zone targeting 3,615 → 3,625 → 3,635 → 3,645 with extended open target at 3,685.
________________________________________
📊 Trading Ideas (Scenario-Based):
🔻 Sell Setup – Premium Rejection (Intraday)
• Entry: 3,643 – 3,645
• Stop Loss: 3,650
• Take Profits:
TP1: 3,630
TP2: 3,620
TP3: 3,600
👉 Scalp opportunity if CPI spikes price into this supply zone.
🔻 Sell Setup – CPI Premium Sweep
• Entry: 3,688 – 3,691
• Stop Loss: 3,696
• Take Profits:
TP1: 3,680
TP2: 3,670
TP3: 3,660
TP4: 3,650
Open: 3,625
👉 Expect engineered CPI move into premium liquidity before reversal.
🔺 Buy Setup – CPI Discount Sweep
• Entry: 3,595 – 3,592
• Stop Loss: 3,587
• Take Profits:
TP1: 3,615
TP2: 3,625
TP3: 3,635
TP4: 3,645
Open: 3,685
👉 Ideal entry if CPI drives gold into deep discount demand before expansion.
________________________________________
🔑 Strategy Note
CPI will dictate volatility and smart money may sweep liquidity both sides. Key bias favors:
• Scalp sells at 3,643–3,645
• Deeper swing sells at 3,688–3,691
• High R:R buys at 3,595–3,592
Risk management is essential — expect fake-outs before expansion.

GOLD at Support , holds or not??#GOLD.. market just reached at his current supporting region.
That is around 3612 to 3618
Keep close that region and if market hold it in that case we can expect again bounce from here.
NOTE: we will go for cut n reverse below 3612 on confirmation for further 20 points dip..
Good luck
Trade wisely

Focus on CPI, beware of unexpected surprisesThe market focuses on CPI data, which is unlikely to fluctuate significantly in the short term. Although it has fallen below the recent support of 3620, buying below is still strong, so don't chase the short position. From the news and other recent data, it can be seen that the weak US employment data has suppressed the economy, forcing the Federal Reserve to cut interest rates. The current market basically assumes that 25 basis points has become a reality, so the possibility of positive CPI data is relatively high.
If the CPI data is positive for gold, it will first test the resistance level of 3640-3660. If the data triggers a strong rally, gold could potentially reach new highs, aiming for 3690-3700.
However, the previous NFP data was also crucial, but the result was a surprise. Therefore, we cannot rule out the possibility of a similar surprise with the CPI data. If the CPI data is bearish for gold, it will first test 3600 below. Once it falls below 3600, it will go to 3580.
The above content is just an analysis of the possible trend of gold, which you can refer to. If the European session retreats again to 3620-3610 without breaking, you can try to go long with a light position, and the ideal target is 3640-3660. If it falls below 3600, SL will be adjusted in time.

Gold Trade Insight 📢 NFX Market Update – GOLD FX:XAUUSD
Today’s U.S. data brought a mixed picture:
Jobless Claims: Higher than forecast (263K vs. 235K), signaling labor market weakness.
Continuing Claims: Slightly improved at 1,939K (in line with forecast).
CPI Data (Aug): Both headline and core readings came in stronger than expected (YoY 2.9% vs. 2.7% prior, MoM 0.4% vs. 0.3% forecast).
This creates a market indecision zone: weak jobless data suggests slowing growth, while CPI strengthens the case for inflationary pressure and keeps Fed policy on the table.
Gold reacted first to the jobless claims spike, gaining support as risk sentiment shifted, but with CPI strong, the market is cautious on sustained upside.
⚖ Outlook: I expect volatility to remain elevated in the short term. Gold may push higher on knee-jerk reactions to jobless claims, but a possible turnaround is likely as inflation data keeps the Fed hawkish bias intact. Watching closely around key intraday levels for confirmation.

Gold Bulls in Full ControlHi everyone, it’s Ken here!
XAUUSD is maintaining a strong uptrend, and based on my observation, the market is likely to continue moving toward the channel top marked on the chart.
The current zone plays a crucial role. It could act as a support level that allows price to bounce higher. However, if this zone breaks, a deeper corrective move may start to unfold.
While I lean toward the bullish scenario, actual price action will ultimately determine the next direction. A decisive break below the trendline would invalidate the bullish outlook and open the risk of a pause or even a short-term reversal.
This is only my personal view based on chart analysis, not financial advice.
Wishing you success!

Gold is Ready For Bull After Forming a Strong SupportHello Traders
In This Chart GOLD HOURLY Forex Forecast By FOREX PLANET
today Gold analysis 👆
🟢This Chart includes_ (GOLD market update)
🟢What is The Next Opportunity on GOLD Market
🟢how to Enter to the Valid Entry With Assurance Profit
This CHART is For Trader's that Want to Improve Their Technical Analysis Skills and Their Trading By Understanding How To Analyze The Market Using Multiple Timeframes and Understanding The Bigger Picture on the Charts

Stay bullish, stick to the direction.Gold prices did not continue to rise but instead fluctuated at high levels. Such fluctuations do not mean a short-term peak; only a drop back below $3,600 would warrant considering short-term short positions. The high-level consolidation on the 1-hour chart has not broken down, and after such a substantial rally, a minor short-term pullback is perfectly normal—there's no need for excessive concern. What's more important is to grasp the overall trend; pullbacks are just opportunities to get on board at a better price.
The market is currently focused on next week's Federal Reserve interest rate decision, which will be the real game-changing news. Therefore, holding the $3,600 level is crucial. As long as this level remains unbroken, the bullish momentum will continue to stay strong.
I will closely track and analyze the market daily. If you're losing direction in this kind of market, feel free to follow me or leave me a message.

CPI GOLD MAPPING ! CPI GOLD BUY AND SELL AREAS
SELL 3644 , 3667 (OB)
BUY 3571 , 3555 (FVG + OB)
BUY 3517 , 3497 (TS + RBS)
Good Luck With Your Trading 🤞

Gold Trade Idea Thurs 11 Sep Gold is breaking out of the ascending channel and we expect a new ATH again.
The big move might be before, during or after tonight CPI and PPI data.
Gold 30 min chart
Enter: Buy/long 3645
stop loss: 3630
Target 1: 3675
Target 2 : 3700

The first sign of bearsthey are coming 🐻🐻🐻🐻🐻🐻
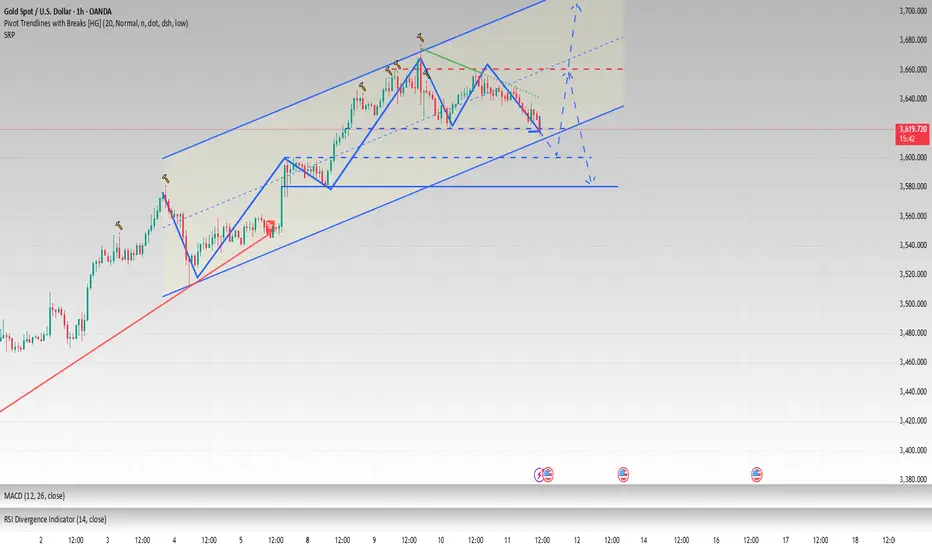
Gold has been on a remarkable bullish run over the past few weeks, setting multiple new highs. However, we are now seeing the first clear signs of seller presence entering the market.
This looks like a potential turning point. While I cannot predict the exact magnitude or speed of the decline, the probability of a reversal from this point appears to be high. I am anticipating a significant pullback.
Keep a close eye on key support levels. This could be the start of a new phase for gold.

GOLD READY FOR FALL ! Ready To Fall The Gold !
It’s Enough ATH We Are Going To Drop Soon 3500 / 3400
Gold Respect The Resistance A Strong Resistance Its Now We Are Expecting Gold Bearish Momentum

Pay attention to the low-buying opportunities above 3630.Gold ultimately broke through the trendline, breaking out of its current high near 3657. During the European trading session, it fluctuated upward between 3648 and 3640. Therefore, if the price doesn't retreat below 3630 before the European session, the probability of an upward breakout will increase in this volatile upward trend. Therefore, the European session's lowest retracement near 3640 is a key bullish target for a second leg higher.
Gold operation suggestion: go long around 3640-3630, target at 3660-3675.
