XAUUSD: Consolidating the bullish momentumHi everyone, it’s Ken!
At this moment, gold is shining with strong appeal. The market is moving within a steep channel, and price action continues to respect its structure, forming higher highs without showing weakness.
Not long ago, gold broke a key resistance level and might come back to retest it. Interestingly, this area also aligns with the “golden zone” from the last breakout. If buyers defend it well, the bullish outlook remains valid, with the next target aiming toward 3,660 – the channel’s peak.
As long as price stays above the support and the rising trendline, the uptrend remains intact. However, if it slips below, chances of a deeper pullback will rise.
Stay patient, wait for confirmation before entering, and always protect your capital with proper risk management.
Wishing you success!
Goldprediction

GOLD outlook* Sell 📉 - 3653.6 to 3655.6 ( SL 3657.5 - low risk )
* Buy 📈 - 3632 to 3628.6 ( SL 3627 )

Gold Outlook: Macro, Bonds, and Geopolitics Driving the Rally
1. Labor Market Weakness → Fed Pivot Risk
The latest NFP showed just 22K jobs vs. 75K expected, with unemployment climbing to 4.3%. Revisions were deeply negative (-258K), confirming labor market deterioration. Historically, recessions often follow once unemployment rises 0.5–1% from cycle lows — we’re already in that zone.
This means the Fed is boxed in: growth is slowing but inflation is still sticky.
Markets are pricing in a September Fed rate cut, weakening USD and boosting safe-haven demand for Gold.
2. Bonds & Yield Curve Dynamics
US Treasury Yields have started to retreat as bond traders price in Fed cuts. The 2-year yield, which tracks Fed expectations, is easing from highs, signaling policy loosening ahead.
A steeper yield curve could emerge if short-term yields fall faster than long-term, historically bullish for Gold as opportunity cost declines.
Real yields (inflation-adjusted) matter most for Gold. With core inflation at 3.1% and slowing growth, if nominal yields fall but inflation stays sticky, real yields compress lower → Gold rallies.
3. Inflation & Stagflation Risk
Inflation is at 3.1%, above the Fed’s 2% target, while growth is slowing.
This is classic stagflation risk: weak labor + sticky inflation = policy paralysis.
For Gold, stagflation is one of the strongest bullish regimes: fiat currencies lose real value, while safe-havens gain demand.
4. Geopolitical Tailwinds
Tariff pressures and trade disputes are pushing input costs higher. Tariffs are inflationary and growth-negative — another stagflation driver.
Rising geopolitical tensions (trade wars, supply chain disruptions, regional conflicts) add a risk premium. In times of geopolitical uncertainty, central banks (China, India, Middle East) often increase Gold reserves as a hedge against USD exposure.
BRICS talk of de-dollarization is structurally supportive: even a small reserve shift from USD to Gold creates steady demand.
5. Forward Outlook
Near-term (1–3 months): Fed cut in September almost certain. USD likely to weaken further, Gold stays bid. Volatility spikes around CPI (Sept 11) and FOMC (Sept 17).
Medium-term (3–6 months): If inflation doesn’t fall below 3%, Fed may slow rate cuts, but Gold could still benefit from safe-haven + central bank buying.
Key Catalysts to Monitor: September CPI, Fed meetings, earnings season (margin compression risk), geopolitical escalations, tariff policies.

ZGM | CAN GOLD HIT 3755 ? We Are Seeing The Bull Run Month In Gold
So The H1 Timeframe Gold Telling A Very Bullish Market Move Coming In History That Gold Have Create A High Strong Bullish Channel That We Are Expecting Gold That The Gold Are Continuously Bullish

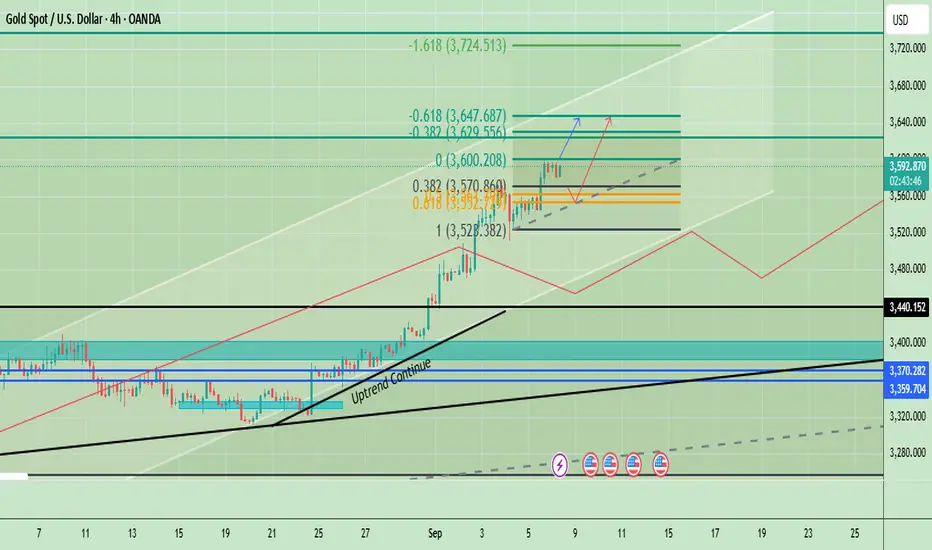
Gold Price Analysis | Fed Rate Cut Hopes & CPI Data in FocusGold is consolidating just below the $3,600 resistance zone, which is a critical pivot. The uptrend structure remains intact, and short-term retracements into the $3,570–$3,552 zone can provide a strong buy opportunity. A decisive break above $3,600 would trigger further bullish momentum toward $3,629, $3,647, and potentially $3,724. On the downside, a daily close below $3,528 would weaken momentum, while a drop under $3,440 would signal trend exhaustion.
Macro fundamentals support this bullish bias: weak U.S. labor data has boosted expectations for Fed rate cuts in September, while the upcoming CPI release on September 11 will be the key event. Softer CPI would confirm easing conditions and strengthen gold’s rally, while a hotter CPI could trigger a short-term pullback into support.
🔑 Key Levels
- Immediate Resistance: $3,600, $3,629 – $3,647
- Support / Buy Zone: $3,570 – $3,552, $3,528 (structural swing low support).
✅ Best Setup:
- Buy Zone: $3,570–$3,552
- Buy Trigger: Bounce from support or breakout above $3,600
- Upside Targets: $3,629 → $3,647 → $3,724
- Invalidation: Below $3,528
Note
Please risk management in trading is a Key so use your money accordingly. If you like the idea then please like and boost. Thank you and Good Luck!
Gold Sellgold is in up trend and has reached to level of resistance as we can gold is having accumilation on this point and possibly could move downwards we can observe this through volume and volume drop is the key here as seller are gaining power and buyer seems not to be intrested in buying more so we can sell it 3579 level of support a possible sell move
Remember its an Up trend

Never predict the top; go long with the trendThe bullish momentum for gold is unstoppable, with basically no significant pullbacks. Therefore, gold will only continue to stay strong for now. It is basically impossible to wait for a major pullback in gold at the moment—if a sharp pullback starts, it will no longer be a correction. The current market follows the rule: "A strong trend sees no correction; a correction means no strength."
The 1-hour moving averages of gold remain in a bullish divergence pattern with a golden cross trending upward. After breaking above the 3,600 level, gold has continued to move higher. Now that it has broken through and held above 3,600, this level will become a key support for gold in the short term. In such a strong market, gold usually resumes its strength after a pullback of around 20 US dollars. Those who haven’t entered the market can go long on dips around 3,620 in line with the trend. Those who already hold positions can just keep holding.
A real trending market won’t end so soon. Gold is now in a major bull market cycle—there’s no need to predict the top during a rally. Following the trend means going long; we’ll keep the gold bullish trade going all the way.
If you feel confused about the future market trend, or if you have not yet made profits in such a market, follow me and leave me a message – let me help you resolve this issue.

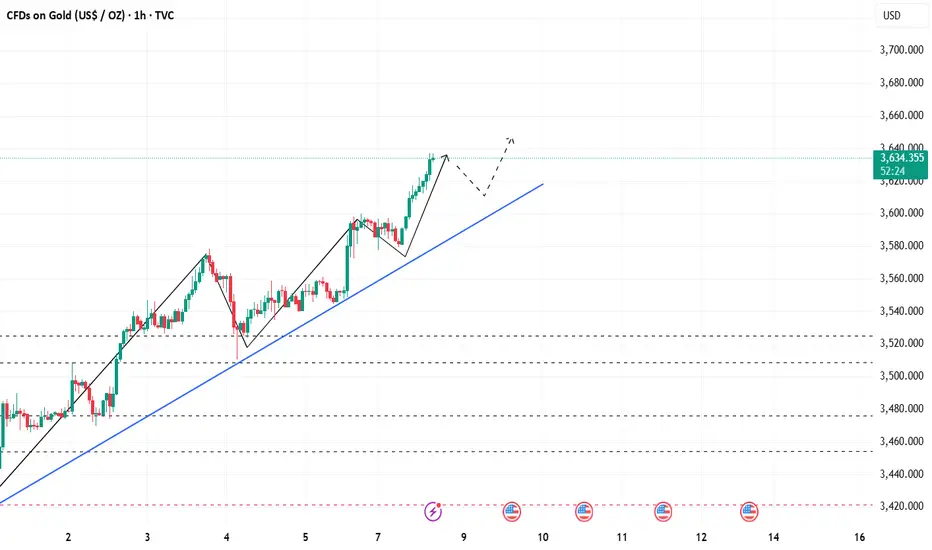
GOLD 1H CHART ROUTE MAP UPDATE Hey Everyone,
Great start to the week with our 1h chart idea playing out, as analysed.
We started with our Bullish target hit at 3593 followed with ema5 cross and lock opening 3613, which was hit perfectly. We then got a further ema5 cross and lock above 3613 opening 3638, also completed today - beautiful!!
We will now look for ema5 cross and lock above 3638 to open the range above or failure to lock above here will follow with a rejection into the lower Goldturns for support and bounce.
We will keep the above in mind when taking buys from dips. Our updated levels and weighted levels will allow us to track the movement down and then catch bounces up.
We will continue to buy dips using our support levels taking 20 to 40 pips. As stated before each of our level structures give 20 to 40 pip bounces, which is enough for a nice entry and exit. If you back test the levels we shared every week for the past 24 months, you can see how effectively they were used to trade with or against short/mid term swings and trends.
The swing range give bigger bounces then our weighted levels that's the difference between weighted levels and swing ranges.
BULLISH TARGET
3593 - DONE
EMA5 CROSS AND LOCK ABOVE 3593 WILL OPEN THE FOLLOWING BULLISH TARGETS
3613 - DONE
EMA5 CROSS AND LOCK ABOVE 3613 WILL OPEN THE FOLLOWING BULLISH TARGET
3638 - DONE
EMA5 CROSS AND LOCK ABOVE 3638 WILL OPEN THE FOLLOWING BULLISH TARGET
3658
BEARISH TARGETS
3562
EMA5 CROSS AND LOCK BELOW 3562 WILL OPEN THE FOLLOWING BEARISH TARGET
3528
EMA5 CROSS AND LOCK BELOW 3528 WILL OPEN THE SWING RANGE
3492
3470
EMA5 CROSS AND LOCK BELOW 3470 WILL OPEN THE SECONDARY SWING RANGE
3438
3408
As always, we will keep you all updated with regular updates throughout the week and how we manage the active ideas and setups. Thank you all for your likes, comments and follows, we really appreciate it!
Mr Gold
GoldViewFX

Gold Tests Key Reversal Zone – Bears on WatchGold ( OANDA:XAUUSD ) completed the move as I expected in my previous idea , both the down and up moves I expected.
Gold is currently moving in the Potential Reversal Zone(PRZ) .
Also, we can see the Regular Divergence(RD-) between Consecutive Peaks .
In terms of Elliott wave theory , it looks like Gold is completing the 5th microwaves of the main wave 3 .
I expect Gold to start correcting in the coming hours and drop to at least $3,593(First Target) .
Second Target: $3,583
Stop Loss(SL): $3,634
Gold Analyze (XAUUSD), 1-hour time frame.
Be sure to follow the updated ideas.
Do not forget to put a Stop loss for your positions (For every position you want to open).
Please follow your strategy; this is just my idea, and I will gladly see your ideas in this post.
Please do not forget the ✅ ' like ' ✅ button 🙏😊 & Share it with your friends; thanks, and Trade safe.

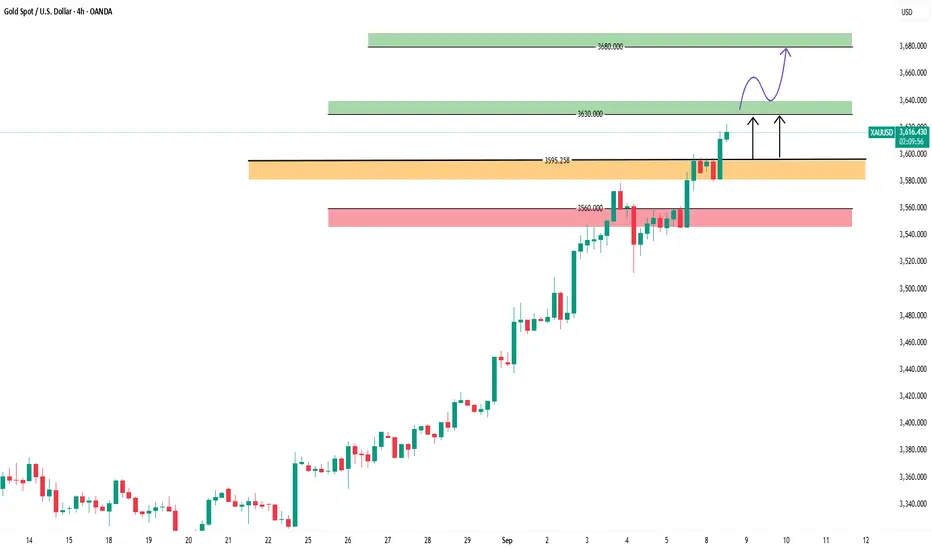
GOLD analysis in time frame 4h
🔹 If price trades above 3595:
• The trend will likely continue upward toward the resistance level at 3630.
• A breakout above 3630 and holding above it (on the 4-hour or 1-hour candle) would confirm a continuation upward toward 3680.
⸻
🔹 If price fails and breaks below 3595:
• The trend will likely move downward toward the support level at 3560.
• This support is strong, but if it is broken, the trend may fully shift into a deeper decline.
⸻
📌 In short:
• Above 3595 → bullish trend (targets 3630 → 3680).
• Below 3595 → bearish trend (targets 3560 → further downside).
Been going long all along—how many of you followed?The international gold price has continued its consistent strong trend. It not only remains firmly anchored at a high level but also keeps advancing toward new ranges driven by bullish momentum, with the stability and continuity of the current trend now extremely clear. For investors who have already established gold long positions, it is advisable to hold their positions firmly and avoid triggering profit-taking prematurely due to minor short-term fluctuations. As we have emphasized repeatedly, in such a one-sided strong market, exiting early – or "getting off the bus ahead of time" – is essentially equivalent to missing out on subsequent trending gains and can even be considered an implicit loss. More crucially, in a strong market, prices usually do not offer those who exit midway a chance to re-enter at a low price. Once you miss the opportunity (miss the market), you will likely have to chase the rally to enter, significantly increasing the risk of your positions.
For investors who have not yet entered the market, there is no need to feel anxious about missing the previous price gains, as the current strategy remains clear: wait for a minor retracement in the price, then enter the market in batches with a small position to "secure a spot" – establishing a foundational position first to keep in step with the trend direction. It is imperative to remember the core logic of the trading market: "A strong market sees no correction; a correction means the market is not strong." If the current trend is truly robust, the retracement will inevitably be extremely shallow and short-lived, leaving no room for excessive hesitation.
If you feel confused about the future market trend, or if you have not yet made profits in such a market, follow me and leave me a message – let me help you resolve this issue.
Gold 3600, nothing is impossible!
💡Message Strategy
Amidst the volatile global economy, gold, the king of safe-haven assets, has once again shone brightly. This week, driven by a combination of technical, fundamental, and key economic data, gold prices achieved one of their strongest weekly performances in recent years, breaking through key resistance levels and setting new all-time highs.
Spot gold prices started the week at $3,446.61 per ounce, then, after a period of volatility, settled firmly around $3,590 per ounce by the close, marking three consecutive weekly gains. This not only ignited the enthusiasm of Wall Street bulls but also significantly strengthened the confidence of ordinary investors that inflation is once again a market focus.
📊Technical aspects
First of all, congratulations to my friends who follow me. When gold was at the bottom of 3330, our idea was to rise firmly. Now the gold position has reached 3600, which is in line with our expectations and has brought rich returns to investors.
The release of the non-farm payroll report, which fell far short of market expectations, immediately ignited another surge in gold prices, pushing the price close to $3,600 per ounce.
As expected, despite reaching these unprecedented highs, gold prices have seen little significant pullback, closing the week around $3,585 per ounce, demonstrating the gold market's strong resilience and upward momentum.
💰Strategy Package
Long Position:3540-3550,SL:3520,Target: 3620

Gold (XAU/USD) is hovering just below or at all-time highsFundamental Drivers
Record highs near $3,600/oz: Gold (XAU/USD) is hovering just below or at all-time highs around $3,600. Weak U.S. jobs data (just 22,000 added in August) has heightened expectations of aggressive Federal Reserve rate cuts, fueling gold’s rally.
Reuters
Financial Times
FXEmpire
Dovish Fed outlook and global uncertainty: The confluence of expected rate cuts, a weaker dollar, and global instability has pushed gold sharply higher, attracting both speculative traders and central bank buyers.
FXEmpire
FX Leaders
Barron's
Forecasts trending higher: Analysts see more upside. Estimates range from $3,700 soon to a year-end target near $4,000, possibly even $5,000 by 2026 under certain scenarios.
Barron's
Trading News
FX Leaders
Technical Signals
Momentum strong, but stretched: Technical readings (RSI, MACD, Stochastic etc.) largely signal a strong bullish bias—but many show overbought conditions.
Investing.com
+1
Key levels to watch:
Resistance: ~$3,640–3,650 zone—break here could open the path to new highs.
TradingView
+1
Support: ~$3,580–3,600—crucial area for holding bullish structure.
TradingView
+1
Scenarios vary from continued rally to a short-term correction if resistance holds.
TradingView
RoboForex
Strategic sentiment: Many technical analysts remain bullish, recommending long entries on dips near support, while a few caution of a pullback given the sharp rise.
TradingView
+1
RoboForex

GOLD Bulish Breakout ? What's next ??#GOLD.. after na fantastic move to upside market just closed above hia current resistance, that was 3573-74
So it will be be current supporting area now because market closed above that on weekly n daisy basis.
Keep close and if market staying above that than we can expect further bounce tp upside.
NOTE: we will go for cut n reverse below 3571 on confirmation.
Good luck
Trade wisley

Gold Roadmap | Short termGold ( OANDA:XAUUSD ) created a new All-Time High(ATH) almost every day this week.
How long do you think this upward trend in Gold will continue?
Reasons for Gold's upward trend this week:
Announcement of the US economic indexes.
Geopolitical issues that occurred in the world(China meeting, possible tension between Venezuela and the US, etc.)
Gold is currently moving between the Potential Reversal Zone(PRZ) and the Support zone($3,580-$3,572) .
In terms of Elliott Wave theory , Gold appears to be completing microwave 5 of the main wave 3 .
I expect Gold to start rising again from the Fibonacci levels and touch the Potential Reversal Zone(PRZ) .
Note: If Gold breaks the Support zone($3,580-$3,572) and Support lines, we can expect further declines.
Gold Analyze (XAUUSD), 15-minute time frame.
Be sure to follow the updated ideas.
Do not forget to put a Stop loss for your positions (For every position you want to open).
Please follow your strategy; this is just my idea, and I will gladly see your ideas in this post.
Please do not forget the ✅ ' like ' ✅ button 🙏😊 & Share it with your friends; thanks, and Trade safe.

Critical Zone 3610–3620:Shorts Get Ready!After retreating to around 3579, gold rebounded again and has now reached a high of around 3614. Fortunately, the gold retracement gave us the opportunity to safely exit our previous short positions, and we accurately seized this pullback opportunity to close all our previous short positions at a break-even point.
As I said, closing my short position does not mean that I am not optimistic about the gold pullback, but in the process of executing swing trading, we need to constantly adjust to make our short entry price more favorable to us. Therefore, closing the short position entered at a relatively low price previously gives us the flexibility to enter the short position again at a higher price.
Gold was quickly pulled up to around 3614 in the short term. There was almost no headwind in the short term. Driven by the dual expectations of interest rate cuts and risk aversion demand, the bullish momentum was strong. However, in the short term, we are currently facing the 3610-3620 trend line resistance area, so I still do not advocate continuing to chase more gold; on the contrary, no matter what, I will continue to try to execute swing trading to short gold in the 3610-3615 area.
Although the bulls have risen strongly, it does not actually provide a good position to enter the market to go long on gold. Since we cannot participate in long transactions, we can only try to short gold in waves during constant adjustments. On the premise of controlling trading risks, as long as we are not afraid of short-term floating losses, once gold begins to collapse, we will be the first traders to reap the benefits of the short position. Therefore, when gold is facing the trend line resistance area of 3610-3620, I first considered and executed a short trade at 3610-3615 as planned, hoping that the gold market will have a good retracement as some unsteady funds show signs of profit-taking!
