“Gold Rebounds from Demand Zone — Short-Term Recovery Ahead”Analysis:
Gold (XAU/USD) on the 4-hour chart shows a strong corrective decline after forming an SMC trap near the 4,250–4,300 zone, where liquidity was swept before a sharp selloff. Price has now reached the High Probability POI (Point of Interest) around the 3,850–3,880 region, showing early signs of a bullish reaction.
The recent candle structure indicates buyers are stepping in from this demand zone, confirming a potential short-term reversal. If momentum sustains, the first target zone lies around 3,950–3,980, aligning with minor resistance and previous imbalance fill.
Outlook:
📈 Bias: Bullish correction (short-term)
🧭 Key Support: 3,850 – 3,880
🎯 Target: 3,950 – 3,980
⚠️ Invalidation: Break below 3,840 may reopen bearish continuation toward 3,780
Goldprediction

GOLD 4H CHART ROUTE MAP UPDATE & TRADING PLAN FOR THE WEEKHey Everyone,
Please see our updated 4h chart levels and targets for the coming week.
We are seeing price play between two weighted levels with a gap above at 4173 and a gap below at 4079. We will need to see ema5 cross and lock on either weighted level to determine the next range.
We will see levels tested side by side until one of the weighted levels break and lock to confirm direction for the next range.
We will keep the above in mind when taking buys from dips. Our updated levels and weighted levels will allow us to track the movement down and then catch bounces up.
We will continue to buy dips using our support levels taking 20 to 40 pips. As stated before each of our level structures give 20 to 40 pip bounces, which is enough for a nice entry and exit. If you back test the levels we shared every week for the past 24 months, you can see how effectively they were used to trade with or against short/mid term swings and trends.
The swing range give bigger bounces then our weighted levels that's the difference between weighted levels and swing ranges.
BULLISH TARGET
4173
EMA5 CROSS AND LOCK ABOVE 4173 WILL OPEN THE FOLLOWING BULLISH TARGETS
4264
EMA5 CROSS AND LOCK ABOVE 4264 WILL OPEN THE FOLLOWING BULLISH TARGET
4333
EMA5 CROSS AND LOCK ABOVE 4333 WILL OPEN THE FOLLOWING BULLISH TARGET
4333
EMA5 CROSS AND LOCK ABOVE 4333 WILL OPEN THE FOLLOWING BULLISH TARGET
4422
EMA5 CROSS AND LOCK ABOVE 4422 WILL OPEN THE FOLLOWING BULLISH TARGET
4494
BEARISH TARGETS
4079
EMA5 CROSS AND LOCK BELOW 4079 WILL OPEN THE SWING RANGE
3985
3873
EMA5 CROSS AND LOCK BELOW 3873 WILL OPEN THE SECONDARY SWING RANGE
3741
3632
As always, we will keep you all updated with regular updates throughout the week and how we manage the active ideas and setups. Thank you all for your likes, comments and follows, we really appreciate it!
Mr Gold
GoldViewFX

When the market was confused, I shorted at 3975#XAUUSD OANDA:XAUUSD TVC:GOLD
Yesterday's short profit marked a good start to this week's trading. Today we will continue this good habit and continue to make profits.
First, the weekly MA5 moving average has broken below and is moving closer to the MA10 moving average. Secondly, through the hourly chart and 4H chart, we can find that the bears still dominate the market. Then our trading idea is very clear, which is to focus on shorting on rebounds.
Gold has already fallen below 3950, so it is likely to hit the 3900 integer mark next, or even 3880-3870, or even the weekly MA10 around 3835. However, in the short term, I still recommend not blindly chasing shorts and be wary of a possible rebound in the short term. Conservative traders can wait for a rebound to 3960-3975 before attempting to continue shorting gold.

GOLD (XAU/USD) – 15-Minute Chart AnalysisCurrent Price: 4006.53
Trend: Short-term bearish
🔍 Chart Breakdown
The price is moving within a descending channel, indicating a continuation of the bearish momentum.
There is a key resistance zone around 4035–4060, highlighted in the shaded area. This zone aligns with previous structure and upper trendline resistance.
The market is currently making a minor pullback toward this resistance area after touching the lower boundary of the descending channel.
📉 Expected Move
The purple projection suggests a pullback to the resistance zone, followed by a strong rejection downward.
The target level is set around 3920.72, which corresponds to a previous swing low and a possible completion of the bearish wave.
⚙️ Trading Outlook
Direction Entry Zone Stop Loss Take Profit Confirmation
Sell 4035–4060 4075 3920 Rejection candle or bearish engulfing at resistance
📊 Summary
Gold remains in a short-term downtrend, and the best opportunity is to wait for price to test resistance (4035–4060) before considering short positions targeting 3920.
A breakout above 4075 would invalidate this bearish setup and could signal a potential trend reversal. LME:CA1! LME:MC1! LME:SN1! LME:LH1! LME:SC1! LME:AH1! LME:CO1! LME:ZS1! LME:PB1! LME:HC1! LME:AA1! LME:EA1! LME:ST1! LME:AN1! LME:AW1!

GOLD (Xauusd) is going DOWN! great sell tradeAs you can see GOLD - Xauusd is in a clear downtrend. The red lines drawn show a downward channel which indicate that GOLD is now moving to the downside... Secondly, Gold has broken a powerful support level (the upper green line)! It is now very likely to head down to the lower green line (next support level). Great time to sell!

Gold at a Critical Crossroad: Bounce or Breakdown Ahead?Hi!
The gold price is currently trading around $4,042, sitting just above a critical support area near $3,953.80. This gray zone is a key decision point for the next major move.
Trend Structure:
The broader trend remains bullish, moving within a well-defined ascending channel.
Double Top Formation:
A short-term double top has formed near recent highs, triggering a corrective move down into the channel’s midline and the gray support area.
Critical Support Zone ($3,953.80):
This level aligns with previous structure support and the channel’s bottom, making it a high-probability reaction zone.
________________
Scenario 1: Bullish Reaction (Primary Scenario)
If gold holds above the gray critical area and bounces within the ascending channel, we could see a renewed bullish wave.
Confirmation: A strong bullish reaction or higher low around $3,953–$3,980.
Target: The green target zone around $4,619.57, corresponding to the upper channel boundary and a potential measured move from the recent correction.
Scenario 2: Bearish Breakdown
If the gray area fails to hold, it could signal deeper downside momentum.
Trigger: A clean break and 4H close below $3,953.80.
Target: The pink support zone near $3,656.01, which aligns with prior accumulation and the lower channel boundary.
________________
Disclaimer: As part of ThinkMarkets’ Influencer Program, I am sponsored to share and publish their charts in my analysis.

The Ultimate GOLD & SILVER Outlook || 5 Trade Setups 28-Oct-2025Welcome to Trade with Decrypters!
📊 DETAILED & COMPLETE ANALYSIS (5 TRADE SETUPS) - OANDA:XAUUSD Gold & Silver Outlook 2025
🏦 Central Bank Buying
* 900 tonnes accumulated YTD 2025 (Q3: +19t)
* BRICS hold 6,000t (20% global reserves)
* 🇨🇳 China: +2,299t
* 🇮🇳 India: +880t
* 🇵🇱 Poland: +68t (H1)
* Motive: De-dollarization & sanctions hedge
📈 Outlook: 950t full-year supports long-term price appreciation.
💰 ETF Inflows & Sentiment
* YTD inflows: $28B (AUM: $472B, +6% QoQ)
* US inflows: $22B | Europe: $4.4B (Sept)
* Gold RSI: 78.4 (Support: $3,700 | Resistance: $3,840)
* Silver RSI: 72 (Support: $42)
📈 Outlook: Gold → $3,400/oz (Q4) | Silver → $38/oz on 150t annual inflows.
🌍 Macro & Geopolitical Events
* Fed cuts: 50 bps by YE, Funds rate → 4.25%
* US CPI 2.7% → 2.9% Q4 (tariffs impact)
* BRICS gold-backed currency expected 2026
* USD reserves down 15% since 2022
* Trade wars → CPI +0.5–1%
📈 Outlook: Gold → $3,675/oz | Silver → $38.45/oz (Q4) on global inflation >5%.
⚡ Silver Deficit
* 2025 deficit: 149M oz (Supply: 844M oz | Demand: 1.21B oz)
* Industrial demand: 680M oz (+12% EVs, +20% solar)
* China: 40% PV use
📈 Outlook: Deficit to widen → 206M oz (2026) | Silver > $40/oz on 9% industrial growth.
📊 Futures & Options Flow
* CME Gold OI: 529k (+12% YoY)
* Silver OI: 180k (+15%)
* Gold call/put ratio: 2:1 | Silver: 3:1
* CVOL: 15–18%
📈 Outlook: OI → 550k by YE | Volatility → 20% on Fed + geopolitics.
🔮 Fundamentals & Forecast
* Gold: +15–20% → $3,400/oz YE 2025
* Drivers: 900t CB demand, $64B ETF inflows, de-dollarization
* Silver: +45% → $38/oz YE 2025
* Drivers: 149M oz deficit, 59% industrial demand
⚡ Macro Drivers: CPI >2.7%, Fed cuts, US deficit 7%, BRICS fragmentation.
Structural re-rating likely into 2026 🚀
Disclaimer: This analysis is for educational purposes only. Not financial advice.

XAUUSD 1H – EW Long SetupHi fellow traders,
On the 1H XAUUSD chart, I am applying Elliott Wave principles to outline a potential long setup. Price seems to have completed wave 4 and is reacting from the golden box area, suggesting that wave 5 may now start unfolding to the upside.
The invalidation level at 4004.72 represents my expected end of the correction, although the setup remains valid even if price moves slightly lower. My Stop Loss is set at 3940.00, which would confirm structural failure if reached. The Take Profit is positioned at 4437.36, targeting the projected completion of wave 5.
Good luck and trade safe!

XAUUSD Bearish Short-Term, Bullish Longer-TermFundamental approach:
- Gold prices traded lower this week after setting fresh record highs earlier in Oct, pressured by profit-taking and cautious sentiment ahead of delayed US inflation data.
- Geopolitical uncertainty and expectations of further Fed easing continued to support underlying demand for safe havens in the longer term.
- US President Trump'sTrump's new sanctions on Russia and export restrictions toward China, alongside the prolonged US government shutdown, reinforced demand early in the week. At the same time, stabilization in trade rhetoric and rising yields curbed momentum later.
- However, a stronger US dollar and rising Treasury yields amid improved global risk appetite and optimism around an upcoming US. China dialogue also reduced safe-haven demand in the short term, especially with today's CPI, which is expected to rise.
Technical approach:
- Gold consolidated within the range of 4054-4113. The price is below the converging EMAs, indicating that a bearish momentum persists.
- If the XAUUSD breaches the support at 4054, the price may decline further toward the next support level at 3950.
- On the contrary, remaining above 4054 may prompt a retest of the upper range at 4143, confluenced with the EMA21.
Analysis by: Dat Tong, Senior Financial Markets Strategist at Exness

Gold Price Analysis - Gold Breakout Levels 4200 vs 4040Gold is trading inside a tightening rising channel after forming a strong higher timeframe rejection from the ATH which pushed price into a corrective phase. Buyers have repeatedly defended the strong support zone near 4000-3980 creating a false breakout low followed by a controlled recovery showing that demand remains active.
However, each rally into the weak-high resistance at 4160-4200 has shown fading momentum meaning sellers are still protecting this zone aggressively. Until price breaks out with a clean close and retest above this resistance gold will remain in a neutral to slightly bullish consolidation phase driven by stop hunts and choppy movements inside the channel.
A successful breakout above 4200 can trigger a bullish continuation toward 4240 then 4320-4360 and possibly back to the ATH zone while a breakdown below 4040 rising support would shift the structure bearish again exposing the 3980 demand and potentially a deeper drop to 3900 if buyers fail there.
In simple terms buyers still control support, sellers still control resistance and the next big move will come once one of these critical levels breaks with strength.
✅ Option 1-Strong Bullish Bias
Gold is still respecting the rising channel and defending the strong support zone around 4000-3980. As long as price stays above the rising trendline bullish structure remains valid. A clean breakout above 4160-4200 will confirm continuation toward 4240 → 4320 → ATH retest. Buyers are still in the game, waiting for the breakout.
✅ Option 2-Neutral to Bullish
Gold is consolidating inside a rising channel after rejecting the ATH. Support remains strong around 4000-3980 while sellers continue to defend 4160-4200. A breakout on either side will define the next major move. Above 4200 bullish continuation toward 4240 and 4320+. Below 4040 deeper pullback toward 3980 and possibly 3900.
✅ Option 3-Neutral to Bearish
Gold is struggling to break above 4160-4200 showing seller strength at the top of the range. If price fails again and breaks below the rising channel near 4040 downside can accelerate toward 3980 and 3900 for liquidity. Bulls must hold support to avoid a deeper correction.
Gold remains trapped between 4040 support and 4200 resistance inside a rising wedge. Buyers holding strong at the bottom but sellers still defending the top. Break above 4200 bullish continuation toward 4320. Break below 4040 bearish move to 3980-3900. Still a range waiting for breakout confirmation.
Note
Please risk management in trading is a Key so use your money accordingly. If you like the idea then please like and boost. Thank you and Good Luck!

Gold bulls are powerless to recover rebound continues to bearishThis week, global financial markets are focused on the Federal Reserve's upcoming interest rate decision. Gold prices typically have a negative correlation with real interest rates. Rate cuts typically reduce the opportunity cost of holding gold, thus supporting prices. In the current environment of rising risk appetite, even if the Fed cuts rates as expected, gold's safe-haven appeal may be offset by trade optimism.
Yesterday, gold prices broke through the psychologically important 4,000 level as expected, and we saw significant returns on both short positions. After consolidating below the 4,160 high, gold is poised to break lower, generally in line with expectations. The daily candlestick pattern formed a doji candlestick pattern, followed by a mid-sized bearish candlestick pattern that engulfed the lower level, continuing its downward trend. The daily and weekly corrections are still ongoing. The daily chart finally closed at 3982, with a long black candlestick with a long upper shadow. Today's market continues to short. Gold's resistance level is currently moving downwards. The four-hour chart is entirely filled with long black candlesticks. Any rebound is easily swallowed by these large black candlesticks. These large black candlestick bodies demonstrate the strength of the bears, breaking through all support levels. The only lower support level is around 3950. If this breaks down, bears will target around 3800. Therefore, we will continue to focus on long positions, clearly at yesterday's support point, around 4040.
From a technical analysis perspective, gold is showing clear bearish signals on the one-hour chart. The moving averages are showing a bearish alignment, with the short-term moving averages pushing downward, indicating that short-term bears have the upper hand. Furthermore, the MACD indicator's death cross continues to diverge, and the growing green momentum bar further confirms the downward price trend. During the Asian session, watch for a rebound in gold prices to the 4035-4040 range. A small position can be entered into a short position with a stop-loss above 4050 to protect against losses from a sudden price reversal. Target prices can initially target the 4000 mark, with further downside potential targeting the 3980-3950 range.

Gold Bullish Reversal Expected from D-FVG ZoneKey Observations and SMC Components:
D-FVG (Daily Fair Value Gap):
The most important element is the large shaded gray box at the bottom, labeled D-FVG. This indicates an Inefficiency or Fair Value Gap identified on the Daily timeframe, making it a powerful area of demand where institutional buying pressure is expected.
CRT-L and CRT-H:
CRT-L (Current Range Low/Bottom) is placed near the bottom of the D-FVG zone, marking a key support level.
CRT-H (Current Range Top/High) marks the high of the recent drop.
Current Price Action:
The price is currently at $3,974.61 and has been trending down. It is approaching the key support/demand zone (D-FVG).
Projected Move:
The curved line and green arrow indicate the anticipated price action: a continuation of the drop into the D-FVG zone, followed by a strong rejection and a reversal upwards (a rally).
The rally's TARGET is marked by a dotted line, sitting below the CRT-H level (around $4,020 - $4,030).
Trading Bias and Expectation
The overall bias is short-term bullish following the retracement. The analyst expects price to:
Retrace/Consolidate: Drop into the high-probability D-FVG demand zone (around $3,920 to $3,940).
Reverse and Rally: Find strong support in this zone, then reverse and move upwards to hit the intermediate TARGET.

Gold - Sell near 4019, target 3980-3970Gold Market Analysis:
Yesterday, we sold gold at 4066, 4037, 4049, and 4050, maintaining a bearish outlook. Yesterday's blog analysis and chart clearly demonstrated this bearish outlook. Gold's selling price dipped to as low as 3970, surprisingly breaking through 4000 with ease. In fact, from a broader perspective, 4000 is a major support level and a round number. I predict there will be further trading around 4000. Today's strategy remains bearish, so continue selling on rallies. Yesterday's decline was too large, and today's decline is expected to correct. Gold has been volatile recently, so we should try to follow the trend and chase orders. If you follow orders, the probability of losses is higher. A small rebound can result in 30-50 pips, making it difficult to take technical positions. We must also stick to our direction and not change it easily. Today's Asian session tested resistance at 4019. If this level holds, selling is still acceptable. The current pattern suggests a stronger resistance level at 4049, which has transformed from a previous strong support level into a new resistance level. Yesterday's daily chart closed negative, and after breaking 4000, selling today suggests continued downward momentum. Furthermore, if 4049 unexpectedly breaks, it will be necessary to observe whether there is a new rally.
Resistance levels are 4019 and 4049, support is 3970, and 4019 is the dividing line between strength and weakness.
Fundamental Analysis:
The decline in gold prices is attributed to the fading of news, which has led to a decline in risk aversion. We will continue to monitor the Federal Reserve's new monetary policy.
Trading Recommendation:
Gold - Sell near 4019, target 3980-3970.

Analysis of the latest gold price trends today!Market News:
In early Asian trading on Tuesday (October 28th), London gold prices continued to fall, currently trading around 3980. Progress in Sino-US trade talks, coupled with strong global stock market performance and rising US Treasury yields, have weakened gold's safe-haven appeal. International gold prices plummeted on Monday, falling below 4000, reaching a low of 3971. From last week's high of 4381, gold has fallen by nearly $400! As tensions between the world's two largest economies ease, investors are more inclined to sell gold and shift to riskier assets such as stocks and technology stocks, putting pressure on gold prices. This week, global financial markets are focused on the Federal Reserve's interest rate decision, to be announced on Wednesday. If the Fed reiterates its path of gradual rate cuts at its meeting and fails to signal an end to quantitative tightening, international gold prices may struggle to rebound quickly. The current pullback in gold prices may present an opportunity to invest at a low level, but caution is advised. Closely monitor the Fed's interest rate decision and post-meeting statement, as well as the outcome of Thursday's Sino-US meeting. In addition, tech earnings reports and consumer confidence data will also provide further market guidance. Investors should consider these factors comprehensively and develop flexible investment strategies.
Technical Analysis:
Gold fell below the 4000 mark and closed with a negative daily close. Technically, the daily chart structure remains biased towards selling. Yesterday, it pulled back below the middle Bollinger Band level of 4000 to 3971. The RSI indicator reached the mid-line 50 and adjusted its value. The 10/7-day moving average formed a death crossover at the high of 4175 and opened downward. On the short-term four-hour chart, after the formation of a double top structure at 4380, gold has entered a mid-term structural correction. The price is trading within the lower middle Bollinger Band, the RSI indicator is trading below the mid-line, and the moving average system is opening downward. Gold still has room to fall. I personally believe that the upward trend will not break in the short term. Gold has broken below the 4000 mark and is about to test the 3900 level. After breaking through the neckline of the double top on the four-hour chart, it has been fluctuating weakly below the neckline. Selling momentum still exists. Gold once broke through the 4004 level, which has now become resistance. Gold's resistance below 4004 presents an opportunity to buy on rallies. Gold is under pressure and struggling to break through, so continue to sell on rebounds!
Gold Intraday Trading Strategy:
Short-term buy gold at 3910-3915, stop loss at 3900, target at 3980-4000;
Short-term sell gold at 4005-4010, stop loss at 4020, target at 3950-3920;
Key Points:
First Support Level: 3962, Second Support Level: 3920, Third Support Level: 3886
First Resistance Level: 4010, Second Resistance Level: 4045, Third Resistance Level: 4078

Gold headed to $3,650?This head and shoulders pattern points to $3650... which also matches the 0.618 fib retracement.
If it falls below that, $3450 is likely.. as it would reach the .786 and fill a daily/weekly/monthly gap. This is when you back up the truck!

XAU/ USD Bullish trend analysis Read The captionSMC Trading point update
-
Technical analysis of XAU/USD (Gold Spot)
Timeframe: 1H (OANDA)
Technical Basis: Smart Money Concepts (SMC) + EMA Confluence
---
Market Structure
Current trend: Bearish, price respecting a descending wedge/channel.
Recent Break of Structure (BOS) confirms bearish momentum continuation.
Price is retracing after forming a new low and may move back to mitigate imbalance (FVG).
---
Key Technical Areas
Retracement Levels:
0.5 – 0.79 Fibonacci zone marks the premium shorting area.
Fair Value Gap (FVG) zone between 0.62–0.79 levels is the ideal entry region.
EMA Resistance:
EMA-50 ≈ 4,067
EMA-200 ≈ 4,120
Both EMAs align with the supply zone, strengthening sell bias.
---
Projected Move
1. Expected retracement toward the 4,067–4,100 zone (supply/FVG region).
2. Potential short entry within that area.
3. Bearish continuation targeting the next structural low at 3,960 (as marked).
---
Targets
Next Target (retracement zone): 4,089
Final Bearish Target: 3,960
Mr SMC Trading point
---
Summary
Gold remains under bearish pressure within a contracting structure. A retracement to the premium zone (4,067–4,100) offers potential short opportunities aligned with structure and EMA resistance. A break below 3,995 would further confirm bearish continuation toward 3,960.
---
Pelas support boost 🚀 this analysis

GOLD ANALYSIS (1 W)To understand the psychology in Gold,
I use only two tools:
Fibonacci retracement,
Trend-based Fibonacci extension.
We will use these two tools to measure the weekly cycles.
Since November 2022, Gold has been forming a pattern that can only be explained by Fibonacci principles.
Using Fibonacci retracement for each swing high and low, you'll realize that each retracement equals around 50%.
In only one example, we see that a higher low reaches the 61.8% level, which is also acceptable.
After these retracements, the next leg of the impulsive move always reaches around the 1.618 Fibonacci extension.
According to these two basic technical factors, Gold should first reach around $3,800, and then aim for the $6,600 level during the next impulsive leg in the coming years.
I’m not even going to list all the reasons why Gold tends to go up over time.
Most people reading this analysis are already aware of the fundamentals behind Gold’s long-term bullish nature.
Thanks for reading.

Gold weekly chart with both buy and sell entriesLast week both buy and sell levels hit for over 1000 pips each.
This will probably be my last chart for awhile as i dont think theres much intrest in this
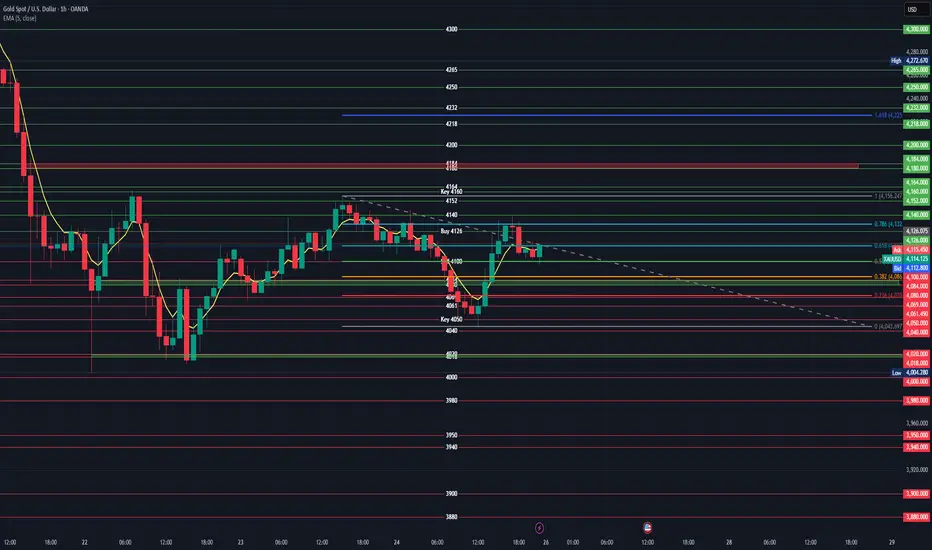
### XAUUSD 4-Hour Chart Analysis
#### **Key Levels Identified**
The chart shows critical **support/resistance zones** based on Fibonacci retracements, historical price action, and labeled key levels. Below is a breakdown of actionable buy/sell levels:
---
### **1. Buy Levels (Long Entry)**
These levels represent potential support where price may reverse upward:
- **Primary Buy Zone**: `4,126` (labeled "Buy 4126" on the chart)
- **Why?** This level aligns with the **0.236 Fibonacci retracement** of the recent swing high (4,164) to swing low (4,004). Historically, price has bounced here.
- **Entry Trigger**: Wait for bullish reversal signals (e.g., bullish engulfing candle, RSI divergence, or price closing above the 5-period EMA).
- **Stop Loss**: `4,095` (below the "Sell 4100" resistance level).
- **Take Profit**: Target `4,160` (Key 4160 resistance), then `4,180` and `4,184`.
- **Secondary Buy Zone**: `4,110–4,115` (near the 0.618 Fibonacci retracement at `4,113.253`)
- **Why?** The price is consolidating here after a dip. A hold above `4,100` (Sell 4100 level) suggests bullish momentum.
- **Stop Loss**: `4,095` (as above).
- **Take Profit**: Same as primary zone (`4,160` and beyond).
---
### **2. Sell Levels (Short Entry)**
These levels represent potential resistance where price may reverse downward:
- **Primary Sell Zone**: `4,132` (0.786 Fibonacci retracement of the swing high/low)
- **Why?** This level is a strong resistance zone where the price often reverses after a rally.
- **Entry Trigger**: Wait for bearish reversal signals (e.g., bearish pin bar, RSI divergence, or price rejecting the level).
- **Stop Loss**: `4,135` (above the resistance level).
- **Take Profit**: Target `4,099` (0.5 Fib), then `4,086` (0.382 Fib), and `4,050` (Key 4050 support).
- **Secondary Sell Zone**: `4,160` (labeled "Key 4160")
- **Why?** This is the **major swing high** (4,164) and a key psychological resistance level. A rejection here confirms a bearish trend.
- **Entry Trigger**: Price must break above `4,160` and then fail to hold (e.g., a bearish candlestick pattern at the level).
- **Stop Loss**: `4,165` (above the resistance level).
- **Take Profit**: Same as primary sell zone (`4,099` and below).
---
### **Critical Context**
- **Current Price**: `4,111.797` (EMA 5 close). This is **above support (`4,100`)** and **below resistance (`4,132`)**.
- **Trend**: Short-term downward momentum after the 4,164 high, but price is recovering from a low. Wait for confirmation of reversal.
- **Fibonacci Retracement**:
- `0.786` (4,132) and `0.618` (4,113) act as key resistance/support.
- `0.5` (4,099) and `0.382` (4,086) are stronger support levels.
- **Risk Management**:
- Always use a stop loss to limit downside risk.
- Target levels should align with the broader trend (e.g., if the trend is bearish, prioritize sell setups).
---
### **Summary of Actionable Levels**
| **Trade Type** | **Entry Level** | **Stop Loss** | **Take Profit** | **Confirmation Signal** |
|----------------|-----------------|---------------|-----------------|-------------------------|
| **Buy** | 4,126 (primary)4,110–4,115 (secondary) | 4,095 | 4,160 → 4,180 → 4,184 | Bullish reversal candle, RSI divergence |
| **Sell** | 4,132 (primary)4,160 (secondary) | 4,135 → 4,165 | 4,099 → 4,086 → 4,050 | Bearish reversal candle, RSI divergence |
> **Note**: Always validate entries with additional indicators (e.g., RSI, volume) and avoid trading during low-volume periods. The 4-hour timeframe favors medium-term trades (1–3 days), so patience is key.
Gold falls below 4,000, is a bearish trend starting?
News:
Signs of easing trade tensions between the United States and China boosted investor appetite for riskier assets, as evidenced by optimism in global stock markets, which became a key factor weakening demand for safe-haven precious metals.
This week is a super week, with several major central banks, including the Federal Reserve, set to announce their interest rate decisions. The Federal Reserve, in particular, is expected to cut rates by another 25 basis points early Thursday morning.
The market currently anticipates further Fed rate cuts this week and in December. As long as this expectation remains unchanged, it will continue to support markets like stocks, gold, and silver, while putting pressure on the US dollar. Conversely, if expectations are not met, the market will reverse course.
Specifically:
Judging from the 4-hour market trend, the current focus is on the short-term suppression line of 4055-4045. Gold is under pressure and difficult to break through. The 4000 mark has been broken, and a short-term bearish pattern has been opened. The operation is mainly based on rebound shorting. For the middle position, watch more and do less, be cautious in chasing orders, and wait patiently for key points to enter the market. I will provide detailed operation strategies in the channel, so please pay attention to them in time.
Trading strategy:
Buy: 4025-4035, SL: 4050, TP: 3965-3945

Gold Pullback or Reversal? Key Zone Ahead!As I expected , Gold ( OANDA:XAUUSD ) started to drop thanks to the Double Top Pattern and reached its target at the Support zone($4,011 – $3,981) .
Now, do you think Gold will start dropping again, or will it resume its recent weeks’ uptrend?
Today, I’m going to do a short-term 15-minute analysis of Gold , so stay tuned.
At the moment, Gold is approaching a Resistance zone($4,192 – $4,137) —also a Potential Reversal Zone (PRZ) —and moving within an ascending channel . Overall, the recent moves in Gold over the past couple of days look like a pullback to the previous Support zone($4,192 – $4,137) .
From an Elliott Wave perspective , it seems that Gold , given the momentum of its recent drop, is completing corrective waves, and we should expect another decline .
I expect Gold to start dropping again from the Resistance zone($4,192 – $4,137) and PRZ , and AFTER breaking the lower line of the ascending channel , it could fall at least down to around $4,039(First Target) .
Second Target: Support zone($4,011 – $3,981)
Stop Loss(SL): $4,222
Please respect each other's ideas and express them politely if you agree or disagree.
Gold Analyze (XAUUSD), 15-minute time frame.
Be sure to follow the updated ideas.
Do not forget to put a Stop loss for your positions (For every position you want to open).
Please follow your strategy; this is just my idea, and I will gladly see your ideas in this post.
Please do not forget the ✅ ' like ' ✅ button 🙏😊 & Share it with your friends; thanks, and Trade safe.

Weak market rebound can short goldGold prices encountered resistance near 4,084 and began to pull back. The short position we entered in the morning has now been closed for profit around 4,044. Currently, gold has broken below the triangular consolidation zone, which aligns with our expectations. Based on the current technical structure and market sentiment, we do not plan to enter any long positions for the time being.
The key support below gold prices now is the market’s psychological level of 4,000. Judging from the current market conditions, unless a major risk event occurs unexpectedly, a break below 4,000 is only a matter of time. After the Asian session’s rally followed by a pullback, and the European session’s break below today’s low, we can continue to enter short positions if there is a rebound during the U.S. session.

GOLD aka XAUUSD is heading to the downside!!Last week XAUUSD (Gold) had a very bearish week! It ended its bullish streak of years and declined to the downside. It only recently broke a very strong support zone (the green trendline) and struggled to break above the resistance zone (red trendline). It should drop all the way down further all the way to the 3833 level.

Gold 4H — Bearish Control With FVG Above
Gold continues to trade under bearish structural dominance, currently ranging between 4,161.535 (local supply) and 4,004.280 (structural support).
The market remains in compression, forming a potential redistribution range within a broader downtrend.
If price breaks below 4,004.280, it confirms a bearish BOS, opening the path toward the 4H Demand Zone (3,960–3,944) — where a reaction or further continuation could occur.
Above, two unmitigated Fair Value Gaps (FVGs) remain at 4,240–4,320, serving as potential retracement targets if the market shows a corrective pullback after internal CHoCH.
However, as long as 4,161 holds as resistance, bearish dominance stays intact.
Range → Break → Mitigation → Continuation → Expansion.
Until structure shifts, rallies are just liquidity grabs.
Technical Outlook Summary:
Dominant Bias: Bearish
Range: 4,161 – 4,004
FVGs Above: 4,240–4,320
Demand Zone: 3,960–3,944
Break Below 4,004: Bearish continuation
Break Above 4,161: Temporary retracement, not reversal
NFA | AI generated | Educational Purpose Only
OANDA:XAUUSD FXOPEN:XAUUSD
