Gold Price Reaches a New All-Time HighGold Price Reaches a New All-Time High
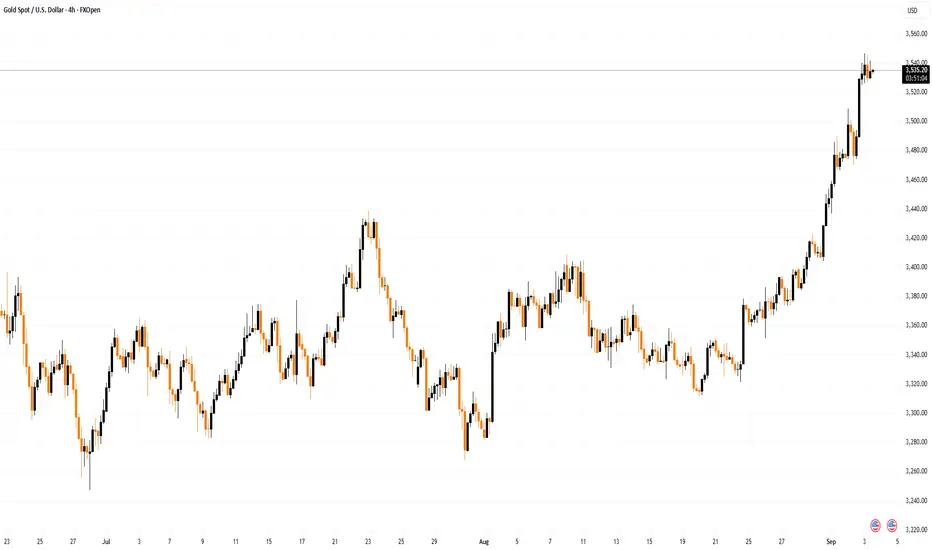
As shown on today’s XAU/USD chart, the price of gold has risen above $3,530 per ounce for the first time in history.
In 2025, the increase in gold prices has been driven by sustained central bank purchases, asset diversification, steady demand for so-called safe-haven assets amid geopolitical and trade tensions, as well as general dollar weakness.
At the beginning of September, bullish sentiment may have been reinforced by:
→ Expectations of a Federal Reserve rate cut. According to the CME FedWatch tool, markets are pricing in a nearly 92% probability of a 25-basis-point rate cut at the Fed meeting on 17 September. Gold, as a non-yielding asset, is typically seen as a beneficiary of low interest rates.
→ News from China, where, in the presence of leaders from many countries, the establishment of a SCO development bank was announced. Market participants may have interpreted this as a new source of geopolitical risk and as pressure on the dollar’s status. Donald Trump has already claimed that the summit in China represents a conspiracy against the United States.
Technical Analysis of the XAU/USD Chart
Looking at gold’s price on 11 August, we:
→ Drew descending lines forming a red channel.
→ Highlighted an important support zone in the form of a bullish Fair Value Gap (marked as FVG1 in purple).
New data allows for the following observations:
→ FVG1 acted as support in the second half of August.
→ The red channel lines resemble a large-scale bullish flag pattern within a long-term uptrend, underscored by the EMA.
By using the July and August extremes, we can trace the outlines of an upward trajectory (shown in blue). The price is currently near the upper boundary, which could trigger a pullback, given overbought signals on the RSI indicator and investors’ potential desire to take profits after more than a 6% rise over the past 10 days.
From a bullish perspective, a possible pullback target could be the potential support area formed by:
→ FVG2. Although it does not strictly conform to construction rules, it reflects an imbalance in favour of buyers that led to a sharp price rally. Bears attempted to resist around the psychological $3,500 level but were defeated.
→ Level C, representing the 50% Fibonacci retracement of the A→B impulse.
It should be noted that the upward impulse has not yet been exhausted, as indicated by the green lines.
This article represents the opinion of the Companies operating under the FXOpen brand only. It is not to be construed as an offer, solicitation, or recommendation with respect to products and services provided by the Companies operating under the FXOpen brand, nor is it to be considered financial advice.
Goldtechnicalanalysis
GOLD (XAUUSD): Another Breakout Ahead?!
Gold closed on Friday, testing a major horizontal resistance cluster.
Taking into consideration a strong bullish momentum,
the price may violate that as well.
Your next confirmation to buy will be a breakout of the underlined structure
and a daily candle close above 3452.
A bullish continuation to 3492 will be expected then.
❤️Please, support my work with like, thank you!❤️
I am part of Trade Nation's Influencer program and receive a monthly fee for using their TradingView charts in my analysis.

I might be the first to start shortingAgainst the backdrop of strengthened expectations of interest rate cuts and Trump's continued tough stance, gold rose above the 3400 mark and continued to above 3410. The upward momentum was relatively strong and market sentiment was optimistic. But the more this happens, the more dangerous it feels! In fact, from a short-term perspective, the foreseeable target area above is: 3415-3425 area, which has only 100-150pips of room for growth from the current gold price. So I think there is no need to continue chasing long gold for the time being.
From the current structure, although gold is in a fluctuating upward structure, the trading volume is gradually decreasing after gold broke through 3410, proving that as gold continues to rise, the market has gradually become more cautious. Judging from the candlestick pattern, the trend line constructed from the highs of 3500 and 3440 is currently facing resistance near 3415, while the resistance of the trend line constructed from 3452 and 3440 is currently near 3425. Therefore, the current more obvious resistance area is in the 3415-3425 area. In comparison, there is a larger retracement space below, firstly in the 3395-3385 area, and then in the 3375-3365 area.
Therefore, at this stage, I will no longer aggressively chase the rise of gold; instead, I will start shorting gold in batches above 3410, and then patiently wait for gold to retrace!

Bears’ Last Chance Before the Golden Bull AwakensToday, gold has held 3373 many times during the retracement process, proving that the current market is still dominated by bulls. Currently, gold has touched above 3390 again, showing that buying power is still continuing. This is also the reason why we have been long on gold in the 3378-3374 area many times today, mainly based on the fact that gold is currently in an obvious bullish structure.
But we need to note that although gold continues to rise, it is not strong. Most of the time it still fluctuates at a high level. It may be that the market is not highly unanimous in its agreement on the continuation of the strong bull market stimulated by the news, so the short-term volatility of gold will be exacerbated while it is rising.
In addition, gold is becoming more cautious as it approaches 3400. In comparison, there is still a certain amount of suppression in the area around 3400, so we must take into account that gold may still retreat after being under pressure in the short term, so I think it is necessary for us to try to short gold again in the 3395-3405 area; once gold retreats as expected, the first test will be the short-term support in the 3385-3375 area. If the support in the 3385-3375 area is effective during the test, then gold may be able to break through the 3400 mark in one fell swoop, or even continue to the 3410-3420 area.
So, in short-term trading. At present, we can consider shorting gold appropriately in the 3395-3405 area. If gold retreats as expected, we will first observe the performance of gold in the 3385-3375 area. If it cannot effectively fall below this area, we can adjust the trading strategy and re-enter the long trade!

Explosive Rally Ahead: Gold Eyes a 3400 BreakoutThere is no doubt that as long as gold is above 3350, the current gold market will maintain a strong bullish structure. After today's sideways trading, gold has clearly established a support platform in the 3370-3360 area. Although it has repeatedly fallen back under pressure in the 3380-3390 area, it has rarely fallen below the short-term support platform of 3370-3360. In addition, the candlestick charts have repeatedly shown long lower shadows, proving that the buying momentum is strong and the market bullish enthusiasm is high! Therefore, in short-term trading, we can try to go long on gold based on the 3370-3360 support level.
However, it's important to note that gold has repeatedly come under pressure at the 3380-3390 resistance level. If gold consistently fails to break through this resistance level during its upward trend, bullish sentiment could be affected. Therefore, gold may need to retest support before any further gains. If it falls below the 3370-3360 level during this retest, it could extend to the 3355-3350 level, which is strong support in the short term. Therefore, if gold falls below the 3370-3360 level, it could retest the 3355-3350 level, prompting bulls to launch a counterattack.
Therefore, in the short term, given that gold maintains a bullish structure, I would primarily consider going long on gold.
1. Consider initiating a long position in gold in the 3370-3360 area; first, see if gold can break through the 3380-3390 area as expected.
2. If gold retests the support area, consider resuming a long position in the 3355-3350 area.

Last chance to go long on goldAlthough the initial jobless claims and PPI data were bearish for gold, it still failed to break below 3340-3330 area. After touching 3340, it rebounded to around 3356, demonstrating that a significant amount of buying capital was still entering the gold market during the pullback, limiting the downside while also providing strong support.
Although gold has experienced several setbacks in its short-term upward trend, the bullish pattern has not completely failed. It remains within an ascending triangle structure in the short term. As long as this structure remains intact, gold could potentially rebound to the 3365-3375 area, or even to the 3380-3390 area, leveraging structural support.
Currently, there is a fierce game between bulls and bears in the short term for gold, which brings considerable difficulties to our short-term trading, but why do I keep insisting on going long on gold? What I want to say is that when you are uncertain in the short term, you can zoom in on the chart period and observe. In fact, the trend is clear at a glance, but there are some twists and turns in the short term!
Therefore, in the short term, I still advocate seeking to go long on gold with the 3345-3335 area as support, first looking at the target 3365-3375 area. If gold breaks through this area strongly during the rebound, the upward trend can continue to around 3380.

Gold’s Drop: The Calm Before the SurgeThe bulls have been defeated all the way, and the current lowest has fallen to around 3350. However, after gold touched around 3350, the downward momentum has slowed down. I think it is not appropriate to be overly bearish on gold in the short term.
It can be clearly seen during the day that gold started to fall from around 3401, and the decline reached $51 around 3350. In the absence of any major negative news, I believe that the intraday retracement space has reached its upper limit, and the structural support line for gold bulls happens to be in the 3350-3340 area, so the room for gold to continue to retrace will not be too large.
Moreover, gold has recently fallen under pressure several times after standing above 3340, proving that the upper resistance still exists. In addition, there is a certain amount of selling, which has hindered the bullish momentum to a certain extent, resulting in the lack of momentum for gold bulls. After the current pullback and technical repair, due to the increase in gold liquidity and accumulation of strength, it may be more conducive for gold to hit 3400 again or even higher targets.
Therefore, in the short term, I think it is not advisable to chase gold too much; instead, we can accumulate enough cheap chips during the gold pullback, and then wait patiently for gold to rebound and hit 3380-3390 again.

Grasp the trend accurately and have a crazy weekend!After testing the 3380 support level several times in a row today, gold maintained an oscillating upward trend. Today's layout of 3380 repeatedly went long, and 3400 shorts were all successfully closed with profits, with a total profit of 580pips. Currently, gold is oscillating at a high level in the 3404-3380 range. The possibility of a direction choice cannot be ruled out in the evening. If the market continues to be bullish in the evening, it is necessary to pay attention to whether the price will fall below 3380 when it tests the support level for the third time. If the support level is effectively broken, it is expected to fall to the key support level of 3370. If the price firmly stands above the 3400 mark, it may continue to test 3410. If there is no breakthrough either above or below, it will still maintain a range of oscillations, and the idea of selling high and buying low will be the main focus.

Next Stop 3420? Gold Bulls Push the Limit!Gold has shown a step-by-step rise in the short term, and has stood above 3,400 many times, and the bullish force is relatively strong. However, correspondingly, after gold stood above 3400, it fell under pressure several times, so the shape was not particularly good, which increased the risk of pullback in the short term.
However, we do not need to worry. Gold is still running in an ascending wedge structure. Although it has been under pressure and fallen back several times during the attack on 3400, the bullish structure has not been effectively destroyed so far. Moreover, with the sharp increase in gold buying, the 3380-3370 area below has become an obvious intensive trading area, which has greatly limited the gold retracement space.
In addition, after gold broke through 3340, market sentiment tended to be optimistic. If gold experiences a short-term pullback, more funds will flow into the gold market, especially for those who have missed out on long trades before, who will rush into the gold market even more frantically. Under the resonance of the current technical structure and market optimism, gold still has the potential to hit 3400, and bulls are even expected to stand firm at 3400 and make further efforts.
So in terms of short-term trading, I still advocate that gold pullbacks are buying opportunities. And I cherish the opportunity to enter the market and go long in the 3385-3375 area, and am optimistic that gold will hit 3400 again, and may even continue the bull trend to the 3420-3430 area.
OANDA:XAUUSD FOREXCOM:XAUUSD TVC:GOLD FX:XAUUSD CAPITALCOM:GOLD

GOLD (XAUUSD): Technical Analysis Ahead of Trump
One of the important news for today is Trump speech during
the late New York session.
Here is my brief technical outlook for Gold ahead of that.
As we discussed on the yesterday's live stream, the price
is now coiling on a recently broken rising trend line that serves
as a vertical resistance now.
A bullish breakout of that and a daily candle close above
will provide a strong bullish confirmation and push the prices to 3430.
Alternatively, very bearish news today may trigger a retracement
to an underlined horizontal support.
Let's see how the market is going to react tonight.
❤️Please, support my work with like, thank you!❤️
I am part of Trade Nation's Influencer program and receive a monthly fee for using their TradingView charts in my analysis.

GOLD (XAUUSD): Detailed Support & Resistance Analysis
Here is my fresh support & resistance analysis for Gold.
Vertical Structures
Vertical Resistance 1: Rising trend line
Horizontal Structures
Support 1: 3327 - 3344 area
Support 2: 3246 - 3275 area
Resistance 1: 3431 - 3451 area
The price is currently coiling on a trend line.
Your next bullish confirmation will be its breakout.
❤️Please, support my work with like, thank you!❤️
I am part of Trade Nation's Influencer program and receive a monthly fee for using their TradingView charts in my analysis.

GOLD (XAUUSD): Move Up Ahead?!
Friday's fundamentals made Gold very bullish during the New York session.
The price formed a high momentum bullish candle on a daily,
breaking a minor daily resistance area.
It gives us a confirmed Change of Character CHoCH and indicates
a highly probable bullish continuation next week.
I think that the price will reach 3400 level.
❤️Please, support my work with like, thank you!❤️
I am part of Trade Nation's Influencer program and receive a monthly fee for using their TradingView charts in my analysis.

Will Upcoming Data Determine the Next Gold's Direction?Macro approach:
- Gold retreated this week, reversing early gains to trade near four-week lows amid renewed US dollar strength and caution ahead of the Fed's policy decision.
- The retreat was mainly pressured by stronger-than-expected US economic data and a tentative revival in risk appetite, offsetting pockets of safe-haven demand.
- Key drivers included robust US GDP growth for 2Q, a bounce in consumer confidence, and the Fed's steady rates with a more hawkish tone, suggesting cuts may be further out.
- Meanwhile, recent US-EU and US-China trade deals eased some global uncertainty, damping gold's appeal as a hedge.
- Market participants also eyed the labor market's continued cooling, but resilient consumer spending further buoyed the dollar.
- Gold may remain volatile, with potential upside if upcoming US PCE inflation and NFP reports disappoint expectations. Any escalation in trade tensions or signals of Fed policy easing could renew support for gold prices.
Technical approach:
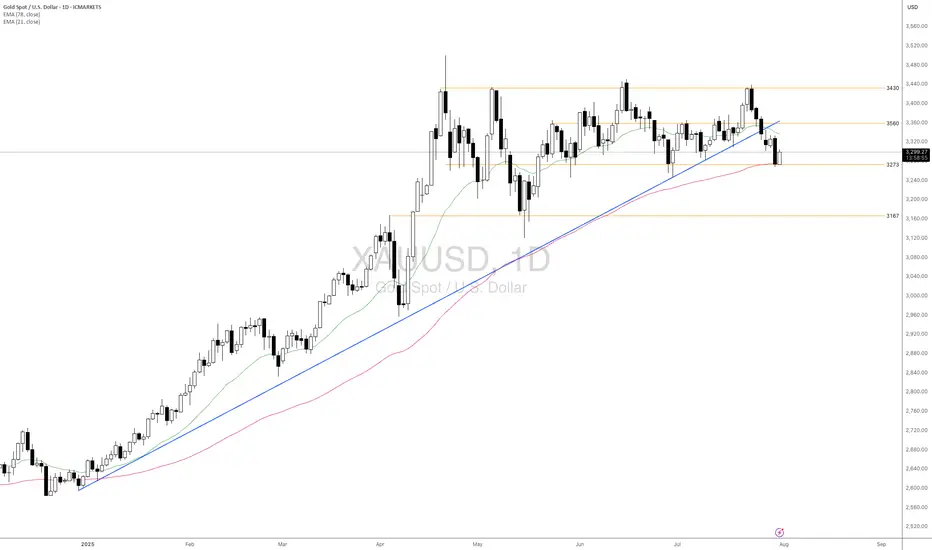
- XAUUSD fluctuated within the range of 3285-3560, which is below the broken ascending trendline. The price between the two EMAs awaits an apparent breakout to determine the next trend.
- If XAUUSD breaks below the support at 3273, confluence with EMA78, the price may plunge to retest the following support at 3167.
- On the contrary, remaining above the support at 3273 may lead XAUUSD to retest the resistance at around 3560.
Analysis by: Dat Tong, Senior Financial Markets Strategist at Exness
Gold Holds Trendline Amid Rising MomentumFenzoFx—Gold remains above the ascending trendline, trading around $3,386.0. Technical indicators like RSI 14 and Stochastic show rising momentum, reinforcing the bullish bias.
Immediate support lies at $3,347.0. If this holds, XAU/USD may climb toward the monthly VWAP at $3,412.0.
The bullish outlook is invalidated if Gold closes below $3,347.0, which opens the door for further downside toward the next support at $3,307.7.

Gold: $3,348.0 Resistance in Focus for BullsFenzoFx—Gold's decline reached the ascending trendline near $3,314.0. The bullish trend remains intact while price holds above the trendline.
Immediate resistance is $3,348.0, and a close above this level could lift the market toward $3,389.0 and potentially $3,451.0, aligning with recent higher-lows.

GOLD (XAUUSD): Support & Resistance Analysis for Next Week
Here is my latest structure analysis and important
supports and resistances for Gold for next week.
Consider these structures for pullback/breakout trading.
❤️Please, support my work with like, thank you!❤️
I am part of Trade Nation's Influencer program and receive a monthly fee for using their TradingView charts in my analysis.

GOLD (XAUUSD): Important Demand Zone Ahead
Gold is currently retracing from a key daily horizontal resistance.
Here are important structures to watch.
Horizontal Structures
Support 1: 3350 - 3377 area
Support 2: 3310 - 3324 area
Support 3: 3282 - 3301 area
Support 4: 3245 - 3374 area
Resistance 1: 3431 - 3451 area
Resistance 2: 3493 - 3500 area
Vertical Structures
Vertical Support 1: rising trend line
Vertical and Horizontal Supports 1 compose a contracting demand zone.
Probabilities are high the price will pull back from that.
❤️Please, support my work with like, thank you!❤️
I am part of Trade Nation's Influencer program and receive a monthly fee for using their TradingView charts in my analysis.

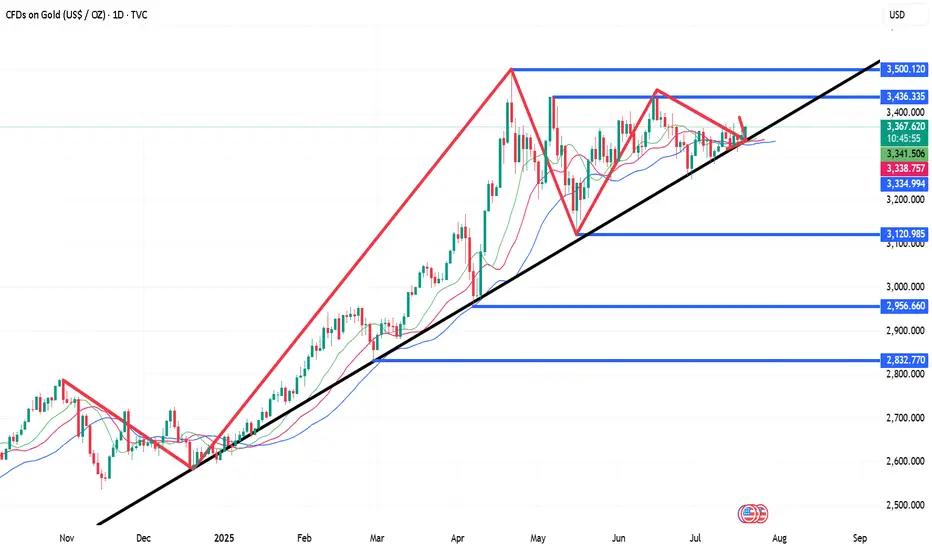
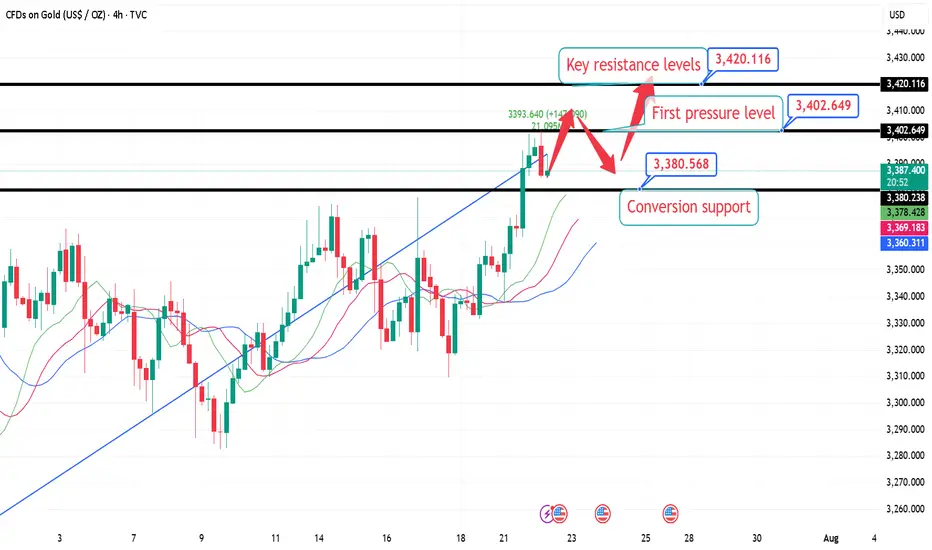
7.22 London Gold Market Analysis and Operation SuggestionsFrom the market perspective, the trend suppression line from the historical high of 3500 to the secondary high of 3452 has moved over time and is now around 3420, which can be used as an important resistance level reference for this week; the previous resistance level of 3376 can be converted into support after breaking through. For intraday short-term operations, focus on this range of callbacks and go long, wait for the key resistance level to be touched before going short, or see if there is an opportunity to arrange a mid-term short order based on the real-time trend.
Specific intraday operation ideas:
①. When the gold price falls back to around 3380, participate in long orders and call, protect the position of 3374, and first look at the position of 3402, the high point on Monday;
②. After yesterday's high point breaks, wait for a correction to around 3395 to continue to participate in long orders and call, protect the position of 3388, and look at the key suppression level of 3420;
③. (Aggressive orders, for those who are afraid of missing out) If you are short or have enough positions, you can first participate in long orders with a light position at the current price of 3388, and wait for 3380 to increase your position, and the target is the same as above.
Analysis of short-term gold trading on July 22Technical aspects:
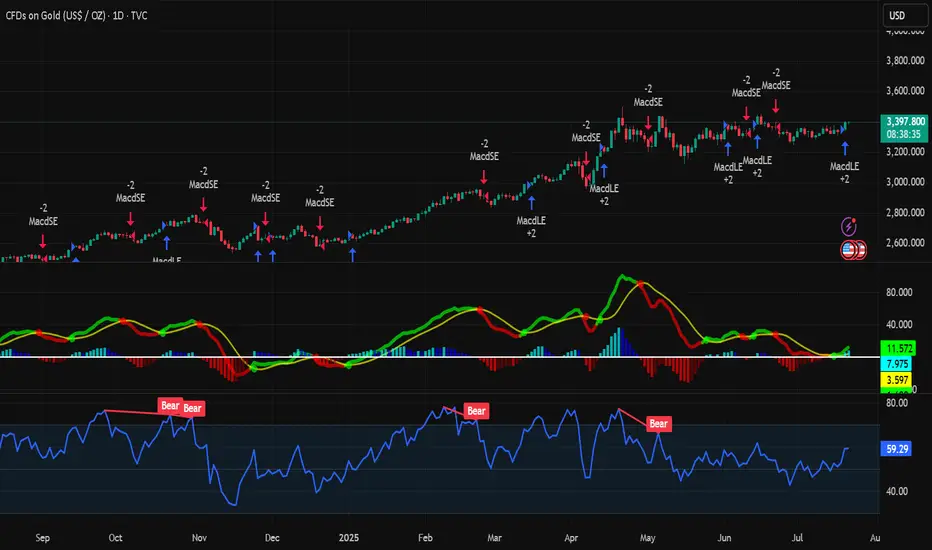
From the daily candlestick chart, gold has recently shown signs of breaking upward after five weeks of sideways fluctuations. In terms of MACD indicators, the MACD bar chart has turned from green to red, and the fast and slow lines have formed a "golden cross", strengthening the expectation of a short-term technical rebound.
At the same time, the 14-day RSI index rebounded to 57.67, still in the neutral and strong area, and has not yet entered the overbought area, indicating that the price still has room to rise. Analysis shows that the middle track of the Bollinger Band 3342 constitutes initial support, while the strong support below is at the two previous lows of 3247.87 and 3120.64.
If the bulls maintain their advantage above the integer position of 3400, they are expected to hit the high point of 3451.14 in the short term, and even further test the historical high of 3499.83; on the contrary, if they fall back below 3342, the short-term upward momentum will be tested.
Bull analysis:
If gold successfully stands above 3400, the market will turn its attention to the two key resistance areas of 3451 and 3499, the high point of the year. Breaking through the former will open up the space to test the historical high upward; combined with the current MACD golden cross pattern, if the capital side and the fundamentals continue to cooperate, it is not ruled out that there will be a short-term accelerated rise.
Bear analysis:
If the breakthrough fails, especially if gold falls back below the middle track of Bollinger, the adjustment pressure will be restarted, and the lower edge of the previous consolidation range of 3300 will constitute an important support. If it falls below again, it is necessary to pay attention to the important technical support near 3247 and the 100-day moving average of 3180.
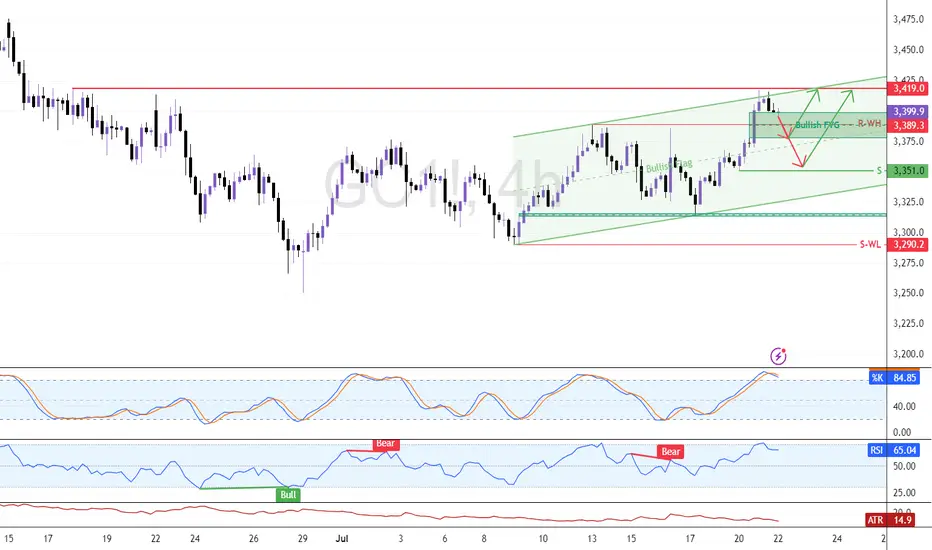
Eye These Levels to Go Long On GoldFenzoFx—Gold remains bullish but eased at $3,419.0 resistance. The Stochastic at 85.0 suggests a pullback may follow. Traders can watch support at $3,389.0 for short-term scalping.
Swing entries may emerge near $3,351.0 if bullish signals appear, such as candlestick patterns, structure breaks, or fair value gaps. Updates will follow if price reacts to these levels.
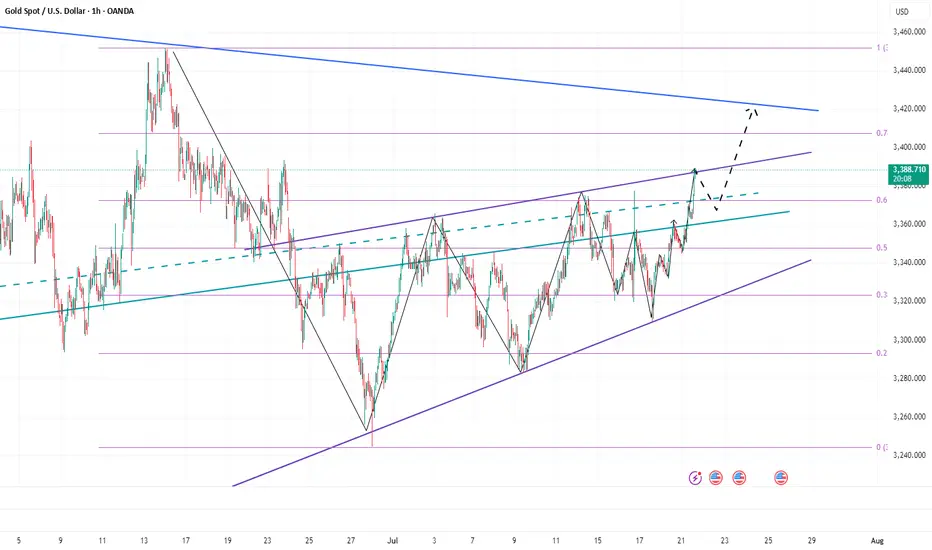
7.22 Gold falls back and continues to be bullish, 3400 is not thFrom the 4-hour analysis, the short-term support below is 3370, the important support is 3350-55, and the upper resistance is 3400-05. The overall support during the day is to maintain the main tone of high-altitude and low-multiple cycles in this range. For the middle position, watch more and do less, be cautious in chasing orders, and wait patiently for key points to enter the market.

Warning Signs After Gold’s Sharp Rise — Is a Pullback Coming?Today, gold rebounded from around 3345, and has now rebounded to around 3389, which is only one step away from the 3400 mark. Gold has hardly retreated during the rise, and the rise is strong. However, we can see from the small-level candle chart that gold suddenly accelerated its rise after consolidating around 3365, and continued to around 3390, and is now oscillating near the recent high trend line.
After gold accelerated its rise and oscillated near the recent high trend line, this made me have to be more cautious, because we must be careful that the acceleration of gold's rise in the short term is a trap for buyers, so even if we are bullish on gold in the short term, we should not directly chase gold at a high level; according to the current structure of gold, I think it is necessary for gold to retest the 3370-3360 area support before continuing to rise and hitting 3400. Only after verifying that the support in this area is effective can it be conducive to a better rise in gold!
So for short-term trading, I think we can still try to short gold now, and then wait patiently for gold to retest the 3370-3360 area.
Analysis of short-term operations of gold on July 21Daily Analysis:
On the daily chart, it can be seen that gold has rebounded from the main rising trendline again, and bargain hunters have set clear risks below the trendline, betting on a price rebound to the 3438 resistance level. Bears need the price to break below the trendline to open up space for a deeper correction, with the next target looking at the 3120 level.
4-hour analysis
On the 4-hour chart, it can be seen that there is a secondary resistance area near 3377. If the price rebounds to this level, it is expected that bears will intervene here and set risks above the resistance, with the goal of pushing the price below the main trendline. Bulls will look for the price to break through this resistance to increase their bullish bets on the 3438 level.