GOLD: Still Bullish? Buy This Massive Dip?In this Weekly Market Forecast, we will analyze Gold (XAUUSD) for the week of Feb. 2-6th.
Gold took a nosedive Friday after Trump's nomination for Fed Chair. The market reacted by a -14% drop, as investors moved funds from metals to the USD.
But is this an opportunity for savvy investors to enter this market at a discount?
Yes.
The market conditions that drove prices to ATHs are still in place. Nothing has changed. The uptrend has not been broken. So why not buy this dip?
Selling is not recommended for the reasons mentioned above.
Wait until the the market breaks structure to the upside on the HTFs, no less than the Daily TF, before entering new longs.
Outside of that, be patient, and let the market show its hand.
Enjoy!
May profits be upon you.
Leave any questions or comments in the comment section.
I appreciate any feedback from my viewers!
Like and/or subscribe if you want more accurate analysis.
Thank you so much!
Disclaimer:
I do not provide personal investment advice and I am not a qualified licensed investment advisor.
All information found here, including any ideas, opinions, views, predictions, forecasts, commentaries, suggestions, expressed or implied herein, are for informational, entertainment or educational purposes only and should not be construed as personal investment advice. While the information provided is believed to be accurate, it may include errors or inaccuracies.
I will not and cannot be held liable for any actions you take as a result of anything you read here.
Conduct your own due diligence, or consult a licensed financial advisor or broker before making any and all investment decisions. Any investments, trades, speculations, or decisions made on the basis of any information found on this channel, expressed or implied herein, are committed at your own risk, financial or otherwise.
Goldtrade

XAUUSD 45-Min Chart — Bullish Continuation with Short-Term PullbTrend: Clear bullish structure. Price is making higher highs and higher lows, supported by strong impulsive moves upward.
Key Demand Zones:
Major support: ~4,900–5,000 (bottom zone) — origin of the broader uptrend.
Intermediate demand: ~5,150–5,200 — previous consolidation and breakout base, now acting as support.
Current Price Action:
Price is trading just below a marked resistance zone (~5,520–5,560).
Rejection wicks at the top suggest selling pressure / profit-taking at resistance.
Resistance Zone:
The blue zone above current price is a supply / resistance area, where buyers are struggling to push through.
Pullback Scenario (Most Likely Short-Term):
A retracement into the support area around ~5,420 (red zone labeled “support area”) is likely.
This level aligns with prior structure and could act as a bullish retest.
Bullish Continuation Scenario:
If price holds above the support zone and shows bullish confirmation (strong bullish candle, rejection wick), continuation toward new highs above resistance is favored.
Invalidation / Deeper Correction:
A clean break and close below ~5,420 opens the door for a deeper pullback toward ~5,200 demand.
Bias Summary:
Short-term: Neutral to mildly bearish (pullback expected).
Medium-term: Bullish while price holds above key support zones.

Gold Jumps After Events in VenezuelaGold Jumps After Events in Venezuela
At the market open on Monday, 5 January, gold price (XAU/USD) formed a bullish gap. The sharp rise was driven by market reaction to confirmed reports of U.S. military intervention in Venezuela and a forced change of power in Caracas.
News of the capture of Nicolás Maduro by U.S. special forces pushed gold prices up to $4,430 during the European session, and the upward trend may persist into the U.S. trading session. The chart indicates rising demand for safe-haven assets, as market participants may be concerned about further escalation.
Technical Analysis of the XAU/USD Chart
On 26 December, when analysing the gold chart, we:
→ identified an ascending channel;
→ highlighted the $4,400 level;
→ suggested a scenario of bullish momentum exhaustion and profit-taking on long positions, which could lead to a pullback.
Indeed, since then a significant correction has developed, during which:
→ the price (marked by an arrow) expanded the ascending channel to the downside (its former lower boundary became the median line);
→ the $4,400 level acted as resistance on 30 December and 2 January.
However, the geopolitical drivers described above contributed to the following:
→ bulls used the lower boundary of the expanded channel as support to resume the upward move (with a bullish Inverse Head and Shoulders pattern forming on the chart);
→ the $4,400 resistance level was broken and may now act as support.
In the short term, it cannot be ruled out that the XAU/USD price may rise towards the median of the indicated channel.
This article represents the opinion of the Companies operating under the FXOpen brand only. It is not to be construed as an offer, solicitation, or recommendation with respect to products and services provided by the Companies operating under the FXOpen brand, nor is it to be considered financial advice.

Gold Price Breaks Above $4,500 for the First TimeGold Price Breaks Above $4,500 for the First Time
Just four days ago, we reported on the record breakout above the $4,400 level. The bullish gold market is now providing a new reason for analysis. As the XAU/USD chart shows, the gold price has risen above $4,530 today, marking a new all-time high.
The fundamental backdrop supporting demand for the metal is driven by expectations of monetary policy easing by the Federal Reserve in 2026, a weaker US dollar, and rising geopolitical tensions.
Technical analysis of the XAU/USD chart
The previously established ascending channel has changed in width but has maintained its angle of inclination. In this context:
→ the upper boundary is acting as resistance;
→ the channel median is providing market support.
Note that:
→ following the breakout above the $4,350 level (as indicated by the arrow), the price advanced steadily towards $4,400;
→ however, in recent days the RSI indicator has been forming bearish divergences, suggesting that bullish momentum may be losing strength.
Under these conditions, the market appears vulnerable to the formation of a corrective pullback.
Indeed, after an approximate 70% rally since the beginning of the year, profit-taking from long positions looks increasingly attractive. Nevertheless, given the holiday period, we may see gold price fluctuations simply fade near the newly reached record, with market activity resuming in the new year.
This article represents the opinion of the Companies operating under the FXOpen brand only. It is not to be construed as an offer, solicitation, or recommendation with respect to products and services provided by the Companies operating under the FXOpen brand, nor is it to be considered financial advice.

Gold Maintains Strong Uptrend – Caution for Short-Term Pullback📊 Market Overview
Gold prices continue to surge and are currently trading around 4400 USD/oz. The rally is supported by expectations of upcoming Fed rate cuts, a weakening U.S. dollar, and sustained safe-haven demand amid global uncertainties.
However, after such a sharp and extended rise, short-term profit-taking pressure may begin to appear.
📉 Technical Analysis
🔺 Key Resistance Levels
• 4415 – 4420: Strong psychological resistance where price may show technical reactions.
• 4455 – 4470: Extended resistance zone if gold breaks and holds firmly above 4400.
🔻 Key Support Levels
• 4378 – 4388: Immediate short-term support and technical pullback zone within the uptrend.
• 4355 – 4365: Stronger support if a deeper correction occurs during the U.S. session.
📈 EMA
• Price is trading above the EMA 09, confirming that the short-term bullish trend remains intact.
🕯️ Candlestick / Volume / Momentum
• Strong bullish candles indicate that buyers are still in control.
• Momentum is elevated, suggesting a potential pause, consolidation, or upper-wick reaction near resistance.
• No clear reversal pattern is visible on H1/H4 yet → the primary trend remains bullish.
________________________________________
📌 Outlook
Gold may continue rising in the short term as long as price holds above the 4380–4390 zone.
However, as price approaches 4415–4420, technical pullbacks or strong intraday volatility are likely before the market establishes its next direction.
💡 Trading Strategy
🔺 BUY XAU/USD : 4368 – 4365
🎯 TP: 40 / 80 / 200 pips
❌ SL: 4361.5
🔻 SELL XAU/USD: 4420 – 4423
🎯 TP: 40 / 80 / 200 pips
❌ SL: 4426.5

Gold Price Breaks Above $4,400 for the First TimeGold Price Breaks Above $4,400 for the First Time
As the XAU/USD chart shows, gold has climbed above $4,400 today, setting a new all-time high.
On Friday, when analysing the gold chart, we highlighted a triangle formation and noted strong selling pressure near the previous record high around $4,380, set in October.
However, over the weekend geopolitical tensions intensified following reports that the United States detained an oil tanker linked to Venezuela. At the turn of the week, this resulted in a clear triangle breakout (as indicated by the arrow):
→ during the second half of Friday’s session, gold moved above the upper boundary of the pattern;
→ at the Asian open, the price turned higher after retesting that level, with former resistance acting as support.
As a result, concerns about a potential armed conflict involving the US have shifted the balance of supply and demand decisively higher.
The bullish momentum has justified the construction of an ascending channel. It is worth noting that the RSI indicator is currently in overbought territory. Intraday trading during the US session could therefore bring some corrective pullback, with potential support coming from:
→ the lower boundary of the newly formed channel;
→ the area between the previous peak at $4,380 and the psychological $4,000 level.
According to Goldman Sachs analysts, structural demand from central banks combined with falling interest rates could drive gold prices towards $4,900 by the end of 2026.
This article represents the opinion of the Companies operating under the FXOpen brand only. It is not to be construed as an offer, solicitation, or recommendation with respect to products and services provided by the Companies operating under the FXOpen brand, nor is it to be considered financial advice.

Gold Price Analysis: Price Retreats From Record HighsGold Price Analysis: Price Retreats From Record Highs
As the XAU/USD chart shows, gold rallied yesterday to near its October all-time high around the 4,380 level, before pulling back (as indicated by the arrow).
The surge in volatility was driven by a combination of factors:
→ Expectations of US rate cuts. According to media reports, data released yesterday showed that inflation slowed to 2.7% in November, below the 3.1% forecast, while core CPI eased to 2.6%, the lowest reading since March 2021. Markets are currently pricing in roughly a 25% chance of a rate cut in January, with a cut by April seen as almost certain.
→ Geopolitical tensions. Traders are closely monitoring developments linked to Venezuela, where the risk of an armed conflict involving the United States has increased. Market participants also reacted to statements from UK and European politicians ahead of the EU summit.
On 5 December, we:
→ noted that the lack of a clear trend had resulted in the formation of a symmetrical triangle, with its midline around $4,205;
→ suggested that this pattern on the XAU/USD chart could act like a “compressed spring”, eventually leading to a volatility breakout.
Such a volatility surge materialised on 11–12 December, when gold broke out of the triangle and posted a high near $4,340.
Since then, a new triangle has begun to form, with a central axis around $4,316, reflecting a developing balance between supply and demand. In this context, it is worth highlighting that:
→ yesterday’s rally and subsequent reversal can be interpreted as a false bullish breakout, signalling strong selling pressure near the record high and suggesting that gold may retreat towards the lower boundary of the emerging triangle;
→ the approaching holiday period is typically associated with thinner market liquidity, which often amplifies price swings. In such conditions, gold could still surprise traders with another push to fresh record highs.
This article represents the opinion of the Companies operating under the FXOpen brand only. It is not to be construed as an offer, solicitation, or recommendation with respect to products and services provided by the Companies operating under the FXOpen brand, nor is it to be considered financial advice.

Short-Term Trend Pauses, Awaiting Breakout Direction📊 Market Overview
Gold is currently trading around the 4,320 level after a corrective move from higher prices. Short-term bullish momentum has slowed, and the market has shifted into a consolidation phase as buying and selling pressures are temporarily balanced, awaiting a new signal during the U.S. session.
📐 Technical Analysis
Short-term trend: Bullish correction (uptrend pausing)
Near resistance: 4,333 – 4,345
Major resistance: 4,360 – 4,380
Near support: 4,315 – 4,310
Strong support: 4,295 – 4,285
Price remains above EMA 20 & EMA 50 (M15–H1) → bullish structure remains intact
If price fails to break above 4,333–4,345, gold is likely to see a technical pullback toward lower support levels before choosing the next direction
🧠 Outlook
Gold is in a post-rally consolidation phase, with no clear bearish reversal signals, but it also lacks strong momentum for an immediate breakout. A safer approach is to buy near support and sell near resistance, avoiding entries in the middle of the range.
🎯 Trading Strategy Proposal
🔺 BUY XAU/USD
Entry: 4,310 – 4,305
🎯 TP: 40 / 80 / 200 pips
🛑 SL: 4,299
🔻 SELL XAU/USD
Entry: 4,335 – 4,340
🎯 TP: 40 / 80 / 200 pips
🛑 SL: 4,347

Gold Continues Its Uptrend as USD Weakens📊 Market Overview
Spot gold (XAU/USD) is currently trading around 4,326 – 4,330 USD/oz, supported by a weaker U.S. dollar and declining U.S. Treasury yields. Market sentiment remains positive as investors await upcoming U.S. labor data, which could reinforce expectations of further Fed rate cuts in 2026. Recent Fed rate cuts have also helped sustain buying interest in gold.
________________________________________
📉 Technical Analysis
• Key Resistance Levels:
🔹 4,360 – 4,380 — strong resistance zone where profit-taking pressure may emerge
🔹 4,400 — near the 2025 all-time high area
• Nearest Support Levels:
🔹 4,300 – 4,310 — psychological and short-term support
🔹 4,270 – 4,280 — deeper support in case of a corrective move
• EMA:
• Price is currently trading above EMA 9, indicating that the short-term trend remains bullish on H1/H4 timeframes.
• Candlestick / Volume / Momentum:
• Recent candles show sustained buying pressure after minor pullbacks.
• Trading volume has increased slightly near the 4,300 zone, suggesting bullish momentum remains intact as long as price holds above support.
________________________________________
📌 Market Outlook
Gold may continue rising in the short term if the U.S. dollar remains weak and upcoming U.S. economic data comes in softer than expected, reinforcing expectations of further Fed easing.
However, stronger-than-expected labor data or a rebound in bond yields could trigger a short-term correction toward lower support levels.
________________________________________
💡 Suggested Trading Strategy
🔻 SELL XAU/USD : 4,362 – 4,365
🎯 TP: 40 / 80 / 200 pips
❌ SL: 4,368
🔺 BUY XAU/USD : 4,300 – 4,303
🎯 TP: 40 / 80 / 200 pips
❌ SL: 4,297

XAUUSD H1 – POC 4295 & Fibonacci Sell 4373XAUUSD H1 – POC 4295 & Fibonacci Sell 4373
Strategy Summary
Today, I am not chasing price. The XAUUSD trading plan revolves around two of the cleanest zones on the chart:
POC (Volume Profile) around 4295 to look for BUYs in line with the main money flow.
Fibonacci level at 4373 to look for SELLs when price reaches the premium zone.
Key Levels
BUY zone (POC – Volume Profile): 4295 (major liquidity area)
SELL zone (Fibonacci reaction): 4373
Deeper buffer if POC breaks: 4238 – 4241
Invalidation level: 4191
Scenario 1 – Primary Plan: BUY at the Liquidity Zone (POC)
✅ Buy limit around 4295 (preferably wait for H1 candle confirmation)
SL: 4287 (below the POC zone to avoid noise)
TP1: 4330 – 4338
TP2: 4370 – 4373 (approaching the Fibonacci sell zone)
Logic:
The POC represents the “fair value” or balance point of the Volume Profile. Price is often drawn back to this level to collect liquidity before committing to the next directional move.
Scenario 2 – SELL on Reaction at Fibonacci (Premium Zone)
✅ Sell around 4373 (wait for a reaction or loss of momentum; do not chase the trade)
SL: 4382
TP1: 4338 – 4330
TP2: 4295 (return to the POC)
Logic:
The Fibonacci premium zone is commonly where profit-taking pressure emerges. If price spikes into 4373 but fails to hold, it often provides a textbook reaction sell setup.
Alternative Scenario – If the POC Is Broken
If price breaks below 4295 and clearly closes an H1 candle beneath this level, I will not force buy positions. Priority then shifts to waiting for price to react at:
4238 – 4241, or
deeper towards the lower balance / POC zone.
Always keep in mind that 4191 is the invalidation level.
News Context (to Avoid Being Stopped Out)
Trump has expressed concerns that economic impacts have “not fully filtered through yet”, increasing political risk and market sensitivity.
Comments from Williams (FOMC, New York Fed) on the economic outlook may trigger short-term volatility in USD and yields, leading to sharp moves in gold.
Tip: Avoid late entries during news-driven spikes. Only execute trades when price reaches the predefined zones.
Risk Management
Maximum risk per trade: 1–2%
Do not trade in the middle of the range. Trade only at key levels.
If you are also monitoring 4295 and 4373, share your view:
👉 Are you leaning towards a BUY on pullback or a SELL on reaction today?

XAUUSD H4 Lana Weekly AnalysisXAUUSD (H4) – Lana’s Weekly Analysis: Waiting for pullbacks to Fib 0.618 & 0.50 within major liquidity zones 💛
Higher-Timeframe Trend (D1)
Gold is revisiting its previous all-time high (ATH), but volume strength has not yet been convincing enough to confirm a strong breakout.
Primary Monitoring Timeframe
Timeframe: H4
Method: Fibonacci + trendline + liquidity zones + support/resistance
Plan: Lana avoids chasing price and prefers to look for BUY opportunities at discounted areas around Fib 0.618 and 0.50.
Market Context for the Coming Week
US Treasury yields, especially at the long end, remain elevated, making gold more prone to sharp short-term fluctuations.
Recent Fed commentary continues to reflect a cautious stance, while US political uncertainty may cause gold flows to become less predictable.
For this reason, Lana prioritises trading clearly defined price zones rather than attempting to forecast every short-term move.
H4 Technical Outlook (Medium-Term)
Gold’s current trading range is relatively wide. After a strong impulsive move, the market often needs a “cool-down” phase to rebalance liquidity.
On the H4 chart, the two most important areas align between Fibonacci retracement levels and major liquidity zones, making them suitable areas to wait for pullbacks before continuing in line with the broader trend.
Key Price Zones Lana Is Watching
1) Buy Zone 1 – Fib 0.618 (Preferred)
Entry: 4216 – 4220
Stop Loss: 4210
This is an attractive Fibonacci discount zone and an area where price is likely to react if larger flows step in to support the trend.
2) Buy Zone 2 – Fib 0.50 + Strong Support (Deeper Buy)
Entry: 4171 – 4175
Stop Loss: 4165
This scenario may unfold if price sweeps deeper liquidity before rebounding. Lana considers this a safer entry from a positional perspective, though it requires patience.
Trading Scenarios for the New Week
Primary Scenario – Trend-Following BUY on Pullbacks
Lana prefers to wait for price to retrace into 4216–4220, or deeper into 4171–4175, before entering trades.
If price reacts positively, upside targets will focus on rebounds towards higher resistance zones and the nearest recent highs.
Secondary Scenario – If Price Remains Elevated
If price remains in premium territory with heightened volatility, Lana does not recommend late entries.
Instead, the focus is on observing price behaviour and waiting for pullbacks into the predefined zones for cleaner, lower-risk execution.
Lana’s Notes 🌿
Each setup represents a probability, not a certainty.
Stop losses are always set in advance, with position sizing kept moderate to accommodate gold’s wide volatility.
Gold May Continue Its Short-Term Uptrend📊 Market Overview
• Global gold price is currently around 4,210.89 USD/oz.
• Bullish pressure continues to be supported by expectations that the Federal Reserve (Fed) will cut interest rates in the upcoming meeting — a weaker USD makes gold more attractive to global investors.
• However, the uptrend is showing a slight pullback after gold reached a “short-term high” earlier this week, mainly due to some profit-taking activity.
📉 Technical Analysis
• Key resistance levels: ~ 4,235 USD and ~ 4,260 USD/oz (near last week’s highs).
• Nearest support levels: ~ 4,190 USD and ~ 4,150 USD/oz — potential rebound zones if the price declines.
• EMA 09: Price remains above the EMA 09, indicating that the short-term trend is still bullish.
• Candlestick / volume / momentum: Market is showing signs of a “minor pullback / consolidation.” Volume is weakening compared to previous bullish sessions, reflecting investor caution after a strong rally — suggesting possible sideways movement or light correction before the next move.
📌 Outlook
Gold may continue rising in the short term if the USD keeps weakening, U.S. economic data softens, or the Fed signals a dovish stance. Conversely, if the USD strengthens sharply or inflation data rises, gold may move sideways or undergo a mild correction.
💡 Trading Strategy
• BUY XAU/USD at: 4,150 – 4,153 USD
🎯 TP: 40 / 80 / 200 pips
❌ SL: 4,146.5
• SELL XAU/USD at: 4,240 – 4,243 USD
🎯 TP: 40 / 80 / 200 pips
❌ SL: 4,246.5

XAUUSD – H2: Discount zone has formed, just waiting for the ...XAUUSD – H2: Discount zone has formed, just waiting for the price to pull back to continue buying up
On the H2 frame, gold just had a strong break up to the 4.180+ zone after a period of narrow range compression. At the end of the week, coinciding with Thanksgiving, I only prioritize waiting for an adjustment to the discount zone to buy up, absolutely not chasing the price at the peak.
🎯 MAIN SCENARIO – BUY THE DIP AT FIBO & POC ZONE 4.163–4.160
Buy entry: 4.163 – 4.160
SL: 4.155
TP: 4.178 – 4.195 – 4.220
⭐️ ALTERNATIVE SCENARIO – BUY DEEP AT VAL ZONE + STRONG SUPPORT 4.139–4.136
Buy entry: 4.139 – 4.136
SL: 4.130
TP: 4.150 – 4.172 – 4.190 – 4.220
The total risk for each scenario I always keep within the range of 1–2% of the account.
Basic context
End of the week + Thanksgiving ⇒ thin liquidity, easy to shake at the end of the session.
Messages from Trump & credit data show the economic picture and the December interest rate path are not really clear.
This keeps gold still having a defensive role, but not enough basis to expect a straight upward move – so I prioritize trading according to technicals and specific price zones.
Technical analysis H2
Market sentiment & trading plan
After the break, the buyers are holding momentum, but the price moving sideways at the high zone shows the market is partially taking profits, waiting for liquidity.
Thin liquidity easily creates sweeps to the support zone before turning around, that's the move I want to take advantage of.
Plan:
Prioritize Buy at 4.163–4.160, only consider the 4.139–4.136 scenario if the price is deeply sold off.
All orders have a hard SL (4.155 and 4.130), do not widen the stop.
Take partial profits, move SL in a favorable direction as the price approaches TP levels.
If you find the analysis useful, follow TradingView and leave a comment about the price zone waiting for entry – I always read feedback to optimize future posts.

Gold Short-Term Trading GuideThe price action today has been generally above 4130. After breaking through to a high of 4173 in the European session, it entered a short-term consolidation phase, without a rapid pullback compared to previous periods. The US session is expected to see a pullback for consolidation. The strategy remains to buy on dips above 4110. Avoid chasing the price higher! Look for opportunities to buy on pullbacks.
Short-term Strategy
Buy gold above 4110, stop loss at 4100, target 4180-4200
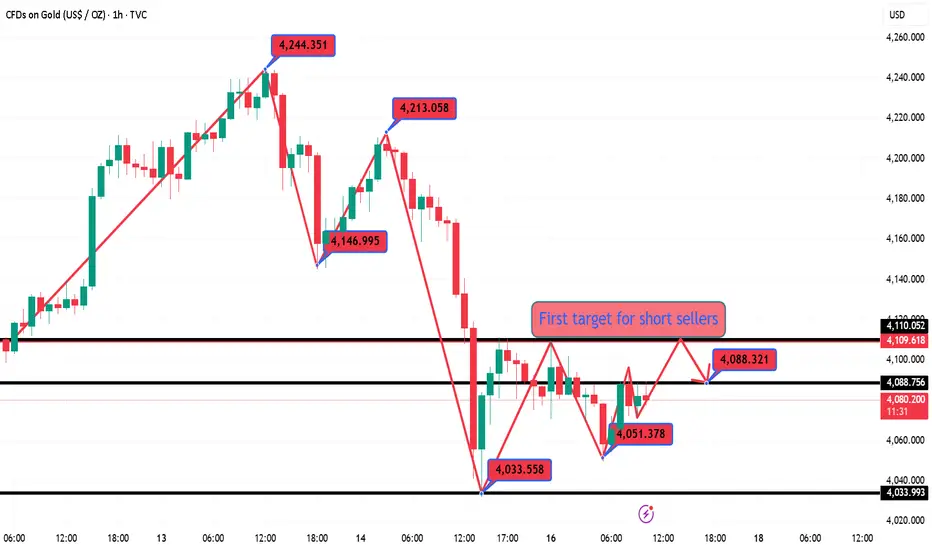
Gold US Session Short-Term Hourly Chart Analysis Guide (NovemberGold hourly chart: Overnight, it rose steadily, and in the Asian session today, it initially continued its upward trend, reaching a high of 4156. However, due to the recent period of consolidation, the continuity of gains has been relatively weak. The initial rise suggests a potential pullback in the afternoon or European session, with a likely scenario of a correction based on the 4150-4160 resistance zone. This prediction ultimately materialized, with the price falling to a low of 4109, close to the 38.3% Fibonacci retracement level of yesterday's gains at 4111. The European session saw a further decline, breaking below the Asian session low. Any subsequent rebound should not be viewed as a bullish trap. Furthermore, based on today's high and low points, 4138 represents the 61.8% Fibonacci retracement level, currently acting as resistance. The best option for the US session is to wait. The next move will likely be a second downward pressure, either stabilizing at 4109 to form a double bottom, or breaking through it to confirm the 4104 annual moving average, or stabilizing at 4097 (50% retracement support) for a bullish move. These two levels also correspond to the short-term 5-day and 10-day support levels on the daily chart. Resistance is at 4138-4140. A break above this level would mean holding above the 10-day moving average, making further declines less likely and potentially pushing higher to test the 4150-4160 high. The key level is 4097. Trading above this level suggests a slightly bullish bias, while trading below it would indicate a weaker bias and a higher likelihood of wide-ranging price swings.
GOLD 4H CHART ROUTE MAP UPDATE & TRADING PLAN FOR THE WEEKHey Everyone,
Please see our updated 4h chart levels and targets for the coming week.
We are seeing price play between two weighted levels with a gap above at 4124 and a gap below at 4042. We will need to see ema5 cross and lock on either weighted level to determine the next range.
We will see levels tested side by side until one of the weighted levels break and lock to confirm direction for the next range.
We will keep the above in mind when taking buys from dips. Our updated levels and weighted levels will allow us to track the movement down and then catch bounces up.
We will continue to buy dips using our support levels taking 20 to 40 pips. As stated before each of our level structures give 20 to 40 pip bounces, which is enough for a nice entry and exit. If you back test the levels we shared every week for the past 24 months, you can see how effectively they were used to trade with or against short/mid term swings and trends.
The swing range give bigger bounces then our weighted levels that's the difference between weighted levels and swing ranges.
BULLISH TARGET
4124
EMA5 CROSS AND LOCK ABOVE 4124 WILL OPEN THE FOLLOWING BULLISH TARGETS
4212
EMA5 CROSS AND LOCK ABOVE 4212 WILL OPEN THE FOLLOWING BULLISH TARGET
4328
EMA5 CROSS AND LOCK ABOVE 4328 WILL OPEN THE FOLLOWING BULLISH TARGET
4422
EMA5 CROSS AND LOCK ABOVE 4422 WILL OPEN THE FOLLOWING BULLISH TARGET
4422
EMA5 CROSS AND LOCK ABOVE 4422 WILL OPEN THE FOLLOWING BULLISH TARGET
4494
BEARISH TARGETS
4042
EMA5 CROSS AND LOCK BELOW 4042WILL OPEN THE FOLLOWING BEARISH TARGET
3964
EMA5 CROSS AND LOCK BELOW 3964 WILL OPEN THE FOLLOWING BEARISH TARGET
3873
EMA5 CROSS AND LOCK BELOW 3873 WILL OPEN THE SWING RANGE
3767
3646
As always, we will keep you all updated with regular updates throughout the week and how we manage the active ideas and setups. Thank you all for your likes, comments and follows, we really appreciate it!
Mr Gold
GoldViewFX

Gold Short-Term Technical Analysis (November 21st)With the release of the hawkish minutes from the Federal Reserve, the US dollar index climbed back above 100, suppressing gold prices. Yesterday, gold rebounded after testing a low near 4055 in the US session, then rallied slightly to around 4110 in the early morning before weakening again. In the Asian session, it broke lower, briefly touching around 4040. During the European session, it fell again, touching 4038 before stabilizing and rebounding. It has repeatedly tested the support around 4040 without breaking it, and is currently fluctuating.
11/22 Gold Short-Term Trading Strategy
Sell gold near 4085, with a stop-loss at 4095, targeting below 4070/60. Buy gold near 4044/5f, with a stop-loss at 4034, targeting 4070/80.

Gold prices fluctuated on November 20th, awaiting the non-farm pThe 1-hour moving average for gold has started to turn upwards, and the overall trend remains one of upward fluctuation. However, the fluctuation is currently biased towards the upper end. Gold has tested the support area of 4050 multiple times in the past two days, and has basically managed to stabilize and continue rising. This indicates that the bulls still have significant support in the 4050-4000 area. If the support area of 4040 is not broken today, then gold can continue to be bought on dips. The road to the north is long, and patience is still required.

Gold pullback on November 19th: Buy on dips!The 1-hour moving average for gold has turned upwards, indicating continued upward momentum. After breaking through and stabilizing above 4100, gold is currently exhibiting a steady upward trend on the 1-hour chart. The 4090 area has formed short-term support, and buying on dips to this level presents a buying opportunity.
Gold: Buy at 4090, stop-loss at 4078, target 4150-4160;
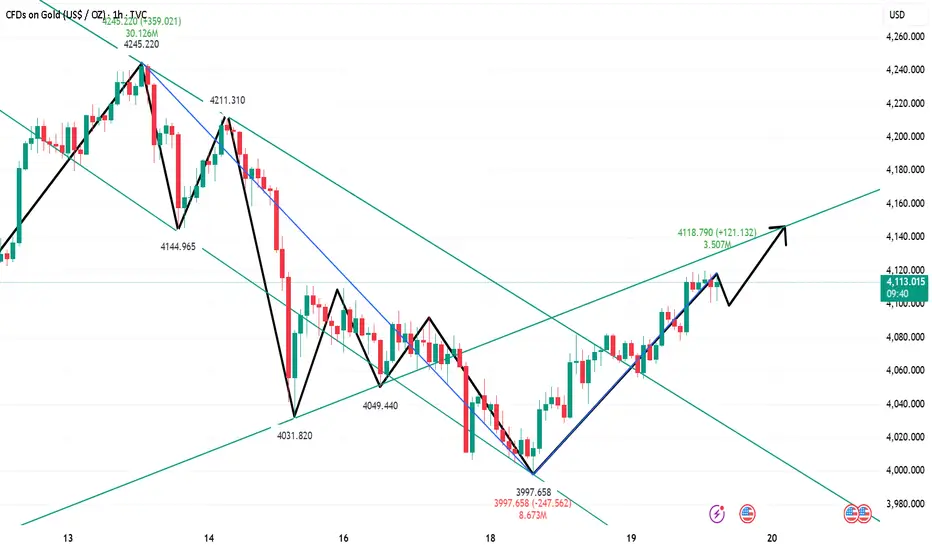
Market Analysis: Gold Price SlidesMarket Analysis: Gold Price Slides
Gold price extended losses below $4,100 before the bulls appeared.
Important Takeaways for Gold Price Analysis Today
- Gold price failed to clear $4,250 and corrected lower against the US Dollar.
- There was a break above a key bearish trend line with resistance at $4,050 on the hourly chart of gold.
Gold Price Technical Analysis
On the hourly chart of Gold, the price was able to climb above $4,200. The price even broke $4,220 before the bears appeared. The price traded toward $4,245 before there was a fresh decline.
There was a move below $4,200 and $4,100. The price settled below the 50-hour simple moving average, and RSI dipped below 40. Finally, it tested the $4,000 handle. A low was formed at $3,997 and the price is now attempting to recover.
There was a break above a key bearish trend line with resistance at $4,050. The price climbed above the 23.6% Fib retracement level of the downward move from the $4,244 swing high to the $3,997 low.
Immediate resistance on the upside is $4,100. The first major hurdle sits at $4,150 and the 61.8% Fib retracement. A close above $4,150 could initiate a recovery wave to $4,185. An upside break above $4,185 could send Gold price toward $4,250. Any more gains may perhaps set the pace for an increase toward $4,320.
If there is no recovery wave, the price could continue to move down. Initial support on the downside is near the $4,050 level. The first key area of interest might be $4,000. If there is a downside break below $4,000, the price might decline further. In the stated case, the price might drop to $3,880.
This article represents the opinion of the Companies operating under the FXOpen brand only. It is not to be construed as an offer, solicitation, or recommendation with respect to products and services provided by the Companies operating under the FXOpen brand, nor is it to be considered financial advice.

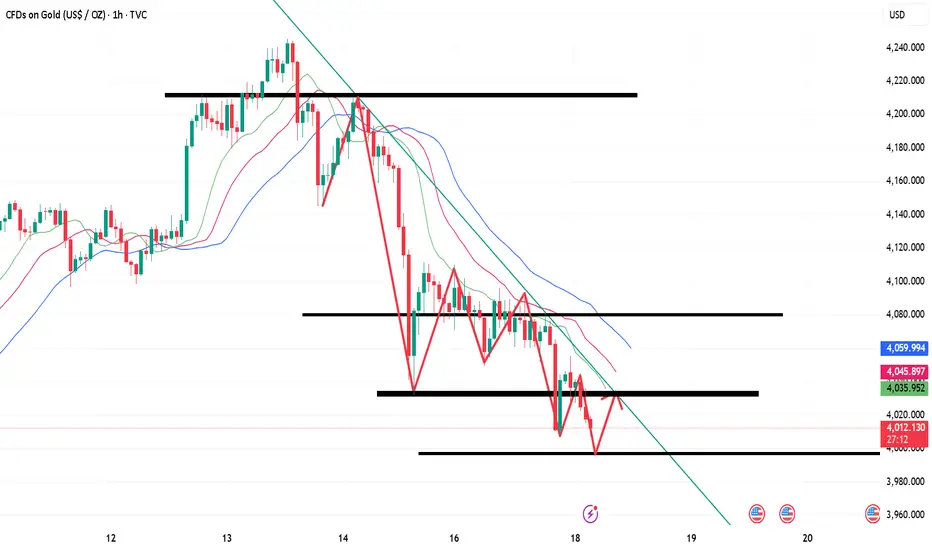
Gold Short-Term Trading Guide (November 18th)!!!The US released some unemployment claims data, and gold briefly broke through 4000 before experiencing a strong rebound. Is this rebound merely a flash in the pan due to the data, or will it help reverse the gold bullish trend?
First, we should note that gold is still generally weak. The 1-hour moving averages are still in a bearish crossover, indicating continued downward momentum. Gold is also still trading within a 1-hour downtrend channel. If gold continues to trade within this channel, the overall trend will likely remain one of oscillating decline. The upper resistance level of the 1-hour downtrend channel has now moved down to around 4068. If gold rallies below 4068, the strategy remains to sell on rallies.
Gold prices naturally fluctuate, just like the tides. Volatility creates opportunities. If gold cannot break through the 4068 level, the rebound may be short-lived. Until a break above 4068 is achieved, continue to sell on rallies.
US Session Trading Strategy:
Sell gold at 4060, stop loss at 4070, target 4000-3980;

Gold pullback on November 18th, expect a rebound.Gold prices are trading around 4015. For short positions, watch the 4050 level; a move to short at this level would be a good entry point. This level represents the low point of the initial upward move at the beginning of the week and has now become effective resistance. Hold this area for shorting. The 8-hour uptrend line provides support around 3993. If the price breaks below this uptrend line, the downtrend could accelerate, potentially reaching as low as 3924. Focus on shorting today; hold short positions below 4053 and prepare to maximize profits! Weak outlook! Specific and more winning entry points will be provided during the trading session! Take profits on the short positions!
#Intraday Strategy: Hold short positions below 4050 and maximize profits! Weak outlook!
Focus on the 3995-4005 range, a key support/resistance level!
Gold is expected to rise and then fall in the short term.After opening today, gold was pressured down by the 4110 area, finding support at around 4050 and rebounding. The 1-hour and 4-hour charts show severe oversold conditions, indicating a clear short-term stabilization. Therefore, overall, while maintaining a bearish outlook for gold, a short-term rebound is likely, with a high probability of further declines.
Key resistance remains at the 4110 area, followed by the 4140-50 area. A sustained bearish stance is warranted; an unexpected upward breakout could extend the rebound, but a decline is still expected. Key support during the European session is at the 4050 area, with the 4030-40 area being a short-term key level. A break below this level would likely lead to further declines towards the 3980-3950 and 3915 areas.