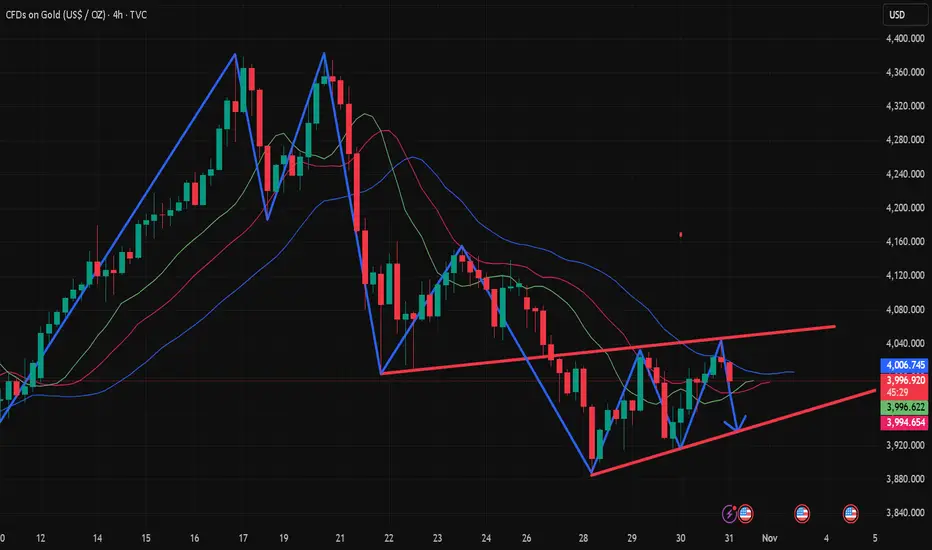
The 11.7 range is narrowing; buy low and sell high.Gold has recently exhibited a typical consolidation pattern. After a brief dip to 3928 at the beginning of the week, it gradually stabilized and rebounded from Wednesday, briefly surging to 4020 yesterday, forming a V-shaped rebound overall, but failing to break out of the large consolidation range of 4060-3915. As time progresses, the range of fluctuation continues to narrow, forming a converging triangle pattern, suggesting the market is at a critical juncture in choosing a direction.
Today's trading should focus on two key price levels: 4020 represents significant short-term resistance, while 3965 is a support level that has been repeatedly tested recently. Strategically, short-term investors can buy low and sell high within the 4020-3965 range.
Goldtrade
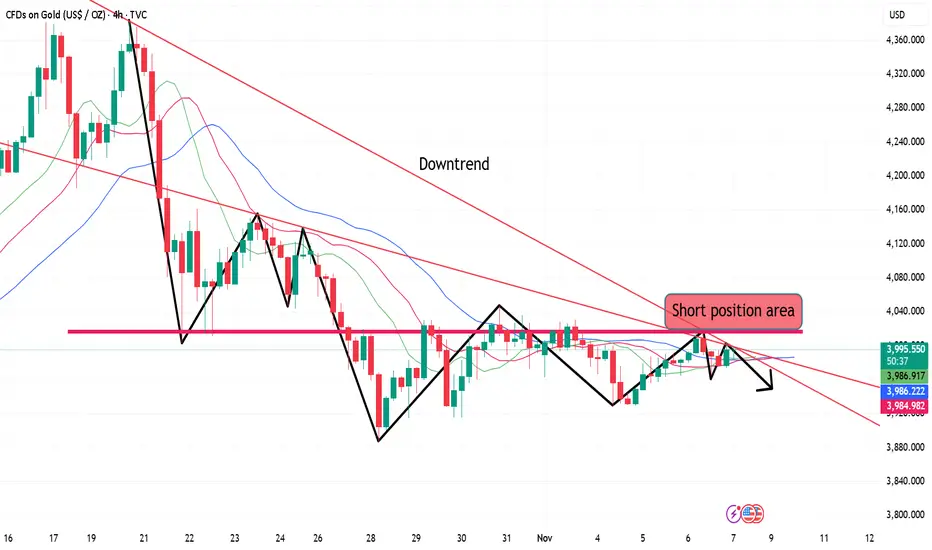
"Short-selling is correct" - Gold consolidation awaits breakout.Gold prices have indeed been somewhat sluggish recently, fluctuating repeatedly within a range. While this volatility can be agonizing, it reflects the market's rhythm. In terms of trading, avoid blindly chasing highs and lows. If you're bearish, don't chase the market down. Patiently wait for a rebound and resistance before entering a position. The recent market rhythm is very clear: sharp rallies are prone to pullbacks, and sharp drops are prone to rebounds – typical characteristics of a range-bound market. Our trading advice remains clear: focus on the 4010-4030 area. If a rebound fails to break through resistance, continue shorting, building positions in batches and proceeding steadily. We have repeatedly emphasized that gold is currently in a range-bound, slightly bearish adjustment phase, with the overall center of gravity continuing to shift downwards. Short-term rallies do not signify a reversal, and so-called signals are often just bull traps. High-level rebounds remain a good opportunity to establish short positions. Market conditions can change rapidly, but there are always patterns to follow. Don't be misled by appearances; look at the underlying logic and structure. Gold is still in a downward continuation phase. Rebounds present opportunities, while false breakouts pose risks. Gold prices fell as expected. Although we exited early and missed the lowest point, a steady exit is a victory in itself. Trading is never about who is more greedy, but about who knows how to control the pace better.

The bears' rhythm is clear, and their direction remains firm!Gold's early morning dip yesterday did not continue, and it even broke through the important resistance level of 3990 during the European session. Today, it broke through the 4000 mark, reaching a high of around 4020, which is the resistance level we predicted earlier. The price has accurately reached the 4020-4030 rebound range, and then quickly fell back to around 3978 and fluctuated. I believe that those who followed the plan have made a steady profit. Judging from the current trend structure, gold is likely to continue its oscillating rebound, but the short-term rebound space is limited. The key resistance area to watch is still 4020-4030. If the rebound fails to break through the resistance, it will still be a good opportunity for short sellers to position themselves. In terms of strategy, we will continue to focus on shorting on rallies, entering positions in batches with small positions, controlling risks, and moving forward steadily. If you've been struggling with your recent trading and want to avoid pitfalls in complex market conditions, feel free to contact me. I'll do my best to help you clarify your thinking and master your own trading rhythm.

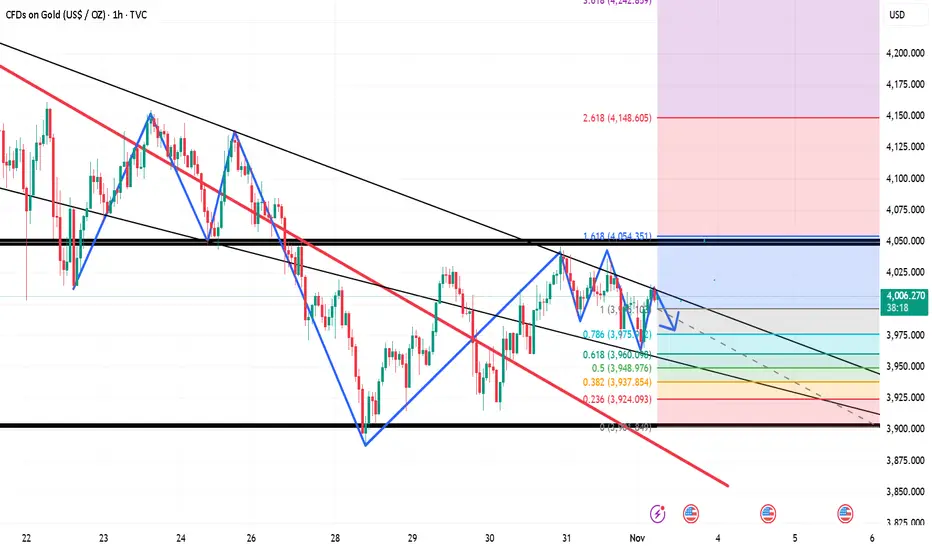
Gold breaks through $4,000, has the bulls returned?You might be surprised if I said gold could continue to decline? But the truth is, I'm not surprised. I see this round of trend very clearly: the break below the 4000 mark was just a brief "acceleration" rather than a true reversal of direction. After the price broke through, it quickly rose to around 4017. This performance is more like an emotional release than a trend reversal. After all, the 4000 level has been breached or recovered many times before. There have been too many short-term fluctuations, and the real significance has already been digested by the market's inertia. I maintain a bearish outlook because the chart structure has reached the testing area of the channel's low point, a key position I have repeatedly emphasized. There are only two possibilities for the trend: either the market will soar upwards and return to the upward channel, or it will begin a new round of decline. What I want to seize is the volatility opportunity in the latter. Looking at the key levels: the highs this week are 4050, 4040, and 4030. If the rebound stops in the 4020-4030 area, then a short-term top has likely appeared. At this point, entering a short position would be extremely cost-effective. As long as the market cannot regain a foothold above 4030, I remain firmly bearish, with targets to watch for a break below 4000 and further down to the 3980-3960 area. I don't strive for perfect predictions, but every move I make must be logical, structured, and valuable. When opportunities arise, do not hesitate or waver; execution is key. Seek victory through stability and do not blindly follow the noise of the market.

Gold prices fell back during the US session on November 5th.From the 4-hour chart, the current short-term resistance levels to watch are 3965-70 and 4020-55. Short-term support is at 3918-20, with a key support level at the previous low of 3888-90. The strategy is to sell on rallies.
Gold Trading Strategy:
1. Sell gold at 3980-70, add to the short position at 4020-25, stop loss at 4039, target 3940-3930.

Gold prices fluctuated upwards on November 3rd, but bulls faced From the 4-hour chart, the current resistance level to watch is 4030-35, with a key resistance level at 4047-55. The short-term support level is 3965-70. The recommended strategy is to primarily sell on rallies, avoiding chasing the market and patiently waiting for key entry points. Specific trading strategies will be provided during trading hours; please pay close attention.
Gold Trading Strategy:
1. Sell gold on rallies to 4030-35, add to the short position on rallies to 4047-55, stop loss at 4069, target 3960-3965, hold if it breaks through.

Gold Intraday Short-Term Analysis and Trading Strategies (NovembGold is currently oscillating between the 61.8% and 78.6% Fibonacci retracement levels (3945-4136), but trading volume remains weak. A further rise followed by a fall back to the 50% Fibonacci retracement level of 3811 cannot be ruled out. Stronger support lies nearby, at the 89-day moving average of 3753. This means the short-term correction is not yet over. Today, the key resistance level to watch is 4060-70, with a smaller resistance level at 4020.
Intraday Short-Term Trading Strategy:
Primarily sell on rallies, with buying on dips as a secondary strategy. Support levels to watch are 3979, 3936, and 3882.
October 31st, Golden Week Holiday, Monthly Closing DateFrom the 4-hour chart, the current short-term resistance level to watch is 4030-35, with a key resistance level at 4047-55. Short-term support is at 3965-70. For overnight trading, focus on range trading; avoid chasing the market and wait patiently for key entry points. Specific trading strategies will be provided during trading hours, so please pay close attention.
Gold Trading Strategy:
1. Sell gold at 4030-35, add to the short position at 4047-55, stop loss at 4069, target 3970-3965.
US session short-term trading strategy guidance at 10:30!From a 4-hour chart perspective, the current short-term resistance level to watch is 3978-85, with a key resistance level at 4047-55. Short-term support is at 3915-20. Trading should focus on range trading; avoid chasing the market and patiently wait for key entry points.
Gold Trading Strategy:
1. Sell gold at 3978-3985, stop loss at 4009, target 3880-3895, hold if it breaks through;
2. Buy gold at 3915-20, stop loss at 3896, target 3977-85, hold if it breaks through.
‘10.29 Buy first below 3900 and then sell!Technical Analysis:
The first resistance area above is 3960-70. Maintain a short position below this level. If the market unexpectedly breaks higher, focus on the 3995-4005 area, which remains bearish. If the market weakens, the 3945-50 area, previously the starting point for the rally, has become a source of pressure after breaking below it today.
Key support areas below are the 20-day moving average (SMA) at 3865-70 and the 50% level at 3840-45.
Trading strategy: Maintain a short position on rebounds.
Participate in the 3960-70 area, targeting a new low. After a new low, consider entering long positions based on the 20-day moving average and the 50% level.
Gold finds support in the short term, target is 3950Gold has found support at 3886. A short-term rebound is expected around 3950-55. At this level, you can switch to short positions, with a focus on 3965. If it breaks through 3973 and breaks above the support level in the Asian session, abandon your short position and switch to a full long position. In the short term, we're looking for a rebound around 3950-55. Here, you can short, but be mindful of the risk.
October 28th Gold US Trading Strategy:
1. Buy around 3900-3910, stop loss at 3886, take profit at 3940-50.
2. Short around 3950, stop loss at 3965, take profit at 3910.

GOLD (XAU/USD) – 15-Minute Chart AnalysisCurrent Price: 4006.53
Trend: Short-term bearish
🔍 Chart Breakdown
The price is moving within a descending channel, indicating a continuation of the bearish momentum.
There is a key resistance zone around 4035–4060, highlighted in the shaded area. This zone aligns with previous structure and upper trendline resistance.
The market is currently making a minor pullback toward this resistance area after touching the lower boundary of the descending channel.
📉 Expected Move
The purple projection suggests a pullback to the resistance zone, followed by a strong rejection downward.
The target level is set around 3920.72, which corresponds to a previous swing low and a possible completion of the bearish wave.
⚙️ Trading Outlook
Direction Entry Zone Stop Loss Take Profit Confirmation
Sell 4035–4060 4075 3920 Rejection candle or bearish engulfing at resistance
📊 Summary
Gold remains in a short-term downtrend, and the best opportunity is to wait for price to test resistance (4035–4060) before considering short positions targeting 3920.
A breakout above 4075 would invalidate this bearish setup and could signal a potential trend reversal. LME:CA1! LME:MC1! LME:SN1! LME:LH1! LME:SC1! LME:AH1! LME:CO1! LME:ZS1! LME:PB1! LME:HC1! LME:AA1! LME:EA1! LME:ST1! LME:AN1! LME:AW1!

10.28 Gold continues to fall to 3970For the day, we will focus on the support at 3970. If it falls below, the price will continue to fall to 3950-3900-3850. In the short term, we will focus on the 4020 line and the resistance near 4060. After breaking through 4020, the price will continue to rebound and test the 4050-4060 line. However, the main strategy for the day is still to go short.
Strategy:
Go short near 4006-4010, defend 4021, and target 3970-3940-3900-3850
The second short position above is near 4054-4060, and the target position remains unchanged.
As for the long position below, it is at 3895 and 3870.

Gold shorts are coming, rebound under pressure and short sellGold hit resistance twice today and broke new lows again. Currently, the market is fluctuating at a low level, with resistance levels decreasing and the lows falling. The overall trend remains weak. Previous support at 4047-55 has become resistance. Focus on the downside: last week's lows of 4000-4004. The 4000 level will be the first barrier for bears to break through. Key resistance from above remains around the 4047-55 level we identified earlier.
Technical Analysis:
From the 4-hour market trend, short-term resistance at 4047-55 is currently under pressure. Gold is struggling to break through this resistance. Trading strategies should prioritize shorting on rebounds. In the intermediate range, be cautious and watchful, and wait patiently for key entry points.

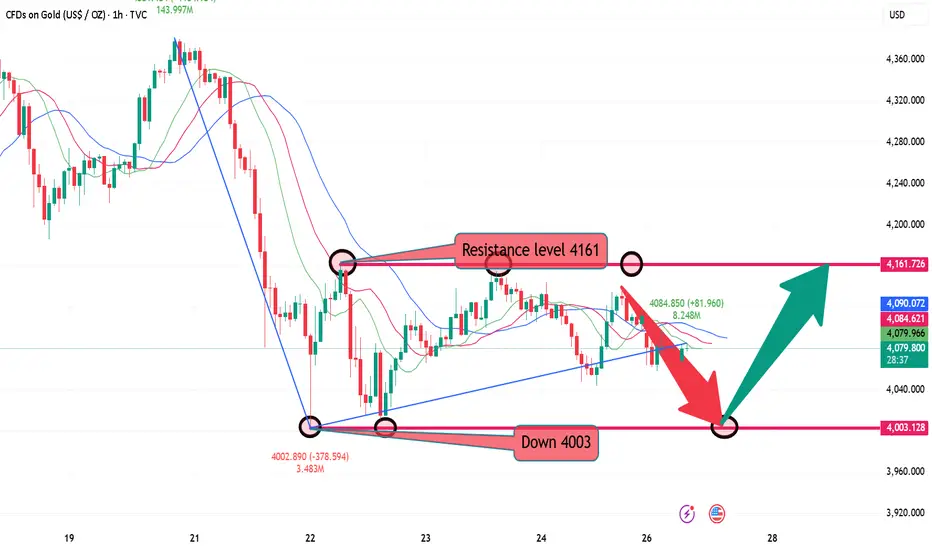
Gold continues to maintain the oscillation range of 03-60Gold's potential correction from its highs lies between 4003 and 4161, with room for a significant correction of 160 pips. Gold plummeted during today's Asian and European trading sessions, leaving a clear resistance level. We should focus on the minor resistance level of 4097. If it fails to hold above, bears will continue their decline and seek deeper support. Shorts should avoid candlestick charts near 4003. A break below the bottom of the oscillation this week could lead to a deeper correction for bears.
Resistance levels are 4097 and 4035, while support levels are 4065 and 4045. The dividing line between strength and weakness is 4097.
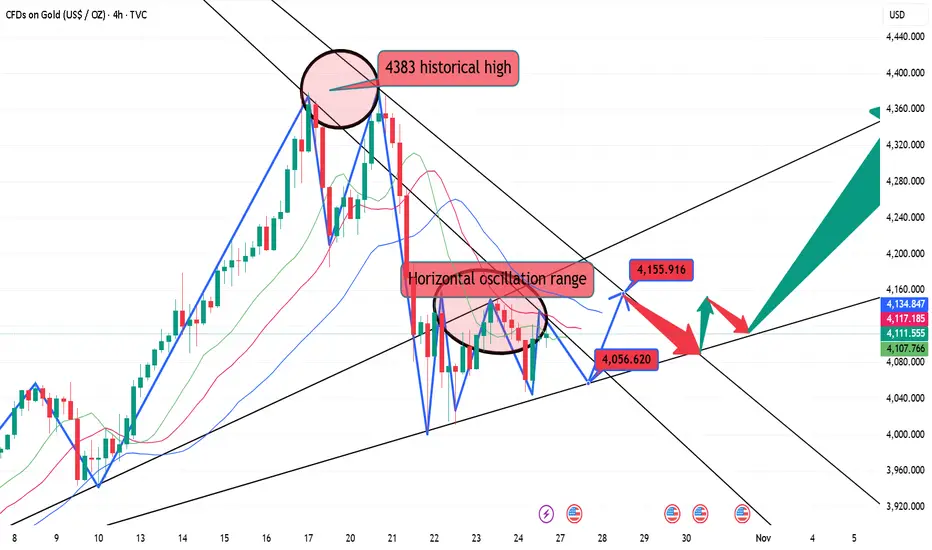
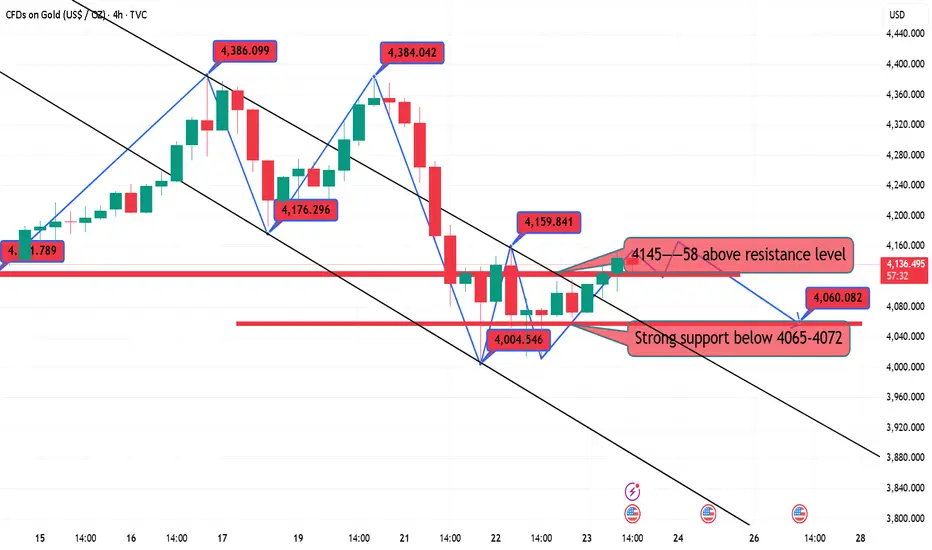
Gold daily K-line stopped falling, and the slow bull correction On Friday, the market corrected for 2 hours, finding support near 4045 on the lower 2-hour band, before retracing upwards. Next week, tomorrow, the 3-hour correction will gradually begin. Currently, the 3-hour BOLL is moving sideways, further oscillating within the range. Once the 3-hour correction concludes, the 4-, 6-, 8-, and 12-hour bands will begin to correct. Ultimately, the next bullish and bearish trend will unfold during this 4- to 12-hour correction.
On Monday, we'll initially focus on the 3-hour BOLL band range. Currently, the range is between 4155 and 4050. Within this range, the market will continue to fluctuate, with buy low and sell high being the primary strategy. Therefore, a buy low, sell high strategy within the 4155-=4050 range should be sufficient.
Technical Analysis:
1: The 3-hour correction is evident, with the BOLL range moving sideways, within the 4050-4155 range. Buy low, sell high is a viable strategy within this range.
2: The 4-hour Stochastic and MACD lines are both blunting, indicating a temporary sideways trend. The central axis of pressure is near 4145 .
3: In the daily K-line chart, the Stochastic is blunting and moving downward, signaling a bearish bias. The MACD is initially forming a death cross and moving downward, signaling a bearish bias. However, the central axis of the daily K-line is holding support, currently moving up to around 4085, followed by support around 4000.
Overall, the technical outlook suggests a range-bound trend within the 3-hour chart, followed by a gradual upward trend within the 4-hour chart, followed by a volatile upward trend within the daily K-line. This is the corresponding signal of the current market; but the specific approach is mainly to wait and see and respond as needed!
10.24 US market technical analysis!!!Gold hourly level: It stabilized and rebounded at 4105 overnight, and fell again in Asian session today, only rebounded from a double bottom at 4105 to 4144, and the price re-stood on the 66-day key moving average, because the Japanese and US sessions suppressed this moving average and fluctuated downward all the way; then after the positive line closed and broke through it, it was thought that if it held 4105, it could continue an upward trend. As a result, it consolidated for several hours and broke below 4100 in the afternoon, triggering a wave of decline, and hit the trend line of 4044 at the lowest, and got a certain rebound effect. After breaking through 4100, we will see the bullish trend, and the key support lies at 4150-4160.
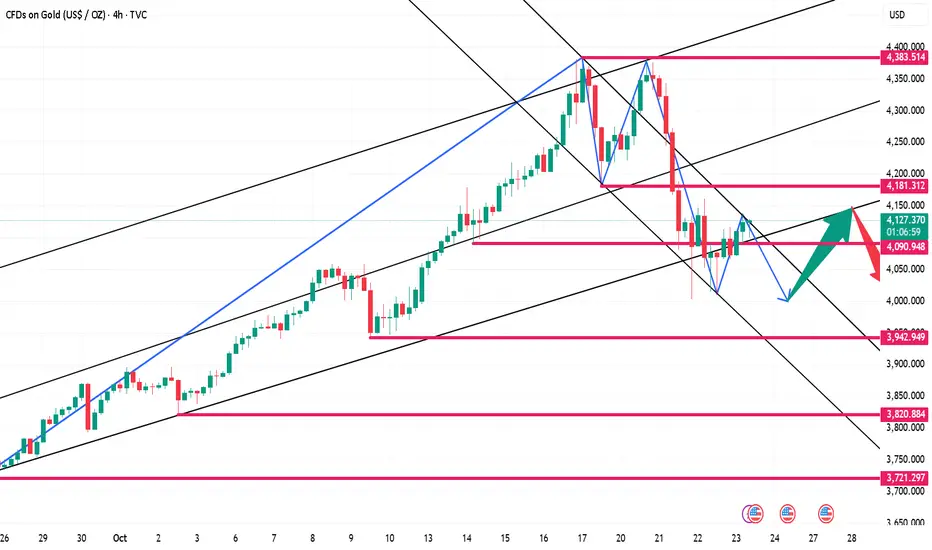
10.24 Gold US Trading Strategy, Bulls Bottom Out and Rebound as Looking at the 4-hour market trend, the current short-term resistance level at 4142-50 is being monitored on the upside, while the short-term support level at 4065-4070 is being monitored on the downside. Gold is under pressure and difficult to break through. For trading, the primary strategy is to go long on pullbacks. In the middle, be cautious and follow orders carefully, patiently waiting for key entry points. I will provide detailed trading strategies during the trading session, so please stay tuned.
Gold Trading Strategy:
1. If gold rebounds and doesn't break through the 4145-52 level, go short. Set a stop-loss at 4160, and target the 4015-4000 level. Hold if it breaks through!
2. If gold retraces to the 4085-93 level, go long. Set a stop-loss at 4073, and target the 4130-35 level. Hold if it breaks through!
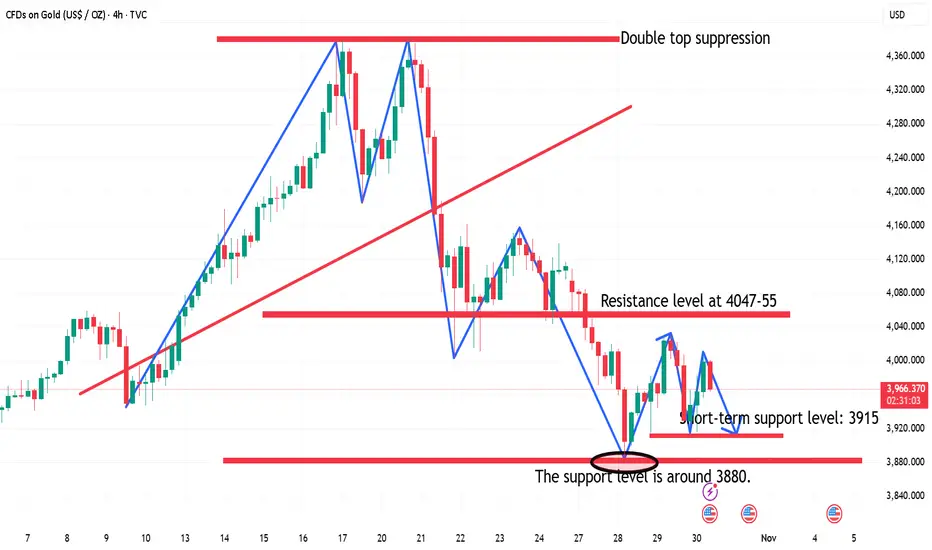
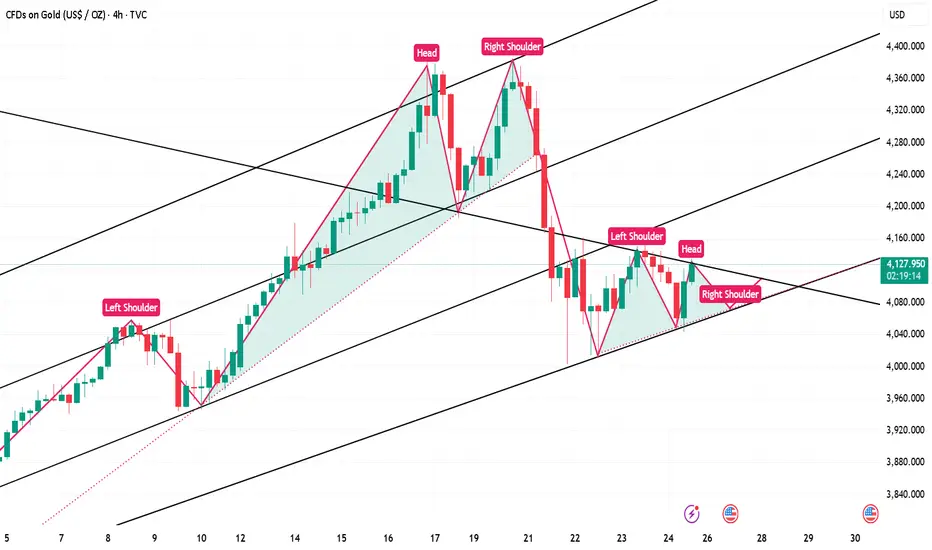
10.23 Gold Intraday Short-Term Technical Guide!!!From a big-picture perspective, gold should continue its upward trend as real interest rates are expected to continue to decline as the Fed's policy turns dovish. However, in the short term, a re-adjustment of interest rate expectations could trigger a further correction.
Technical Analysis:
On the 4-hour chart, gold prices have broken below the neckline of the double top pattern, strengthening bearish momentum. The neckline will now become a new resistance level, where bears may position themselves, with stops set above resistance, aiming for a further break below the trendline. Bulls, on the other hand, would like to see gold prices re-break through the neckline, thereby negating the bearish pattern and pushing prices back to higher levels.
Gold goes on a roller coaster ride. Continue to short below 4100Looking back at the price of gold since the beginning of the year, it has risen by over 50%, with an increase of over 25% in just two months. Those who bought in early on have made a killing, and at the first sign of trouble, they naturally want to sell to lock in profits. This concentrated sell-off can easily trigger panic. Leveraged margin calls exacerbate volatility: The recent surge has attracted many investors to leverage their positions. If prices fall rapidly, these leveraged positions will be forced to close, amplifying the decline like dominoes.
Returning to the one-hour gold chart, US gold will continue to fluctuate between 4100 and 4020. The current trend is volatile and weak, so adopt a high-sell strategy! Go short on a dip to 4080, with an eye on the 4000 area below!
Specific Strategy
Sell gold below 4100, stop loss at 4110, target 4000.

10.22 Gold rebounds and continues to be shortGold's 4-hour moving average has formed a death cross, signaling a downward bearish trend. Gold still has downward momentum. Despite today's rebound in the US market, it continued to decline rapidly. This suggests the bullish rally is weakening. Gold rebounded to around 4085 before turning downward. While gold remains under pressure at 4085, it's still a good time to continue shorting.
Gold has formed a short-term bearish double top, and the bullish rebound has failed to re-stabilize the neckline of the double top. Gold remains a bearish market, and rebounds continue to offer opportunities for short sellers.

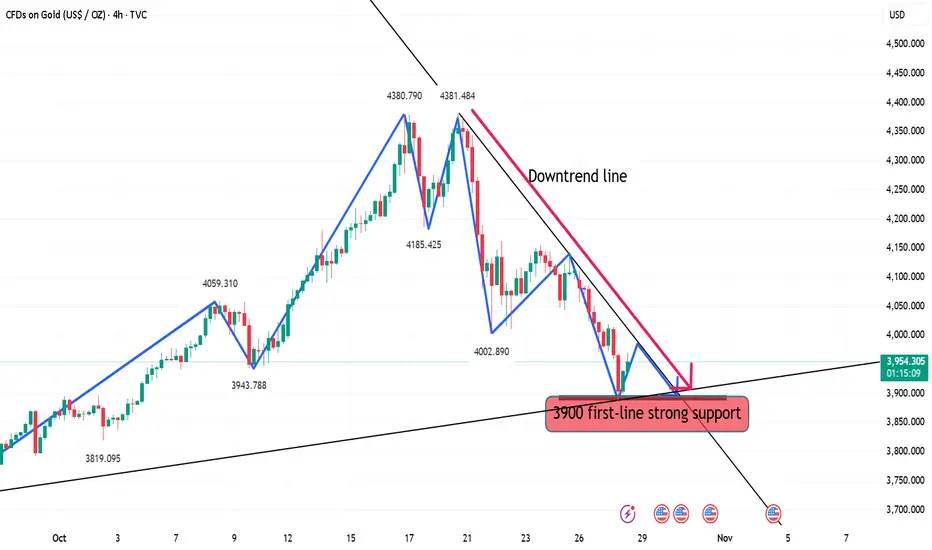
Gold mania ends in a $4000 reality check? Thousands queuing for hours in central Sydney to buy gold last week was a potential warning sign that gold was vulnerable to correction.
Today, gold prices saw their largest one-day fall in over ten years. After several failed attempts to break above 4,400, resistance held and momentum reversed sharply.
The first key support now potentially sits near 4,000 (200% retracement).
Despite the correction, long-term outlooks might remain positive. Ongoing inflation risk, lower interest rates, geopolitical tensions, and U.S. government dysfunction are still ever present. This might be why Goldman Sachs raised its December 2026 price target to 4,900 per ounce, up from 4,300, citing
Silver also slumped more than 7%, marking their biggest daily loss since 2021, as overbought signals flashed extremes.

Gold Price Reaches Record HighGold Price Reaches Record High
As shown in the charts, XAU/USD quotations have reached historic peaks today. According to media reports, gold is behaving as a safe haven amid growing uncertainty, which is intensifying as the U.S. government shutdown continues. Meanwhile:
→ Gold prices may rise above $3,950 in the coming days, approaching the psychological level of $4,000. The chart underlines the firm dominance of demand forces.
Technical Analysis of the XAU/USD Chart
Analysing gold price fluctuations suggests the formation of an ascending channel, which has remained relevant since mid-last month.
On 30 September (when the price formed peak A) we noted that:
→ the sharp drop from peak A indicated bear confidence;
→ the price might correct towards $3,800, as bulls were exhausted, requiring another consolidation period to resume upward movement and form a “bull flag” pattern.
Indeed, the price soon tested the $3,800 level (shown by the arrow), after which bulls regained strength. However, a new “bull flag” did not form; instead, three peaks of a “head and shoulders” pattern (A–B–C) emerged, which did not lead to a reversal. This failed bearish pattern emphasised the bulls’ strength in today’s gold market.
From a bullish perspective, the price confidently broke above $3,900, where a local resistance line (shown in red) and the ascending channel’s median lie.
On the other hand, the price has approached the upper boundary of the channel, and the RSI indicator is already in the overbought zone.
If sentiment does not shift significantly, bulls’ attempt to reach the psychological level of $3,950 could make XAU/USD more vulnerable to a pullback – in which case the channel’s median could become the nearest target for sellers.
This article represents the opinion of the Companies operating under the FXOpen brand only. It is not to be construed as an offer, solicitation, or recommendation with respect to products and services provided by the Companies operating under the FXOpen brand, nor is it to be considered financial advice.
