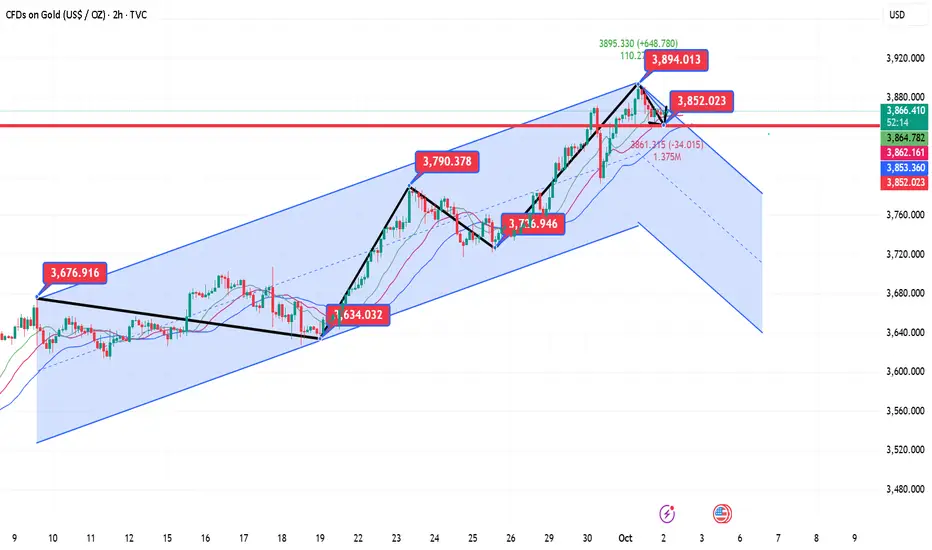
9.2 Gold Short-Term Technical Analysis Guide!!!Gold prices naturally retreated after hitting a new high on Wednesday, but the candlestick chart remains oscillating upward (with higher lows). If prices fall below the midline of the trend channel at 3869, the market is likely to shift towards the 3850-35 range. Currently, gold prices are showing this trend. Conservative investors can consider entering the market based on whether the 3834/35 support levels are broken (a rebound could reach as high as 50; if it falls below, the market is bearish and could reach 3810).
Reference support levels: 3849, 3834, and 3794.
Reference resistance levels: 3880, 3903, and 3917.
Goldtrading
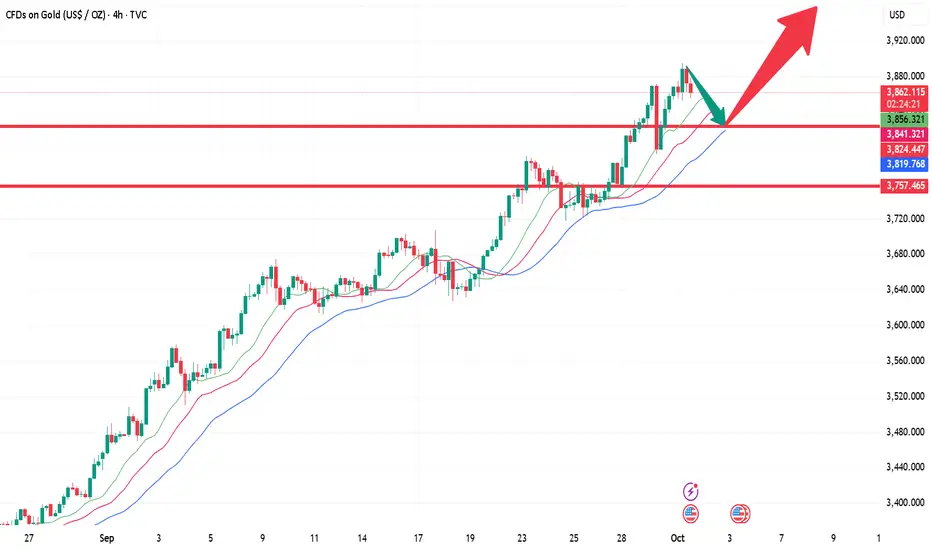
Can gold smash through $4,000 this month?Gold is edging closer to the psychological $4,000 mark after reaching as high as $3,890 per ounce.
The rally has been fuelled by two main drivers: an unexpected drop in US private employment and the start of the federal government shutdown. With the shutdown delaying key releases such as this week’s nonfarm payrolls and this month’s CPI, the Federal Reserve may be forced to decide policy at its October 29 meeting without critical data, increasing the chances they leave rates unchanged.
Technically, gold’s trend remains constructive. Strong demand zones potentially sit near $3,760 and $3,720, while the next key resistance is the $4,000 psychological level. A sustained daily close above $4,000 would open the way toward Fibonacci extension targets at $4,025 and $4,101. On the downside, a break below $3,760 could trigger a deeper pullback toward $3,680.

Gold Market Analysis – Sell Opportunity Emerging in XAU/USDGold has been climbing with strong momentum, but the current leg is showing signs of transition. After a period of consolidation, the market expanded upward, taking liquidity from previous highs and creating an extended run. This behavior often reflects the final stage of a bullish cycle before rebalancing begins.
What stands out now is the engineered path of price: a push into untested liquidity zones above, followed by a potential shift as large players unwind positions. Once liquidity is collected at the extremes, price tends to rotate back into inefficiencies left behind during the rapid climb.
This suggests gold is not simply trending higher, but moving through a liquidity cycle. The near-term structure favors a sweep of higher levels, then a corrective phase where price retraces to refill imbalances and reset order flow for the next directional move.

GOLD WEEKLY CHART MID/LONG TERM ROUTE MAP UPDATEWeekly Chart Update – Follow Up
3732 Hit & Closed Above, 3806 Gap Opens – Now Completed
Previously we highlighted 3732 as the breakout target after confirming strength above 3659. That level was successfully achieved, and now we’ve gone a step further: 3806 has officially been HIT, completing this weekly chart idea.
This also means all of our multi-timeframe chart ideas have now completed, a full sequence cycle from setup to fulfilment.
Interim Outlook
We’ll share some interim analysis tomorrow to guide through the remainder of this week. On Sunday, a brand-new multi-timeframe analysis will be prepared and shared, laying the foundation for the weeks and months ahead.
In the meantime, if we see any corrections back into the existing chart idea range, the outlined levels remain valid for structure and range management.
Current Outlook
🔹 3806 Range Gap Completed
The final upside expansion objective has now been fulfilled, completing the cycle.
🔹 Correctional Supports – 3659 & 3576
Any detachment below raises correctional risk. 3659 and 3576 (Goldturn) remain critical support zones, with the channel top confluence offering a potential bounce zone.
Updated Levels to Watch
📉 Supports – 3659 & 3576 (correctional zones), deeper floor at 3482
📈 Resistance – 3806 (completed), awaiting new upside mapping in upcoming analysis
Plan
The bullish structure has completed its full range cycle into 3806. From here, corrections into support zones would be healthy resets, while we prepare to track fresh setups in the next multi-timeframe framework.
Flexibility with structure and levels remains key as we transition into the next phase.
Mr Gold
GoldViewFX

10.1 Gold US Trading StrategyJudging from the 4-hour market trend, the bulls closed with a positive sign and fluctuated at a high level. The short-term support below is 3814-25, and the important support is 3800-08. The bulls are rising strongly and there is no top. The operation is mainly to go long on pullbacks. In the middle position, watch more and do less, be cautious in chasing orders, and wait patiently for key points to enter the market.
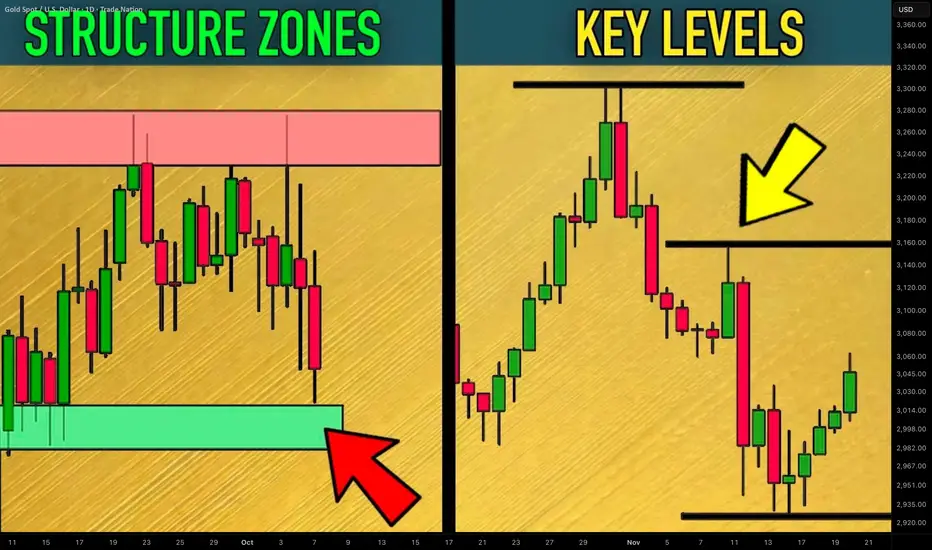
How to Find Key Levels and Support/Resistance Zones Gold XAUUSD
Key levels and support/resistance zones are 2 essential concepts for profitable trading Gold.
In this article, I will share with you a simple and a proven way to find levels and supply/demand clusters on XAUUSD chart.
I will provide a complete guide with examples.
Always start levels/zones analysis on Gold with key levels identification.
Simply put, a key level is a completion point of a strong bullish or bearish movement.
It is the highest high of a bullish wave and the lowest low of a bearish wave.
Let's take a price action on Gold for the last month and let's try to identify key levels.
Analyzing peeks and bottoms of significant price movements, I managed to quickly find a bunch of important key levels.
The ones that are below current spot prices will be called key support levels, while the ones that are above current prices will be called key resistance levels.
What many traders miss, analyzing key levels, is that every key level will always be a part of support/resistance zones.
Candle closes of highs and lows of important price movement will also be important levels.
I underlined all such levels on our Gold chart.
These levels and highs/lows of the impulses will compose supply and demand zones.
That is how these zones look.
The areas that are based on key supports will be called demand zones.
The areas that are based on key resistances will be called supply zones.
The logic is that a high volume of selling orders will be distributed within supply clusters.
Probabilities will be high that a bearish reaction will follow after a test of such a zone.
Demand zones will accumulate buying orders and buying activity.
With a high probability, Gold price will bounce from such zones.
Levels and zones analysis will provide you with a map for trading Gold.
Use that as a map that 95% of retail traders will not see.
It will help you find profitable trades.
❤️Please, support my work with like, thank you!❤️
I am part of Trade Nation's Influencer program and receive a monthly fee for using their TradingView charts in my analysis.
Gold Futures Bullish Setup – Entry at Demand Zone1. Channel Formation
The price is moving inside a rising parallel channel (blue lines).
Recently, the price broke below the midline (dashed blue) of the channel, indicating short-term weakness.
2. Trade Setup: Long (Buy) Position
The chart indicates a bullish outlook, expecting a price reversal from the demand zone.
🔹 Entry Zone
Entry Price: ₹116,251 – ₹116,277
This is marked with a grey zone, which aligns with a support area and previous consolidation.
🔻 Stop Loss (SL)
Stop Loss Price: ₹115,705 – ₹115,729
Placed just below the lower boundary of the support zone to protect against a false breakout.
🎯 Target (TP)
Target Price: ₹119,331 – ₹119,338 (LABA target point)
This lies above recent highs and near the upper boundary of the channel, suggesting continuation of the bullish trend.
3. Risk-Reward Ratio
The blue shaded box indicates a reward zone.
The trade has a favorable Risk-Reward Ratio (RRR) > 2:1, which is considered a strong setup.
🧠 Interpretation & Strategy
The red curved arrow indicates expected price action: a short-term pullback into the demand zone, followed by a bullish bounce toward the target.
The structure suggests a buy-the-dip opportunity within an ongoing uptrend.
⚠️ Key Takeaways
Component Value (INR)
Entry Zone 116,251 – 116,277
Stop Loss 115,705 – 115,729
Target 119,331 – 119,338
Trend Bullish inside channel
Risk/Reward Favorable (>2:1)
✅ Conclusion
This setup represents a bullish continuation pattern. If price revisits the highlighted demand/support zone, and forms bullish reversal candles (e.g., hammer, bullish engulfing), it could offer a high-probability long entry toward the upper end of the channel near ₹119,338.

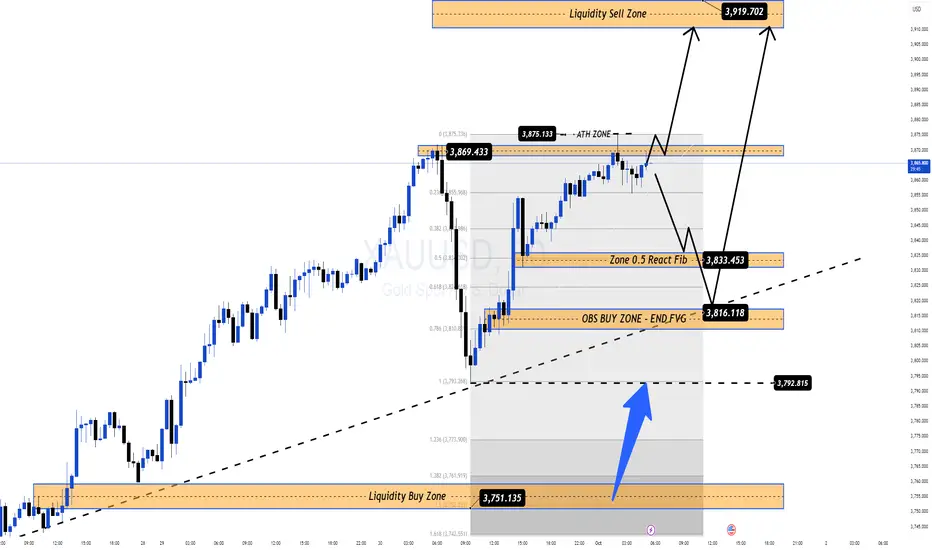
US Government Shutdown Boosts Gold, FOMO BUY Momentum Continues🚀 XAUUSD – Daily Trading Plan| MMFLOW TRADING
📊 Market Context
Gold kicks off Q4/2025 with strong bullish sentiment as safe-haven flows continue to dominate. The shock of a US government shutdown has sparked fresh concerns, driving investors to accelerate their demand for gold as the ultimate hedge.
Adding to the momentum, the potential delay in the NFP jobs report this week leaves markets “thirsty” for guidance, putting gold in the spotlight. Meanwhile, the US Dollar remains under pressure from political instability and expectations that the Fed may lean closer to further rate cuts.
Together, this backdrop highlights gold’s resilience after its explosive rally and points to further upside potential as safe-haven inflows and FOMO buying pressure continue to fuel the trend.
🔎 Technical Analysis (H1/H4)
Price remains within the main bullish structure, holding above key supports.
Primary BUY Zone: 3833–3831 (Fib + CP zone), strong reaction expected.
Secondary BUY Zone: 3817–3815 (OBS zone), deeper support, ideal for additional long entries.
Liquidity Sell Zone 3919–3923: A potential liquidity trap area to watch.
🔑 Key Technical Levels
BUY Zones: 3833–3831, 3817–3815
SELL Zone (watch carefully): 3919–3923
Key Levels: 3800, 3855, 3880
📈 Trading Scenarios & Plan
✅ BUY ZONE 1: 3833–3831
SL: 3827
TP: 3838 - 3842 - 3846 - 3850 - 3855 - 3860 - 3870 - ???
✅ BUY ZONE 2: 3817–3815
SL: 3810
TP: 3822 - 3826 - 3830 - 3835 - 3840 - 3850 - 3860 - 3870 - ???
⚠️ Risk Management Notes
A US government shutdown may trigger unexpected volatility, especially with the NFP delay.
Enter longs only with price action confirmation at support zones.
Avoid chasing highs – patience is key, wait for pullbacks into BUY zones.
✅ Summary
Gold is directly benefiting from political turmoil and delayed US economic data. The main bias remains BUY with safe-haven inflows, focusing on 3833–3831 and 3817–3815 as strategic zones. Targets expand toward 3870–3880 and potentially above 3920 if bullish momentum holds strong.
📢 Follow MMFLOW TRADING for real-time updates and early access to BIGWIN setups!
GOLD 4H CHART ROUTE MAP UPDATEHey Everyone,
Another PIPTASTIC day on the charts with our 4H chart also playing out as analysed.
Yesterday we completed our 1H chart idea and today we complete our 4H chart idea. After completing 3778 target, we had ema5 cross and lock gaps open above at 3811 and 3845 - Both of these gaps are now hit complecting this chart idea.
BULLISH TARGET
3696 - DONE
EMA5 CROSS AND LOCK ABOVE 3696 WILL OPEN THE FOLLOWING BULLISH TARGETS
3738 - DONE
EMA5 CROSS AND LOCK ABOVE 3738 WILL OPEN THE FOLLOWING BULLISH TARGET
3778 - DONE
EMA5 CROSS AND LOCK ABOVE 3778 WILL OPEN THE FOLLOWING BULLISH TARGET
3811 - - DONE
EMA5 CROSS AND LOCK ABOVE 3811 WILL OPEN THE FOLLOWING BULLISH TARGET
3845 - DONE
As always, we will keep you all updated with regular updates throughout the week and how we manage the active ideas and setups. Thank you all for your likes, comments and follows, we really appreciate it!
Mr Gold
GoldViewFX

GOLD (XAUUSD): Updated Support & Resistance Analysis
Here is my latest structure analysis for Gold.
Horizontal Structures
Support 1: 3767 - 3793 area
Support 2: 3690 - 3736 area
Support 3: 3613 - 3644 area
Support 4: 3560 - 3580 area
Resistance 1: 3898 - 3902 area
Vertical Structures
Vertical Support 1: Rising trend line
Support 1 and Vertical Support 1 will compose an important contracting demand zone.
There will be a high chance to see a bullish movement from that.
❤️Please, support my work with like, thank you!❤️
I am part of Trade Nation's Influencer program and receive a monthly fee for using their TradingView charts in my analysis.

Gold Prices Plunge from Historic PeakGold Prices Plunge from Historic Peak
As shown by the XAU/USD chart, yesterday gold prices reached a new all-time high, surpassing the $3,870 level for the first time. This rise was supported by concerns over the high likelihood of a US government shutdown.
According to media reports:
→ Vice President J.D. Vance stated that the US is heading towards a government shutdown, blaming the Democrats.
→ “We have very large disagreements,” said Senate Minority Leader Chuck Schumer.
Fears over the potential impact of a shutdown boosted demand for safe-haven assets, including gold. However, today XAU/USD has dropped sharply. What might this mean?
Technical Analysis of the XAU/USD Chart
In our previous analysis of gold prices, we drew an ascending channel, which remains intact.
Within the context of this channel, it is worth noting that each time the price exceeds its upper boundary, this tends to trigger a correction, a consequence of the market being overbought (in most cases confirmed by the RSI indicator).
Yesterday, during heightened activity in the US trading session, gold prices moved significantly above the upper boundary of the channel, leaving the market vulnerable to a correction. For this reason, today’s decline during the European session can be explained by traders reassessing risks, as well as profit-taking after a rise of more than 11% since the start of the month.
Note the speed of the decline — it indicates strong conviction among the bears. Overall, yesterday’s rise combined with today’s sharp fall can be interpreted as a bearish engulfing pattern. This strengthens the case for a deeper correction towards the psychological $3,800 level, where the median of the channel lies (possible support levels are marked in purple).
Therefore, it is possible that bulls exhausted their momentum yesterday, and for an upward trend to resume, another consolidation period with the formation of a “bull flag” pattern may be required.
This article represents the opinion of the Companies operating under the FXOpen brand only. It is not to be construed as an offer, solicitation, or recommendation with respect to products and services provided by the Companies operating under the FXOpen brand, nor is it to be considered financial advice.

Gold 09/30 |Safe-haven flows surge | Gold sails toward new highs🟡 XAU/USD – 30/09 | Captain Vincent ⚓
🔎 Captain’s Log – Context & News
US Politics : Meeting between Trump and bipartisan leaders ended without agreement → growing risk of a US government shutdown by Wednesday.
Conflict : Democrats demand concessions, Republicans fiercely oppose → wide gap remains, both sides blaming each other.
Market : Investors watch JOLTS data and speeches from 3 FED members, but political risks are the strongest catalyst for Gold.
Trend : Safe-haven flows keep pouring into Gold → increasing likelihood of testing new ATH.
⏩ Captain’s Summary : US political seas are stormy, Gold becomes the fortress of safety. The voyage toward ATH is widening.
📈 Captain’s Chart – Technical Analysis (H1)
EMA : EMA 34 (yellow) > EMA 89 (red) → bullish trend clearly dominant.
Golden Harbor (Support / Buy Zone)
Near FVG: 3,856
FVG Scalping: 3,842
Big Volume Dock: 3,827
Storm Breaker (Resistance / Sell Zone)
ATH test: 3,916 – 3,917
Market Structure : Gold broke out strongly, now trading around 3,870. Main trend remains bullish, with 3,842 – 3,827 as key anchor zones.
🎯 Captain’s Map – Trade Plan
✅ Buy (main priority)
Buy Zone 1 – Scalping FVG
Entry: 3,842 – 3,844
SL: 3,835
TP: 3,846 – 3,849 – 3,852 – 3,859 – 3,8xx
Buy Zone 2 – Big Volume
Entry: 3,827 – 3,824
SL: 3,815
TP: 3,870 – 3,899 – 3,916
⚡ Sell (short scalp – high risk)
Sell Zone – ATH test
Entry: 3,917 – 3,920
SL: 3,925
TP: 3,899 – 3,870 – 3,856
⚓ Captain’s Note
“The Golden sails are filled by safe-haven winds, pushing the ship close to ATH. Golden Harbor 🏝️ (3,842 – 3,827) is the ideal dock for sailors to position Buys. Storm Breaker 🌊 (3,916 – 3,920) may unleash violent waves, suitable only for short Quick Boarding 🚤 scalps. If the political storm from Washington breaks out, Gold’s voyage could surpass the peak and expand its horizon.”
📢 If you find the Captain’s Log useful, don’t forget to Follow for the earliest updates.
💬 What’s your view, crew? Will Gold conquer ATH around 3,917 this week?

No Room for SELL, Only BUY with Strong Market Flows📊 Market Context
Talks between Trump and US congressional leaders ended with no clear agreement, leaving the threat of a US government shutdown hanging over the market. Both sides continue to blame each other with no common ground in sight.
On the last trading day of the month, focus shifts to the upcoming JOLTS job openings data and speeches from three Fed officials. Combined with political uncertainty and strong safe-haven flows, gold remains heavily supported. For now, there’s no space for SELL setups — the primary direction is still BUY.
🔎 Technical Analysis (H1/H4)
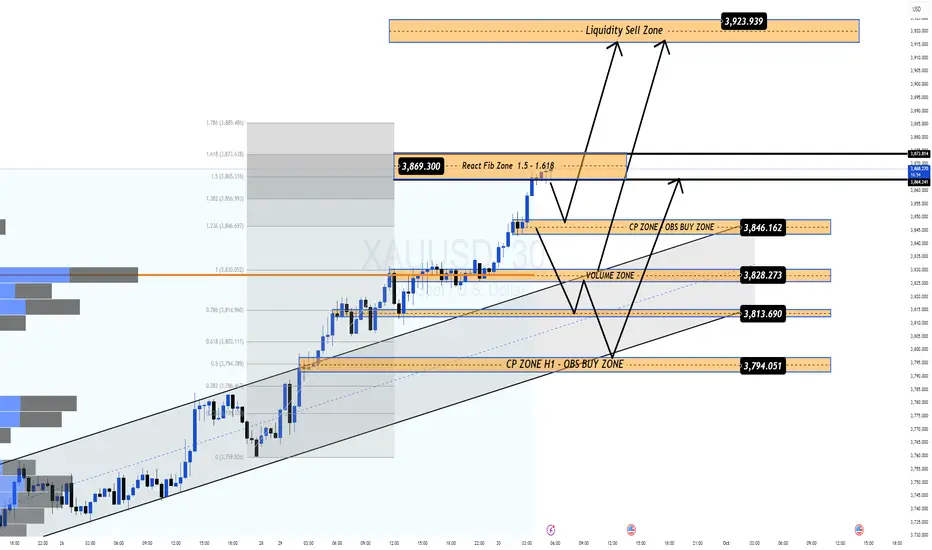
Price has broken higher, continuing to print fresh ATHs with strong bullish momentum.
Main BUY Zone sits at 3846–3844 (confluence of FIB + CP zone).
Secondary support at 3827–3825 (volume zone) where strong reactions are expected.
If momentum persists, medium-term upside targets lie toward the 3923–3930 liquidity zone.
🔑 Key Technical Levels
BUY Zones: 3846–3844, 3827–3825
SELL Zone (Observation only – potential liquidity trap): 3923–3930
📈 Scenarios & Trading Plan
BUY ZONE 1: 3846–3844
SL: 3840
TP: 3850 - 3855 - 3860 - 3870 - 3880 - ???
BUY ZONE 2: 3827–3825
SL: 3820
TP: 3835 - 3840 - 3850 - 3860 - 3870 - 3880 - ???
⚠️ Risk Notes
Expect volatility with JOLTS data and Fed speeches today.
Avoid FOMO buying at highs — wait for price action confirmation at key zones.
Manage position size carefully as end-of-month trading can bring unexpected swings.
✅ Summary
Gold remains firmly in bullish territory, supported by political risks and macroeconomic uncertainty. Plan of the day: prioritize BUY entries at 3846–3844 and 3827–3825, with extended targets at 3880+ and potentially 3920+. Momentum is strong, and following the BUY side remains the higher-probability path.
📢 Stay tuned with MMFLOW TRADING for real-time updates and BIGWIN setups!
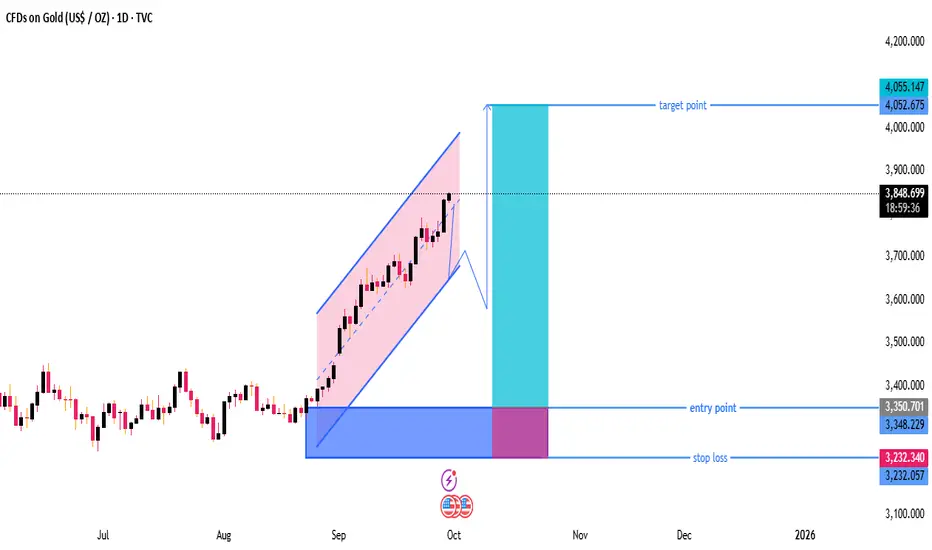
Gold Daily Chart – Buy-the-Dip Setup Towards 4,050 Targethe chart shows XAU/USD (Gold) on a daily timeframe.
Price is currently trading around 3,848, within a rising parallel channel.
A possible pullback from the channel top is indicated before a move higher toward the target.
---
Key Levels & Zones
Entry Point:
Around 3,350 zone marked as the ideal buy area.
This is near the lower support region of previous consolidation.
Stop Loss:
Placed around 3,232, which is below key support.
Good for risk management — avoids staying in trade if price breaks structure.
Target Point:
Around 4,052 – 4,055, aligning with the measured move from the breakout of the channel.
This gives a strong risk-to-reward ratio (roughly 2.5:1).
---
Technical Structure
Trend: Strong uptrend – price respecting ascending channel.
Momentum: Higher highs and higher lows confirm bullish market structure.
Possible Scenario:
1. Short-term pullback expected to lower boundary or breakout retest zone.
2. Continuation move upward toward target (around 4,050).
---
Trading Plan Based on Chart
Wait for Pullback: Don’t buy at current level; price might retrace before next leg.
Enter near 3,350: Ideal long position entry point.
Stop Loss: 3,232 (safe under last swing low).
Target: 4,052–4,055 (previous high / projected channel top).
---
Summary
✅ Bias: Bullish (Buy-the-dip strategy)
📈 Entry: ~3,350
⛔ Stop Loss: ~3,232
🎯 Target: ~4,050
📊 Risk/Reward: Favorable — approx. 1:3
This setup is swing-trade friendly and follows trend continuation logic.
Gold Buy Setup – Buy the Dip Towards 3868 Target1. Trend:
Price is in a clear uptrend within a rising channel (highlighted in pink).
Currently, price is at the upper boundary of the channel, showing a potential short-term pullback before continuing higher.
2. Key Levels:
Entry Point: Around 3,766 – 3,765 (blue zone).
Stop Loss: Around 3,748 (below the channel support).
Target Point: 3,868 (top blue line).
3. Chart Pattern:
Price has formed a bullish flag/channel.
The projected move suggests a pullback to support (blue entry zone), then a bounce to the target area.
4. Risk-to-Reward Ratio:
Risk: ~18 points (from 3,766 entry to 3,748 stop loss).
Reward: ~100 points (from 3,766 entry to 3,868 target).
R:R ≈ 1:5.5, which is very favorable.
---
Trading Idea
Bias: Bullish (Buy setup)
Plan:
Wait for price to drop near 3,765 entry zone.
Place stop loss just below support at 3,748.
Target the upper zone around 3,868.
---
Summary
This chart shows a buy-the-dip strategy within an uptrend.
The plan is to enter near the channel support, with a tight stop loss, aiming for a continuation of the bullish move toward the target.
✅ Strong R:R setup
✅ Trend-following trade
⚠ Risk: If price breaks below 3,748, trend may reverse or consolidate deeper.

H1 bullish momentum intact | Buy 3,792–3,765, target 3,821🟡 XAU/USD – 29/09/2025 | Captain Vincent ⚓
🔎 Captain’s Log – Structure & Trend
H1 continues to print consecutive BoS → bullish trend sustained.
Price broke the long-term downtrend line and surged to new highs.
EMA 34 & EMA 89 both pointing up and below price → confirming short-to-mid-term bullish momentum.
📈 Captain’s Chart – Key Zones
Storm Breaker (Sell Zone / ATH test) : 3,818 – 3,821
Golden Harbor (FVG – Buy Zone) : 3,792 – 3,779
OB Harbor 1 : 3,772 – 3,765
OB Harbor 2 (deeper) : 3,731 – 3,724
Core Idea: 3,792 – 3,765 is the main support “cushion” for trend-follow Buys; 3,818 – 3,821 is the wave edge where profit-taking may occur.
🎯 Captain’s Map – Trade Plan
✅ Golden Harbor (BUY – main priority)
Buy Zone 1 – FVG (3,792 – 3,779)
Entry: 3,792 – 3,779
SL: 3,765
TP: 3,805 – 3,818 – 3,821+
Buy Zone 2 – OB1 (3,772 – 3,765)
Entry: 3,772 – 3,765
SL: 3,758 (below 3,765)
TP: 3,792 – 3,805 – 3,818 – 3,821
Buy Zone 3 – OB2 deep (3,731 – 3,724)
Entry: 3,731 – 3,724
SL: 3,714
TP: 3,745 – 3,765 – 3,792 – 3,805
⚡ Quick Boarding (SELL – scalp only)
Sell Zone – Storm Breaker (3,818 – 3,821)
Entry: 3,818 – 3,821
SL: 3,828
TP: 3,805 – 3,796 – 3,792
Breakdown Short (conditional)
Only consider Short if H1 closes below 3,724
SL: 3,735
TP: 3,710 – 3,700 – 3,690
⚓ Captain’s Note
“The Golden sails remain filled after consecutive BoS . Golden Harbor 🏝️ (3,792 → 3,765) is the anchor dock to board in trend’s direction. Storm Breaker 🌊 (3,818 – 3,821) may trigger profit-taking waves – only go Quick Boarding 🚤 if clear signals appear. If the tide drags below 3,724, let the ship retreat to OB2 to gather strength before resuming the northbound voyage.”

Gold Forecast: Liquidity Rotation Shaping Price ActionGold Forecast: Liquidity Rotation Shaping Price Action
Gold’s recent movement reflects shifting dynamics between liquidity capture and market rebalancing. The push above 3,800 was less about sustained trend extension and more about triggering stops and gathering liquidity before rotating lower. This type of move often indicates that large participants are managing positioning rather than chasing new highs.
The current correction phase is part of that process. Price is being driven back into zones where imbalances remain, allowing institutional flow to realign. Instead of showing weakness, this return highlights how markets redistribute liquidity to prepare for the next decisive move.
From a flow perspective, gold remains in an accumulation phase. Consolidation pockets reveal ongoing positioning, while the corrective dip reflects controlled market engineering rather than disorder. If this cycle continues, the next stage could see energy released in the form of a renewed expansion leg once sufficient liquidity has been absorbed.
In essence, gold is navigating a liquidity-driven cycle: sweep → redistribute → prepare → expand. The underlying order flow still favors upward continuation once the current rebalancing phase completes.

XAUUSD Analysis todayHello traders, this is a complete multiple timeframe analysis of this pair. We see could find significant trading opportunities as per analysis upon price action confirmation we may take this trade. Smash the like button if you find value in this analysis and drop a comment if you have any questions or let me know which pair to cover in my next analysis.

Short Term Market Outlook XAU/USDWhat goes up must come down!
🎯15m chart analysis 🎯
As most experienced gold traders are already aware of its aggressive ranging behaviour many new retail gold traders fail to understand this causing them to get chewed up and spit out in this power house of a pair.
Having an edge against this aggressive range is the key to being able to trade gold successfully long term.
I have highlighted some important areas for you guys to keep an eye out for pull backs, look for rejections and candle closures above and below these zones. Overall market sentiment remains bullish so take sells with extra caution and lighten your positions up. I will keep you guys updated with further levels throughout the week, subscribe and turn notifications on 👁️👁️
Good luck to everybody, let’s make some money this week 💥

GOLD (XAUUSD): More Growth is Coming?!
Gold was very bullish on Friday.
A formation of a buying imbalance candle accompanied by a confirmed
breakout of a significant intraday resistance suggest a strong bullish pressure.
With a high probability, the market will update the ATH again and will aim at 3800 psychological level.
❤️Please, support my work with like, thank you!❤️
I am part of Trade Nation's Influencer program and receive a monthly fee for using their TradingView charts in my analysis.

XAUUSD Analysis todayHello traders, this is a complete multiple timeframe analysis of this pair. We see could find significant trading opportunities as per analysis upon price action confirmation we may take this trade. Smash the like button if you find value in this analysis and drop a comment if you have any questions or let me know which pair to cover in my next analysis.

GOLD 1H CHART ROUTE MAP UPDATE & TRADING PLAN FOR THE WEEKHey Everyone,
Please see our updated 1h chart levels and targets for the coming week.
We are seeing price play between two weighted levels with a gap above at 3780 and a gap below at 3753. We will need to see ema5 cross and lock on either weighted level to determine the next range.
We will see levels tested side by side until one of the weighted levels break and lock to confirm direction for the next range.
We will keep the above in mind when taking buys from dips. Our updated levels and weighted levels will allow us to track the movement down and then catch bounces up.
We will continue to buy dips using our support levels taking 20 to 40 pips. As stated before each of our level structures give 20 to 40 pip bounces, which is enough for a nice entry and exit. If you back test the levels we shared every week for the past 24 months, you can see how effectively they were used to trade with or against short/mid term swings and trends.
The swing range give bigger bounces then our weighted levels that's the difference between weighted levels and swing ranges.
BULLISH TARGET
3780
EMA5 CROSS AND LOCK ABOVE 3780 WILL OPEN THE FOLLOWING BULLISH TARGETS
3802
EMA5 CROSS AND LOCK ABOVE 3802 WILL OPEN THE FOLLOWING BULLISH TARGET
3825
BEARISH TARGETS
3753
EMA5 CROSS AND LOCK BELOW 3753 WILL OPEN THE FOLLOWING BEARISH TARGET
3734
EMA5 CROSS AND LOCK BELOW 3734 WILL OPEN THE FOLLOWING BEARISH TARGET
3705
EMA5 CROSS AND LOCK BELOW 3705 WILL OPEN THE SWING RANGE
3683
3654
EMA5 CROSS AND LOCK BELOW 3654 WILL OPEN THE SECONDARY SWING RANGE
3622
3592
As always, we will keep you all updated with regular updates throughout the week and how we manage the active ideas and setups. Thank you all for your likes, comments and follows, we really appreciate it!
Mr Gold
GoldViewFX

GOLD 4H CHART ROUTE MAP UPDATE & TRADING PLAN FOR THE WEEKHey Everyone,
Please see update on our 4H chart idea from last week, which is playing out as analysed and still valid to continue to track for the coming week.
After completing our Bullish targets last week with ema5 cross and lock confirmation, we are now seeing price play between 3738 and 3778. . We will need to see ema5 cross and lock on either of these two weighted level to determine the next range.
We will also now use lower Goldturns for support and Bounce until we see further cross and lock above for a continuation.
We will keep the above in mind when taking buys from dips. Our updated levels and weighted levels will allow us to track the movement down and then catch bounces up.
We will continue to buy dips using our support levels taking 20 to 40 pips. As stated before each of our level structures give 20 to 40 pip bounces, which is enough for a nice entry and exit. If you back test the levels we shared every week for the past 24 months, you can see how effectively they were used to trade with or against short/mid term swings and trends.
The swing range give bigger bounces then our weighted levels that's the difference between weighted levels and swing ranges.
BULLISH TARGET
3696 - DONE
EMA5 CROSS AND LOCK ABOVE 3696 WILL OPEN THE FOLLOWING BULLISH TARGETS
3738 - DONE
EMA5 CROSS AND LOCK ABOVE 3738 WILL OPEN THE FOLLOWING BULLISH TARGET
3778 - DONE
EMA5 CROSS AND LOCK ABOVE 3778 WILL OPEN THE FOLLOWING BULLISH TARGET
3811 -
EMA5 CROSS AND LOCK ABOVE 3811 WILL OPEN THE FOLLOWING BULLISH TARGET
3845
BEARISH TARGETS
3655
EMA5 CROSS AND LOCK BELOW 3655 WILL OPEN THE FOLLOWING BEARISH TARGET
3615
EMA5 CROSS AND LOCK BELOW 3615 WILL OPEN THE FOLLOWING BEARISH TARGET
3583
EMA5 CROSS AND LOCK BELOW 3583 WILL OPEN THE SWING RANGE
3546
3509
EMA5 CROSS AND LOCK BELOW 3509 WILL OPEN THE SECONDARY SWING RANGE
3458
3409
As always, we will keep you all updated with regular updates throughout the week and how we manage the active ideas and setups. Thank you all for your likes, comments and follows, we really appreciate it!
Mr Gold
GoldViewFX
