GOLD 4H CHART ROUTE MAP UPDATE & TRADING PLAN FOR THE WEEKHey Everyone,
Please see our updated 4h chart levels and targets for the coming week.
We are seeing price play between two weighted levels with a gap above at 3696 and a gap below at 3655. We will need to see ema5 cross and lock on either weighted level to determine the next range.
We will see levels tested side by side until one of the weighted levels break and lock to confirm direction for the next range.
We will keep the above in mind when taking buys from dips. Our updated levels and weighted levels will allow us to track the movement down and then catch bounces up.
We will continue to buy dips using our support levels taking 20 to 40 pips. As stated before each of our level structures give 20 to 40 pip bounces, which is enough for a nice entry and exit. If you back test the levels we shared every week for the past 24 months, you can see how effectively they were used to trade with or against short/mid term swings and trends.
The swing range give bigger bounces then our weighted levels that's the difference between weighted levels and swing ranges.
BULLISH TARGET
3696
EMA5 CROSS AND LOCK ABOVE 3696 WILL OPEN THE FOLLOWING BULLISH TARGETS
3738
EMA5 CROSS AND LOCK ABOVE 3738 WILL OPEN THE FOLLOWING BULLISH TARGET
3778
EMA5 CROSS AND LOCK ABOVE 3778 WILL OPEN THE FOLLOWING BULLISH TARGET
3811
EMA5 CROSS AND LOCK ABOVE 3811 WILL OPEN THE FOLLOWING BULLISH TARGET
3845
BEARISH TARGETS
3655
EMA5 CROSS AND LOCK BELOW 3655 WILL OPEN THE FOLLOWING BEARISH TARGET
3615
EMA5 CROSS AND LOCK BELOW 3615 WILL OPEN THE FOLLOWING BEARISH TARGET
3583
EMA5 CROSS AND LOCK BELOW 3583 WILL OPEN THE SWING RANGE
3546
3509
EMA5 CROSS AND LOCK BELOW 3509 WILL OPEN THE SECONDARY SWING RANGE
3458
3409
As always, we will keep you all updated with regular updates throughout the week and how we manage the active ideas and setups. Thank you all for your likes, comments and follows, we really appreciate it!
Mr Gold
GoldViewFX
Goldtrading

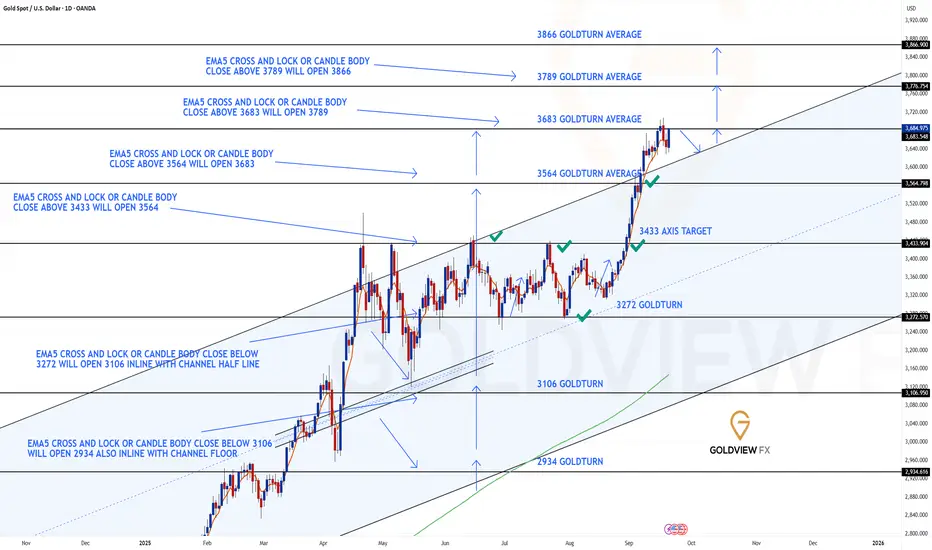
GOLD DAILY CHART ROUTE MAPDaily Chart Update
3683 Target Achieved, Long-Range 3789 Opens
Great finish last week as we got the 3683 target hit following candle body and EMA5 lock above 3564. This clean breakout move confirms the strength of the bullish momentum and completes the next phase of our projected sequence.
We are now seeing candle body close above 3683, which has opened the long-range upside target at 3789. A sustained EMA5 lock above this zone will further confirm continuation strength.
For this momentum to remain healthy, we want to see the channel top act as support on any correction, establishing a solid base for the range expansion. A hold here would validate the breakout structure, while failure to maintain support risks fading back into the channel.
Current Outlook
🔹 3683 Target Reached
Projection played out with precision as the EMA5 lock above 3564 confirmed continuation, giving us the upside completion into 3683.
🔹 Next Objective – 3789
Price action now extends higher, with body closes above 3683 opening the door toward the 3789 target. EMA5 lock here will be the key confirmation for strength.
🔹 Channel Top Support Crucial
The channel top now flips into potential support. Holding above it will sustain the bullish breakout narrative, while any breakdown back below risks a fake-out.
Updated Key Levels
📉 Support – 3433 & 3564
📉 Deeper Support – 3272 (pivotal floor)
📈 Resistance / Next Upside Objective – 3789
Thanks as always for your continued support,
Mr Gold
GoldViewFX
GOLD WEEKLY CHART MID/LONG TERM ROUTE MAPWeekly Chart Update
3659 Retested & Closed Above, 3732 Gap Opens
Last week we saw 3659 tested again, and this time we finished with a weekly candle body close above the level, officially opening the gap toward 3732. This marks a significant step in confirming continuation of the bullish sequence.
At the same time, we must note a detachment left below at 3576. Both 3659 and 3576 now act as correctional support zone levels to keep in mind should price pull back before continuation higher.
Current Outlook
🔹 3659 Retest & Close Above
The weekly body close above 3659 clears resistance and validates upside progression.
🔹 Long-Range Gap Toward 3732
With 3659 cleared, momentum now shifts focus to 3732 as the next upside objective. EMA5 lock confirmation here will further solidify strength.
🔹 Correctional Supports at 3659 & 3576
While the path to 3732 is open, 3659 and 3576 both serve as important levels of support. A healthy correction into these zones would help establish a strong base for continuation.
Updated Levels to Watch
📉 Supports – 3659 & 3576 (correction zones), deeper floor at 3482
📈 Resistance / Next Upside Objective – 3732
Plan
The long-range gap above 3732 is now active. A continuation higher depends on holding recent breakout levels:
Thanks as always for your support,
Mr Gold
GoldViewFX

GOLD (XAUUSD): Rise to All-Time High Confirmed
There is a high chance that Gold will continue rising next week,
following a completion of a correctional movement on a 4H time frame
with a confirmed bullish Change of Character CHoCH.
Odds are high, that the price will rise to 3707 level,
with a highly probable update of ATH.
❤️Please, support my work with like, thank you!❤️
I am part of Trade Nation's Influencer program and receive a monthly fee for using their TradingView charts in my analysis.

Gold Sets New Record: Buy or Sell Amid the Market Frenzy?Hello traders,
Last week, gold ended with an unexpected twist. Prices continued to climb on Friday (19/09), marking the 5th straight week of gains, reaching $3,683.24/oz, while futures advanced to $3,718.50/oz. This came right after the Fed cut interest rates—a move that was expected to “cool” gold. So, is this rally sustainable or just a trap?
Fundamental Analysis: Rate Cuts Fuel Gold’s Rise
After the Fed cut rates by 0.25%, the market saw chaotic trading, with gold hitting historic highs before a quick pullback. Still, the Fed’s message reinforced investor confidence in gold:
Lower holding costs: Reduced interest rates lower the opportunity cost of holding non-yielding gold.
Dovish Fed stance: Despite warning about persistent inflation, Minneapolis Fed President Neel Kashkari suggested job risks could lead to further cuts, raising expectations for looser policy.
Strong demand: Physical gold demand remains high. In India, prices hit a 10-month peak, while in China, discounts widened to a 5-year high, signaling robust demand despite rising prices.
Technical Analysis: Structure Break, Uptrend Resumes
By the weekend, gold broke through its downtrend line, confirming a structural shift and highlighting strong buying pressure. This suggests the bullish trend may continue.
Outlook: This week, focus remains on buying opportunities with short-term targets at $372x and $373x. However, caution is needed with upcoming macroeconomic events, which could trigger large liquidity zones and potential traps.
Sample Trading Strategies (strict risk management):
BUY SCALP: $3671–$3669 | SL: $3666 | TP: $3674–$3694
BUY ZONE: $3657–$3659 | SL: $3647 | TP: $3669–$3709
SELL SCALP: $3713–$3715 | SL: $3719 | TP: $3705–$3785
SELL ZONE: $3731–$3733 | SL: $3741 | TP: $3723–$3683
The market is heating up. Can gold smash through barriers to set fresh records? Share your thoughts below! 👇

XAU/USD – Captain Vincent Weekly Plan🔎 Captain’s Log – Context
📈 Main Trend : Strong uptrend after BoS.
📊 Price moving sideways within the rising channel, staying below Weak High 3674 .
📌 EMA 50 > EMA 200 → bullish trend remains solid.
🎯 Captain’s Map – Trading Scenarios
1️⃣ Golden Harbor (BUY – Main Priority)
🎯 Entry:
FVG Dock: 3602 – 3593
FVG Deep: 3567 – 3560
OB Harbor: 3535 – 3540
⛔ SL: below 3520
✅ TP1: 3674 (sweep Weak High)
✅ TP2: 3720 – 3740
2️⃣ Quick Boarding (Short-term SELL – Counter-trend)
Condition: If price breaks 3674 first → watch for false break.
🎯 Entry: 3670 – 3680
✅ TP: back to 3602 – 3567
⚠️ Note : scalp only, don’t hold long.
3️⃣ Storm Breaker Alert (Bearish Scenario)
If 3535 breaks → short-term uptrend invalidated.
🎯 Bearish target: 3480 – 3500
Captain’s Note ⚓
“The golden sail still catches the wind after BoS, leading the captain and crew on the bullish tide. Golden Harbor 🏝️ (3593 – 3560 – 3535) remains the preferred docking point to load cargo and continue the voyage. Quick Boarding 🚤 at Storm Breaker 🌊 (3670 – 3680) is only a short ride when the ship sweeps liquidity at Weak High 3674 . Should 3535 break, the ship might be dragged toward 3480 – 3500, but as long as it anchors at Golden Harbor, the grand journey still heads north toward 3720+.”

Perfectly grasp the golden trading opportunity?Gold touched the pressure level near 3660-3370 several times during the day and then fell under pressure, which perfectly verified our strategic prediction. The continuous short selling at high levels has reaped great rewards. The current trend relies on the pressure of the 4-hour middle track. The short-term trend is still dominated by a volatile downward trend. The pressure focuses on the 3675-3685 area, and the support below focuses on the 3645-3630 area. From the technical structure, the middle track of the Bollinger band is obviously suppressing. If the rebound cannot break through the middle track pressure, the bears will still dominate the short-term rhythm. In terms of operation, it is recommended to maintain range thinking, enter and exit quickly at high altitudes and low prices, focus on grasping the rhythm, and lock in profits. Steady trading comes from early layout and strict execution. Patiently wait for signals from key positions and then enter the market decisively to seize profit opportunities in the volatile market!

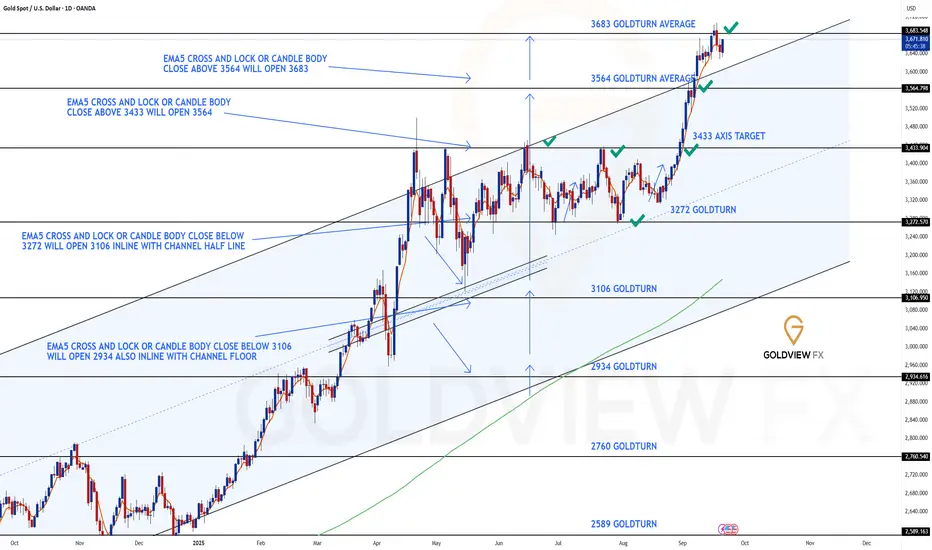
GOLD DAILY CHART ROUTE MAP UPDATE3683 Target Achieved – Chart Idea Complete 🚀💥
Booooom! 💥💥 Just as we laid out, the 3683 target was smashed this week – absolutely amazing finish! This move perfectly completed the chart idea we’ve been tracking, right in line with the analysis.
🔹 3564 ➡️ 3683
We first hit the 3564 target cleanly, then carried that momentum straight through to the big 3683 level. The EMA5 confirmations delivered flawlessly, giving us one of the sharpest, most technical finishes of the week.
This closes out the breakout sequence beautifully and proves once again how powerful structured analysis + patience can be.
🔥 What’s Next?
We’ll be back on Sunday with a fresh Daily chart idea, updated targets, and a full multi-timeframe analysis to guide the next leg of the journey. Stay tuned – momentum is only heating up from here!
Thank you for the continued support, and congratulations to everyone who rode this move with us.
Mr Gold
GoldViewFX
XAUUSD Forecast – Gold Price Action and Market InsightsGold is showing signs of stabilization after recent fluctuations, with price consolidating around the mid-range levels. The chart highlights repeated sequences of structural breaks and shifts, indicating that liquidity has been actively swept on both the buy and sell side.
The latest market move shows a controlled decline, followed by an attempt to absorb selling pressure. Current positioning suggests the possibility of a short-term liquidity grab to the downside, which could fuel a stronger recovery leg in the sessions ahead.
The projected outlook favors a scenario where buyers regain momentum, aiming to retest the upper price zones. If this momentum develops, the market may establish a renewed upward leg in alignment with the broader bullish cycle observed across higher timeframes.
From a macro perspective, gold continues to be supported by demand for safe-haven assets amid ongoing global financial uncertainty and shifting monetary policies. This backdrop enhances the probability of gold sustaining its mid-term bullish trajectory despite temporary corrective phases.

Gold rebounds, bears should not miss this opportunity!Did gold fall as we expected? Congratulations to those who have been paying attention. We have been emphasizing from the weekend, last weekend, until yesterday that the top of gold is just above the 3700 mark, and the extreme position is in the 3720-30 area. When the Fed cuts interest rates, gold will fall. We have been saying this over and over again. I don’t know if you have listened to us.
Gold, the release of yesterday's interest rate decision also made the market experience a shock. The large fluctuations back and forth without a bottom line also made the market abuse the bulls and bears wantonly. The trend was also quite magical, making the market defenseless and not giving the slightest chance. After a small rebound near 3694 when the news was announced, it began to dive rapidly, reaching the lowest point near 3652, and then quickly rose again to near 3707, and then continued to fall rapidly, reaching the lowest point near 3645. After the opening, it rebounded again at 3672 and continued to fall. The current lowest point was near 3634. A series of large-scale back and forth sweeps also made the market more fearful, and the daily line also closed in the form of a large negative line. The market is in a state of decline, directly breaking the support of the short-term moving average. It is currently hovering between the 5-day and 10-day moving averages. Therefore, due to the closing of yesterday's large negative line, it is relatively likely to start a pullback and repair again in the short term, and the effective support below is maintained at around 3630-3620. This area is also the key tactical defense we mentioned earlier. Once this position continues to be lost, the long and short positions may be reversed in the later period. The key pressure above is maintained at around 3675-3690. You can refer to this position to continue to short and wait. If gold rebounds to around 3675-3690 during the day, short it, and the target is around 3630-20.

Strategic Long-Term Perspective on GoldGold has delivered a strong bullish cycle after weeks of accumulation. The past phase showed a contracting range where liquidity was built up and multiple structural shifts occurred, signaling preparation for expansion. Once price broke out of that range in late August, momentum accelerated, leading to a clean and sustained rally into September.
The recent move highlights how market flow continues to favor the upside, with each correction acting as a re-accumulation zone rather than a trend reversal. Institutional order flow remains visible, supporting higher valuations as price respects bullish market structure.
Currently, gold is stabilizing after the sharp leg upward. This pause suggests a phase of healthy consolidation, likely absorbing liquidity before attempting the next impulsive wave higher. Overall sentiment remains constructive, with bullish continuation the dominant narrative unless a major structural shift occurs.

Gold Breaking Limits – Trend Speaks for ItselfGold Breaking Limits – Trend Speaks for Itself
Gold Market Outlook
Gold continues to demonstrate a well-structured bullish cycle, characterized by steady momentum and clean trend development. The market has transitioned from a prolonged consolidation phase into a sustained directional move, where each breakout is validated by controlled retracements. This reflects strong participation and confidence from larger players.
The sequence of market shifts and break-of-structure signals highlight how short-term pullbacks are consistently absorbed, turning into fuel for further expansion. Price action is orderly, with no signs of erratic volatility, showing that buyers remain in control and liquidity is being managed efficiently.
Overall, gold is moving in line with the broader macro sentiment. The rhythm of accumulation, expansion, and continuation suggests that the current cycle has not yet exhausted its potential. While interim pauses are expected, the structural integrity of the trend continues to favor upside development over the medium term.

GOLD 4H CHART ROUE MAP UPDATEHey Everyone,
4H Chart Update
Yesterday we completed 3655 and 3696, noting that price would likely range between these two levels until we saw an EMA5 cross and lock to confirm the next move.
As expected, we continued to see bounces within this range allowing us to catch clean bounces. Now, we are seeing 3655 being tested with a candle. For confirmation of downside toward 3615, we still need EMA5 to cross and lock below 3655.
⚠️ If the EMA5 fails to lock, we can expect another retest back up toward the higher range.
We will keep the above in mind when taking buys from dips. Our updated levels and weighted levels will allow us to track the movement down and then catch bounces up.
We will continue to buy dips using our support levels taking 20 to 40 pips. As stated before each of our level structures give 20 to 40 pip bounces, which is enough for a nice entry and exit. If you back test the levels we shared every week for the past 24 months, you can see how effectively they were used to trade with or against short/mid term swings and trends.
The swing range give bigger bounces then our weighted levels that's the difference between weighted levels and swing ranges.
BULLISH TARGET
3655 - DONE
EMA5 CROSS AND LOCK ABOVE 3655 WILL OPEN THE FOLLOWING BULLISH TARGETS
3696 - DONE
EMA5 CROSS AND LOCK ABOVE 3696 WILL OPEN THE FOLLOWING BULLISH TARGET
3738
BEARISH TARGETS
3615
EMA5 CROSS AND LOCK BELOW 3615 WILL OPEN THE FOLLOWING BEARISH TARGET
3583
EMA5 CROSS AND LOCK BELOW 3583 WILL OPEN THE FOLLOWING BEARISH TARGET
3545
EMA5 CROSS AND LOCK BELOW 3545 WILL OPEN THE FOLLOWING BEARISH TARGET
3509
EMA5 CROSS AND LOCK BELOW 3509 WILL OPEN THE SWING RANGE
3458
3409
EMA5 CROSS AND LOCK BELOW 3409 WILL OPEN THE SECONDARY SWING RANGE
3360
3320
As always, we will keep you all updated with regular updates throughout the week and how we manage the active ideas and setups. Thank you all for your likes, comments and follows, we really appreciate it!
Mr Gold
GoldViewFX

XAU/USD 1H – Bullish Continuation from Demand Zone .Key Observations:
Uptrend Structure:
Price has been consistently making Higher Highs (HH) and Higher Lows (HL), confirming an overall bullish market structure.
Break of Structure (BOS) levels confirm continuation of the trend.
Market Structure Shift (MSS):
Recently, price created a short-term shift downward (MSS) but retraced into a POI zone (demand area) near 3,646 – 3,659.
Current Setup:
The price bounced from the POI zone and is now recovering upward.
A long position was marked with entry near 3,659, Stop Loss at 3,646, and Target around 3,709.
Bias:
As long as price holds above 3,646 (POI zone), bullish continuation is favored.
If broken below 3,646, bearish correction could extend further.

XAU/USD 18 September 2025 Intraday AnalysisH4 Analysis:
-> Swing: Bullish.
-> Internal: Bullish.
As mentioned in analysis dated 04 September 2025, with respect to alternative scenario, price could potentially continue higher, is how price printed, price continued its bullish trajectory printing all-time-highs.
Price previously, and has now for the second time, printed a bearish CHoCH which is the first indication, but not confirmation, of bearish pullback phase initiation, however, due to the insignificant nature of the pullback, particularly relative to previous price action, I will apply discretion and not classify previous iBOS, I also have marked this in red.
Price has continued with it's bullish trajectory, subsequently printing a bearish CHoCH. We are now trading within an established range, however, I shall continue to monitor price action with respect to depth of pullback relative to recent price action.
Intraday Expectation:
Price to trade down to either discount of internal 50% EQ, or H4 supply zone before targeting weak internal high priced at 3,703,240.
Alternative scenario: Price could potentially print higher-highs.
Note:
The Federal Reserve’s sustained dovish stance, coupled with ongoing geopolitical uncertainties, is likely to prolong heightened volatility in the gold market. Given this elevated risk environment, traders should exercise caution and recalibrate risk management strategies to navigate potential price fluctuations effectively.
Additionally, gold pricing remains sensitive to broader macroeconomic developments, including policy decisions under President Trump. Shifts in geopolitical strategy and economic directives could further amplify uncertainty, contributing to market repricing dynamics.
H4 Chart:
M15 Analysis:
-> Swing: Bullish.
-> Internal: Bullish.
Price has continued with its bullish trajectory, printing all-time-highs.
Previous price action printed a bearish CHoCH, subsequently printing higher, however, due to the insignificant depth of the pullback, relative to recent price action, I shall again apply discretion and not classify this an an internal high. This marked this in red.
Price has since continued bullish, printing a bearish CHoCH. We are now trading within an established internal range.
Intraday Expectation:
Price has reacted from an M15 demand zone, within discount of 50% EQ. Price to target weak internal high priced at 3,703. 240
Alternative scenario: All HTF's require a corrective move, price has since failed to target and close above weak internal high therefore, and in order to confirm HTF bearish pullback phase, price could target strong internal low, priced at 3,612.240.
Note:
Gold remains highly volatile amid the Federal Reserve's continued dovish stance, persistent and escalating geopolitical uncertainties. Traders should implement robust risk management strategies and remain vigilant, as price swings may become more pronounced in this elevated volatility environment.
Additionally, President Trump’s recent tariff announcements are expected to further amplify market turbulence, potentially triggering sharp price fluctuations and whipsaws.
M15 Chart:

XAUUSD Analysis todayHello traders, this is a complete multiple timeframe analysis of this pair. We see could find significant trading opportunities as per analysis upon price action confirmation we may take this trade. Smash the like button if you find value in this analysis and drop a comment if you have any questions or let me know which pair to cover in my next analysis.

GOLD 4H CHART ROUTE MAP UPDATEHey Everyone,
After successfully sharing our 1H chart target updates earlier this week, here’s an update on our our 4H chart idea shared on Sunday.
This setup has also played out perfectly:
We started the week with 3655 being hit.
That was followed by the EMA5 cross and lock, which opened the target for 3696, also hit perfectly to complete the target.
Currently, we’re seeing range play between 3655 and 3696. The next move will depend on whether we get another EMA5 cross and lock above or below these two Goldturns, which will guide us toward the next range.
We will keep the above in mind when taking buys from dips. Our updated levels and weighted levels will allow us to track the movement down and then catch bounces up.
We will continue to buy dips using our support levels taking 20 to 40 pips. As stated before each of our level structures give 20 to 40 pip bounces, which is enough for a nice entry and exit. If you back test the levels we shared every week for the past 24 months, you can see how effectively they were used to trade with or against short/mid term swings and trends.
The swing range give bigger bounces then our weighted levels that's the difference between weighted levels and swing ranges.
BULLISH TARGET
3655 - DONE
EMA5 CROSS AND LOCK ABOVE 3655 WILL OPEN THE FOLLOWING BULLISH TARGETS
3696 - DONE
EMA5 CROSS AND LOCK ABOVE 3696 WILL OPEN THE FOLLOWING BULLISH TARGET
3738
BEARISH TARGETS
3615
EMA5 CROSS AND LOCK BELOW 3615 WILL OPEN THE FOLLOWING BEARISH TARGET
3583
EMA5 CROSS AND LOCK BELOW 3583 WILL OPEN THE FOLLOWING BEARISH TARGET
3545
EMA5 CROSS AND LOCK BELOW 3545 WILL OPEN THE FOLLOWING BEARISH TARGET
3509
EMA5 CROSS AND LOCK BELOW 3509 WILL OPEN THE SWING RANGE
3458
3409
EMA5 CROSS AND LOCK BELOW 3409 WILL OPEN THE SECONDARY SWING RANGE
3360
3320
As always, we will keep you all updated with regular updates throughout the week and how we manage the active ideas and setups. Thank you all for your likes, comments and follows, we really appreciate it!
Mr Gold
GoldViewFX

XAUUSD Analysis todayHello traders, this is a complete multiple timeframe analysis of this pair. We see could find significant trading opportunities as per analysis upon price action confirmation we may take this trade. Smash the like button if you find value in this analysis and drop a comment if you have any questions or let me know which pair to cover in my next analysis.

XAUUSD – Wave (4) Pullback Setting Up Wave (5) ExtensionHey Traders,
Gold on the M30 chart is still holding a bullish structure, but the recent push into the upper channel line shows early signs of exhaustion. Here’s my full breakdown and trading plan:
🔍 Technical Overview
Price just completed Wave (3) around 3697.40, tagging the upper trend channel – a natural profit-taking zone.
The 3666–3670 range has been a key pivot/support zone multiple times; I expect a pullback into this area for Wave (4) before another rally.
3657 marks deeper support and the invalidation point for the bullish setup.
If Wave (4) holds, Wave (5) targets 3720–3725.
📈 Key Levels
Type Price Level Notes
Resistance 3695–3700 Wave (3) top + upper channel edge – watch rejection
Support (1) 3666–3670 Primary buy zone for Wave (4)
Support (2) 3657 Strong support & invalidation
Wave (5) TP 3720–3725 Expected Wave (5) extension target
⚙️ Trading Plan
✅ Primary Setup – Buy the Dip (Trend Continuation)
Entry Zone: 3666–3670 (or a brief sweep to ~3657).
Confirmation: Bullish engulfing candle, pin bar, or MACD crossover on M30.
Targets:
TP1: 3695–3700 (prior highs)
TP2: 3720–3725 (Wave (5) projection)
Stop Loss: Below ~3652.
Risk/Reward: ~1:2 to 1:3 depending on entry.
⚠️ Secondary Setup – Countertrend Short
Scenario: Strong rejection again at 3695–3700.
Targets: 3670 → 3657.
Stop Loss: Above ~3703–3707.
Note: This is countertrend and higher risk – take quick profits, small position sizing.
🛡 Risk & Invalidation
A close below 3656 with a break of the lower trend channel invalidates the bullish Wave (5) scenario.
Always risk ≤1–1.5% per trade, wait for confirmation, and don’t chase if price runs without you.
🧭 Final Thoughts
Gold remains in a bullish short-term channel. A healthy pullback into 3666–3670 could provide the perfect entry for the next Wave (5) leg up. Be patient for price action confirmation.
Countertrend shorts are possible on a sharp rejection at 3695–3700, but the main play is buying the dip.
Stay disciplined, trade the levels, and let the market come to you.

Gold hits a new high again, the opportunity to invest has come!Gold's recent performance remains strong, reaching a new all-time high near 3,685, fully demonstrating the dominance of bullish sentiment. Although inflation remains viscous, the market is increasingly confident that the Federal Reserve will cut interest rates this week. Focus is shifting to the extent of the cut and subsequent policy guidance. If the rate cut exceeds expectations, gold may usher in a new round of liquidity-driven gains. If it falls short of expectations, short-term profit-taking may occur, leading to increased volatility.
From a technical perspective, gold has closed higher for several consecutive days, with short-term moving averages aligned in a bullish pattern. The daily and 4-hour charts remain in an upward trend, with the support center continuously shifting upwards. The bullish structure is solid, but the current price is already at a relatively high level. If the upward push fails to break through with significant volume, there is still room for a short-term pullback, and we need to be wary of the possibility of a technical correction. Today's core trading strategy is to primarily buy on dips, supplemented by shorting at high levels. We should participate with the trend and avoid blindly chasing the market. Support below is the 3650-3635 area. If it stabilizes after a pullback, we can arrange long positions in batches, with the initial target around 3680-3685, and then explore the potential for further growth after breaking through the new high. Resistance above is the 3685-3690 area. If the short-term upward push encounters resistance and fails to break through, we can try shorting with a light position, with a stop-loss placed above the resistance level. Enter and exit quickly, and avoid a prolonged battle. The short-term bullish strength and weakness dividing line is the 3630-3620 level. If it breaks below, we should be wary of the risk of a deep pullback.
This week is packed with macroeconomic events, with the Federal Reserve's interest rate decision in particular under scrutiny, potentially amplifying market volatility. We recommend building positions in batches, maintaining strict position management, and setting effective stop-loss and take-profit targets to ensure profit capture while minimizing drawdown risk.
Do you think the Federal Reserve will cut interest rates beyond expectations this time? We welcome your exchange of views. We will also adjust our strategies immediately based on the data to ensure that our trading rhythm keeps pace with the market.

Gold (XAU/USD) –> Bullish Rectangle Pattern BreakoutHello guys!
💥Gold has been consolidating in a bullish rectangle pattern after a strong upward move. This type of pattern usually signals continuation, with price gearing up for the next leg higher.
🔹 Setup:
The rectangle formed around $3680–$3690 support and resistance near $3689.
A clean breakout above $3689 gives the entry signal for the continuation move.
🔹 Targets:
First target: $3705
Second target: $3724
🔹 Stop Loss:
Below the rectangle support ($3674–$3682) to stay protected against a false breakout.
📌 Conclusion:
The bullish rectangle pattern suggests that Gold is preparing for another push higher. A breakout above 3689 opens the path first to 3705, and then to the extended target at 3724.
Disclaimer: As part of ThinkMarkets’ Influencer Program, I am sponsored to share and publish their charts in my analysis.

GOLD ROUTE MAP UPDATEHey Everyone,
Great start to the week with our 1H chart idea playing out as analysed.
We started with our Bullish target 3653 being hit, followed with emA5 cross and lock opening 3678 - This was also hit perfectly completing the setup.
We will now look for a ema56 cross and lock above 3678 for a continuation into 3702 or failure to lock above 3678 will follow with a rejection into the lower Goldturns for support and bounce.
We will keep the above in mind when taking buys from dips. Our updated levels and weighted levels will allow us to track the movement down and then catch bounces up.
We will continue to buy dips using our support levels taking 20 to 40 pips. As stated before each of our level structures give 20 to 40 pip bounces, which is enough for a nice entry and exit. If you back test the levels we shared every week for the past 24 months, you can see how effectively they were used to trade with or against short/mid term swings and trends.
The swing range give bigger bounces then our weighted levels that's the difference between weighted levels and swing ranges.
BULLISH TARGET
3653 - DONE
EMA5 CROSS AND LOCK ABOVE 3653 WILL OPEN THE FOLLOWING BULLISH TARGETS
3678 - DONE
EMA5 CROSS AND LOCK ABOVE 3678 WILL OPEN THE FOLLOWING BULLISH TARGET
3702
EMA5 CROSS AND LOCK ABOVE 3702 WILL OPEN THE FOLLOWING BULLISH TARGET
3727
EMA5 CROSS AND LOCK ABOVE 3727 WILL OPEN THE FOLLOWING BULLISH TARGET
3747
EMA5 CROSS AND LOCK ABOVE 3747 WILL OPEN THE FOLLOWING BULLISH TARGET
3768
BEARISH TARGETS
3622
EMA5 CROSS AND LOCK BELOW 3622 WILL OPEN THE FOLLOWING BEARISH TARGET
3585
EMA5 CROSS AND LOCK BELOW 3585 WILL OPEN THE SWING RANGE
3556
3528
As always, we will keep you all updated with regular updates throughout the week and how we manage the active ideas and setups. Thank you all for your likes, comments and follows, we really appreciate it!
Mr Gold
GoldViewFX

Gold Price Stabilises Ahead of Central Bank DecisionsGold Price Stabilises Ahead of Central Bank Decisions
Following the ECB’s decision last week to leave interest rates unchanged, traders will closely monitor this week’s monetary policy announcements from the US Federal Reserve, the Bank of England, the Bank of Japan, and other central banks from Toronto to Taipei.
As the XAU/USD chart shows today, the gold price has stabilised after its recent record highs, with investors adopting a wait-and-see stance. The ADX indicator is trending lower, suggesting a diminishing directional momentum.
Key Drivers Influencing Gold Prices
Market participants are almost fully convinced that the Federal Reserve will cut rates by a quarter point this week, while also pricing in the likelihood of further reductions next year amid signs of labour market weakness. Lower rates are generally seen as supportive for gold, making it a more attractive asset relative to yield-bearing US Treasuries.
Additional factors underpinning bullish sentiment include:
→ Weakness in the US dollar.
→ Persistent geopolitical tensions.
→ Pressure on the Fed from Donald Trump, who recently attempted to dismiss Board Governor Lisa Cook.
→ Central bank gold purchases.
On the other hand, profit-taking could dampen demand. Nevertheless, gold prices remain elevated.
Technical Analysis of XAU/USD
Recently, we outlined three reasons why gold’s rally might pause. Since then, the price has consolidated within the $3,610–3,660 range.
This has confirmed the assumption that the median line of the long-term ascending channel is acting as resistance. The steep upward channel (marked with orange lines) has been broken.
What Could Happen Next
→ From a bullish perspective, the resistance levels at $3,510 and $3,575 have been broken to the upside and successfully retested – a sign of strong demand.
→ From a bearish perspective, the candlestick’s long upper shadow, where gold set its record high, reflects aggressive selling pressure.
An attempt to break below the $3,575 support level and the orange dotted line (an additional support trendline plotted beneath the orange channel) could happen.
However, whether this scenario materialises will largely depend on upcoming central bank announcements. Traders should brace for heightened volatility.
This article represents the opinion of the Companies operating under the FXOpen brand only. It is not to be construed as an offer, solicitation, or recommendation with respect to products and services provided by the Companies operating under the FXOpen brand, nor is it to be considered financial advice.
