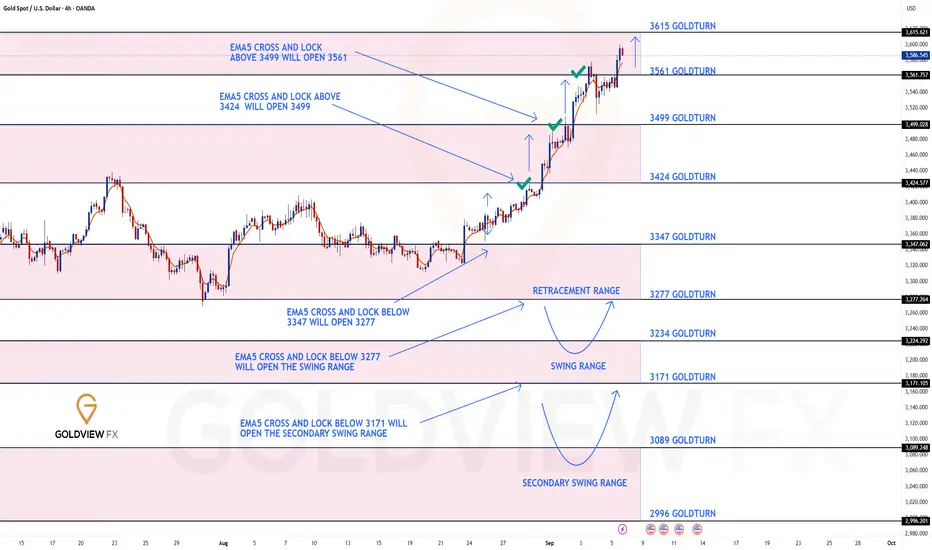
GOLD 4H CHART ROUTE MAP UPDATEHey Everyone,
This is a follow up update on our 4H chart idea that we shared Sunday stating that we still had the final gap in the range left.
EMA5 cross and cross and lock above 3561 left 3615 open.
- This target was hit this week now completing our 4H chart idea.
Keep an eye out for our NEW 4H chart idea with updated levels and route map.
BULLISH TARGET
3424 - DONE
EMA5 CROSS AND LOCK ABOVE 3424 WILL OPEN THE FOLLOWING BULLISH TARGETS
3499 - DONE
EMA5 CROSS AND LOCK ABOVE 3499 WILL OPEN THE FOLLOWING BULLISH TARGET
3561 - DONE
EMA5 CROSS AND LOCK ABOVE 3561 WILL OPEN THE FOLLOWING BULLISH TARGET
3615 - DONE
As always, we will keep you all updated with regular updates throughout the week and how we manage the active ideas and setups. Thank you all for your likes, comments and follows, we really appreciate it!
Mr Gold
GoldViewFX
Goldtrading

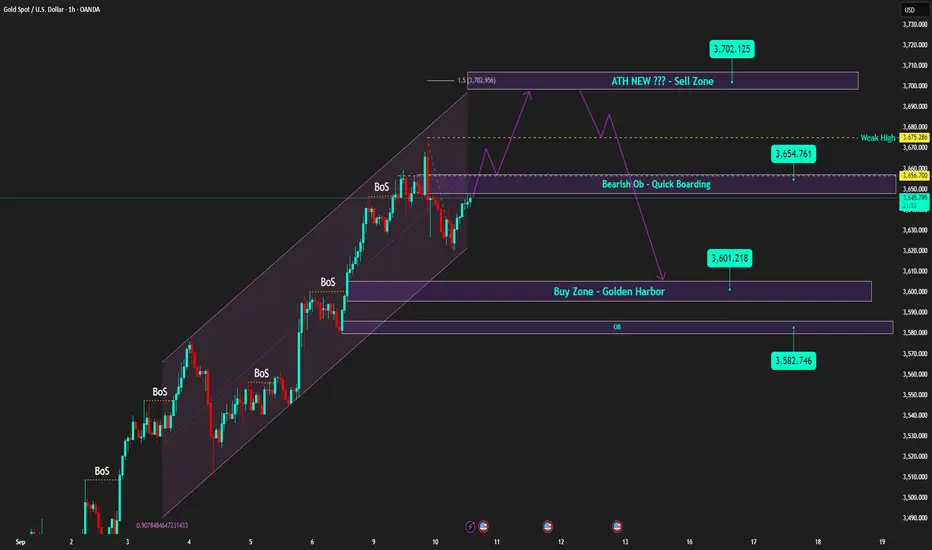
Gold - Caution ahead of US PPI report | Priority on Sell setups🟡 XAU/USD – 10/09 | Captain Vincent ⚓
🔎 Captain’s Log – Market Context
US 10-year bond yields rebound, signaling the market is awaiting key inflation data.
At 07:30, US PPI report will be released – a crucial figure that could strongly influence FED rate expectations.
Investors are also eyeing US CPI in the coming days to assess the inflation outlook.
The US Supreme Court accepted Trump’s appeal, but this news has not yet had a notable impact on Gold.
⏩ Captain’s Summary: Ahead of inflation data, Gold often tends to correct lower due to cautious sentiment.
📈 Captain’s Chart – Technical Analysis
Storm Breaker (Key Resistance):
Bearish OB: 3654 – 3660 (short-term upper cap)
ATH Watchtower: 3700 – 3702 (Sell Zone – possible new ATH test)
Golden Harbor (Strong Support):
Buy Zone: 3601 – 3602
OB Dock: 3582 – 3585
Currently, price is around 3640 – 3645, after a technical rebound from support. High probability that Gold will retest nearby resistance before a downward correction.
🎯 Captain’s Map – Trade Scenarios
⚡ Quick Boarding (SELL – Daily Priority)
Entry 1: 3654 – 3660
SL: 3668
TP: 3654 → 3650 → 3618 → 3610
Entry 2 – ATH Test: 3701 – 3703
SL: 3711
TP: 3688 → 3675 → 3665 → 365x
✅ Golden Harbor (BUY – Only at deep support)
Buy Zone: 3601 – 3603
SL: 3592
TP: 3610 → 3620 → 3630
⚓ Captain’s Note
“The golden ship faces turbulent seas today as it sails near Storm Breaker 🌊 (3654 – 3660) . Before the fierce winds called US PPI , sailors should prioritize dropping anchor with short-term SELL positions at resistance. Golden Harbor 🏝️ (3601 – 3603) remains a safe haven below, but only when the ship corrects deeply should it dock. On this voyage, Quick Boarding 🚤 is for scalp maneuvers, while the main current is still steered by the stormy waves of inflation.”
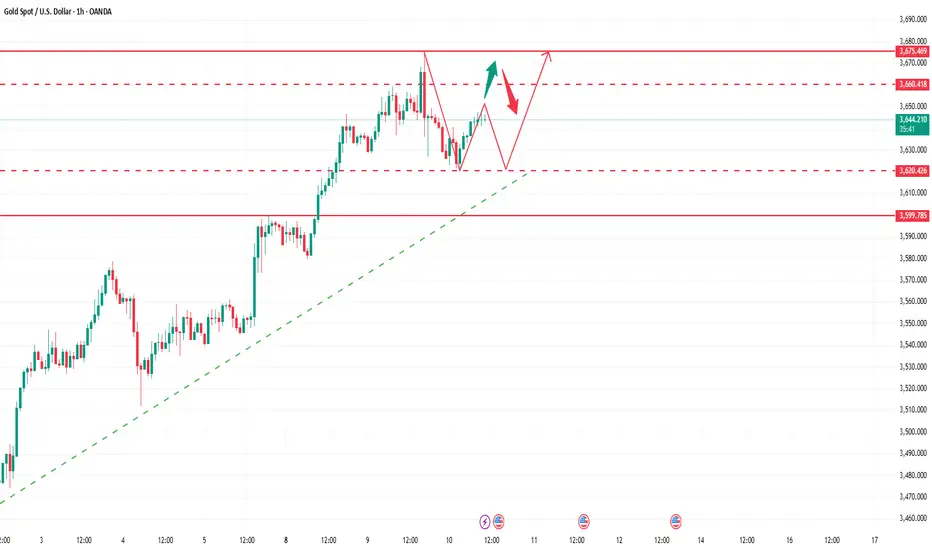
How to correctly grasp the gold trading opportunities?Yesterday, the technical side of gold rose first and then fell. The overall gold price continued to rise strongly in the Asian and European sessions, and finally fell back in the U.S. session and fell into repeated fluctuations, and finally closed near 3628. The daily K-line closed at a high and then fell back and fluctuated in the middle. Yesterday, I kept notifying everyone that the technical side needed to retrace and not to be overly bullish on gold. Now everything is perfectly in line with expectations. Friends who follow me can see it. Today we continue to treat it with the idea of going long on retracements. After all, I believe that the trend has not reversed, and going long on retracements is still the general trend. Today, we will first focus on the short-term support at 3620-3610 below, and continue to go long if it retraces and does not break. If you encounter troubles in your current gold operations and want to make your investment journey more stable and avoid detours, please feel free to communicate with us at any time!
From the 4-hour level, today's short-term support for gold will focus on the 3620-3610 area, and the 3600 mark is the core dividing line between the strength of the bulls. If it retraces and stabilizes above this position during the day, the overall bullish thinking will remain unchanged. The main tone is still to go long on the retracement. At the daily level, as long as gold stabilizes above 3600, the low-long thinking will be sustainable. As for the counter-trend short positions, specific reminders will be given according to the pressure on the market at high levels. Brothers just need to pay attention to the bottom in time.
Gold operation strategy: Go long on gold when it retraces to around 3620-3610, target 3650-3660, and continue to hold if it breaks through.
Goldman lays out the case for $5,000 gold – here’s how it happenGoldman Sachs has warned that gold prices could surge to $5000/oz if the Trump administration succeeds in undermining the independence of the U.S. Federal Reserve.
A politicized Fed is seen as likely to cut rates extremely aggressively (Treasury Secretory Scott Bessent and Trump have called for an interest rate of 1.5% and 1.0%, respectively) to stimulate short-term growth, raising the risk of higher inflation.
Such a move could drive investors away from traditional safe havens like the U.S. dollar and government bonds. In a report released this week, Goldman noted that if just 1% of the privately held U.S. Treasury market shifted into gold, prices could rise by about 40% from current levels.

GOLD ROUTE MAP UPDATEHey Everyone,
Another PIPTASTIC day on the charts for us with our 1H chart playing out as analysed with our final target completed today.
After completing 3593, 3613 and then 3638, we stated that we would now look for ema5 cross and lock above 3638 to open 3658. We got the lock and confirmation followed with the target hit - PERFECTION!!
We are now seeing rejection on this level and will use the lower Goldturns for support and bounce. If the range above opens further please review our daily chart and weekly chart updates with higher range levels to continue to track the movement until we update a new 1h chart.
We will continue to buy dips using our support levels taking 20 to 40 pips. As stated before each of our level structures give 20 to 40 pip bounces, which is enough for a nice entry and exit. If you back test the levels we shared every week for the past 24 months, you can see how effectively they were used to trade with or against short/mid term swings and trends.
The swing range give bigger bounces then our weighted levels that's the difference between weighted levels and swing ranges.
BULLISH TARGET
3593 - DONE
EMA5 CROSS AND LOCK ABOVE 3593 WILL OPEN THE FOLLOWING BULLISH TARGETS
3613 - DONE
EMA5 CROSS AND LOCK ABOVE 3613 WILL OPEN THE FOLLOWING BULLISH TARGET
3638 - DONE
EMA5 CROSS AND LOCK ABOVE 3638 WILL OPEN THE FOLLOWING BULLISH TARGET
3658 - DONE
BEARISH TARGETS
3562
EMA5 CROSS AND LOCK BELOW 3562 WILL OPEN THE FOLLOWING BEARISH TARGET
3528
EMA5 CROSS AND LOCK BELOW 3528 WILL OPEN THE SWING RANGE
3492
3470
EMA5 CROSS AND LOCK BELOW 3470 WILL OPEN THE SECONDARY SWING RANGE
3438
3408
As always, we will keep you all updated with regular updates throughout the week and how we manage the active ideas and setups. Thank you all for your likes, comments and follows, we really appreciate it!
Mr Gold
GoldViewFX

XAUUSD – M30 Intraday Trading Plan | MMFLOW TRADINGMarket Pulse:
The US jobs report confirmed a clear slowdown in labour market growth. According to CME FedWatch, there is now an 88% probability the Fed cuts rates by 0.25% in September, and 12% for a 0.5% cut. Lower rates reduce the opportunity cost of holding gold – fuelling demand further.
Gold has already gained 38% YTD, after rising 27% in 2024. A weaker USD, aggressive central bank accumulation (led by China, which extended purchases for the 10th consecutive month in August), loose monetary policy, and rising global uncertainty continue to build a solid base for this bullish trend.
👉 Bottom line: Macro flows + liquidity both favour the BUY side.
Technical View (M30):
Price is respecting the ascending channel, printing higher lows.
3616–3596 is the structural support; only a breakdown here shifts the trend.
Liquidity clusters sit at 3653–3655 and 3675–3677, likely to trigger short-term SELL reactions before the broader uptrend resumes.
Execution Plan (Today):
🔵 BUY ZONE: 3618 – 3616
SL: 3610
TP: 3624 → 3630 → 3635 → 3640 → 3650 → 3660 → 3670+
🔵 BUY ZONE: 3598 – 3596
SL: 3590
TP: 3602 → 3606 → 3610 → 3615 → 3620 → 3630 → 3640 → 3650+
🔴 SELL ZONE: 3653 – 3655
SL: 3660
TP: 3648 → 3644 → 3640 → 3635 → 3630 → 3620
🔴 SELL ZONE: 3675 – 3677
SL: 3681
TP: 3670 → 3665 → 3660 → 3650 → 3640
Summary:
✅ Bigger picture: Bullish trend intact – look for buys off liquidity support zones.
⚡ Short-term: take quick SELLs around liquidity resistance for intraday setups.
👉 Follow MMFLOW TRADING for precision plans: BUY with structure, SELL with liquidity.

XAU/USD Analysis: 3 Reasons Why Gold’s Rally Might PauseXAU/USD Analysis: 3 Reasons Why Gold’s Rally Might Pause
Today’s XAU/USD chart shows that gold continues to set records in September. The price has risen above $3,650 per ounce for the first time in history – one of the main drivers being expectations of a Federal Reserve rate cut on Wednesday, 17 September.
Easier monetary policy is generally seen as boosting gold’s appeal – this has pushed XAU/USD nearly 6% higher since the start of September. However, the chart highlights three reasons why further upside may be limited.
Technical Analysis of the XAU/USD Chart
1. Long-term channel:
Over the course of 2025, gold price movements have formed an ascending channel (shown in blue), and today XAU/USD is trading close to its median line. This is where supply and demand typically balance out. Buyers may consider the post-September rally overstretched, while sellers could view the all-time high as an opportunity to take profits.
2. Rectangle pattern target reached:
The range between $3,250 and $3,440 that developed mid-year can be interpreted as a rectangle pattern. Following the bullish breakout, the implied target of $3,630 has already been achieved.
3. RSI signals risk:
The RSI indicator is close to forming a bearish divergence.
Given the steep angle of the orange support line, a correction – for example, towards the psychological level of $3,550 – might occur.
In summary, gold’s upward momentum may start to slow. At the same time, given the market’s inertia, traders may have little reason to expect a decisive shift away from bullish dominance. Still, next Wednesday could bring surprises.
This article represents the opinion of the Companies operating under the FXOpen brand only. It is not to be construed as an offer, solicitation, or recommendation with respect to products and services provided by the Companies operating under the FXOpen brand, nor is it to be considered financial advice.

GOLD 1H CHART ROUTE MAP UPDATE Hey Everyone,
Great start to the week with our 1h chart idea playing out, as analysed.
We started with our Bullish target hit at 3593 followed with ema5 cross and lock opening 3613, which was hit perfectly. We then got a further ema5 cross and lock above 3613 opening 3638, also completed today - beautiful!!
We will now look for ema5 cross and lock above 3638 to open the range above or failure to lock above here will follow with a rejection into the lower Goldturns for support and bounce.
We will keep the above in mind when taking buys from dips. Our updated levels and weighted levels will allow us to track the movement down and then catch bounces up.
We will continue to buy dips using our support levels taking 20 to 40 pips. As stated before each of our level structures give 20 to 40 pip bounces, which is enough for a nice entry and exit. If you back test the levels we shared every week for the past 24 months, you can see how effectively they were used to trade with or against short/mid term swings and trends.
The swing range give bigger bounces then our weighted levels that's the difference between weighted levels and swing ranges.
BULLISH TARGET
3593 - DONE
EMA5 CROSS AND LOCK ABOVE 3593 WILL OPEN THE FOLLOWING BULLISH TARGETS
3613 - DONE
EMA5 CROSS AND LOCK ABOVE 3613 WILL OPEN THE FOLLOWING BULLISH TARGET
3638 - DONE
EMA5 CROSS AND LOCK ABOVE 3638 WILL OPEN THE FOLLOWING BULLISH TARGET
3658
BEARISH TARGETS
3562
EMA5 CROSS AND LOCK BELOW 3562 WILL OPEN THE FOLLOWING BEARISH TARGET
3528
EMA5 CROSS AND LOCK BELOW 3528 WILL OPEN THE SWING RANGE
3492
3470
EMA5 CROSS AND LOCK BELOW 3470 WILL OPEN THE SECONDARY SWING RANGE
3438
3408
As always, we will keep you all updated with regular updates throughout the week and how we manage the active ideas and setups. Thank you all for your likes, comments and follows, we really appreciate it!
Mr Gold
GoldViewFX

GOLD (XAUUSD): Updated Support & Resistance Analysis
As a bull run continues on Gold,
here is my updated support and resistance analysis.
Resistance 1: 3645 - 3655 area based on 3650 psychological level
Resistance 2: 3695 - 3705 are based on 3700 psychological level
Support 1: 3559 - 3580 area
Support 2: 3511 - 3520 area
Support 3: 3489 - 3500 area
The price is now heading toward Resistance 1.
It looks like it will be reached soon.
❤️Please, support my work with like, thank you!❤️
I am part of Trade Nation's Influencer program and receive a monthly fee for using their TradingView charts in my analysis.

Gold hourly outlookHello, good day,
1H timeframe and personal outlook along with invalidation levels:
The structure is still bullish; we are at the liquidity high, and the 1H buyers’ TP has not yet been touched. (As long as the 1H candle does not close and confirm below 3548, the defined TP for 1H buyers will remain 3606).
Therefore, it can be assumed that from the marked breaker block zone, or with a slight hunt around the 3553 area, a buy trigger could appear for a liquidity grab at the high.
For the invalidation condition: if the 1H candle comes from any of these three support zones toward the high, it should not close above 3600–3606. If it only hunts liquidity, then we can consider the continuation of the move down to the internal liquidity hunt (internal choch). From there, one could again look for a buy trigger, with the 3503 level under the internal choch acting as support.
Personally, I’m watching the breaker block, 3553, and 3543 for buys at the beginning of next week to see how the market reacts to the high

GOLD 1H CHART ROUTE MAP UPDATE & TRADING PLAN FOR THE WEEKHey Everyone,
Please see our updated 1h chart levels and targets for the coming week.
We are seeing price play between two weighted levels with a gap above at 3593 and a gap below at 3562. We will need to see ema5 cross and lock on either weighted level to determine the next range.
We will see levels tested side by side until one of the weighted levels break and lock to confirm direction for the next range.
We will keep the above in mind when taking buys from dips. Our updated levels and weighted levels will allow us to track the movement down and then catch bounces up.
We will continue to buy dips using our support levels taking 20 to 40 pips. As stated before each of our level structures give 20 to 40 pip bounces, which is enough for a nice entry and exit. If you back test the levels we shared every week for the past 24 months, you can see how effectively they were used to trade with or against short/mid term swings and trends.
The swing range give bigger bounces then our weighted levels that's the difference between weighted levels and swing ranges.
BULLISH TARGET
3593
EMA5 CROSS AND LOCK ABOVE 3593 WILL OPEN THE FOLLOWING BULLISH TARGETS
3613
EMA5 CROSS AND LOCK ABOVE 3613 WILL OPEN THE FOLLOWING BULLISH TARGET
3638
EMA5 CROSS AND LOCK ABOVE 3638 WILL OPEN THE FOLLOWING BULLISH TARGET
3658
BEARISH TARGETS
3562
EMA5 CROSS AND LOCK BELOW 3562 WILL OPEN THE FOLLOWING BEARISH TARGET
3528
EMA5 CROSS AND LOCK BELOW 3528 WILL OPEN THE SWING RANGE
3492
3470
EMA5 CROSS AND LOCK BELOW 3470 WILL OPEN THE SECONDARY SWING RANGE
3438
3408
As always, we will keep you all updated with regular updates throughout the week and how we manage the active ideas and setups. Thank you all for your likes, comments and follows, we really appreciate it!
Mr Gold
GoldViewFX

GOLD 4H CHART ROUTE MAP UPDATE & TRADING PLAN FOR THE WEEKHey Everyone,
This is still a follow up update on our 4chart idea which is still valid and in play with the final gap still in range.
Previously we had our Bullish target 3424 and finished off with ema5 cross and lock above this level opening 3499. This gap was filled last week just like we analysed followed with another cross and lock above 3499 opening 3561, which was also hit.
We now finished off last week with a cross and lock above 3561 leaving 3615 open. Failure to test this final target will see lower Goldturns tested for support and bounce.
We will keep the above in mind when taking buys from dips. Our updated levels and weighted levels will allow us to track the movement down and then catch bounces up.
We will continue to buy dips using our support levels taking 20 to 40 pips. As stated before each of our level structures give 20 to 40 pip bounces, which is enough for a nice entry and exit. If you back test the levels we shared every week for the past 24 months, you can see how effectively they were used to trade with or against short/mid term swings and trends.
The swing range give bigger bounces then our weighted levels that's the difference between weighted levels and swing ranges.
BULLISH TARGET
3424 - DONE
EMA5 CROSS AND LOCK ABOVE 3424 WILL OPEN THE FOLLOWING BULLISH TARGETS
3499 - DONE
EMA5 CROSS AND LOCK ABOVE 3499 WILL OPEN THE FOLLOWING BULLISH TARGET
3561 - DONE
EMA5 CROSS AND LOCK ABOVE 3561 WILL OPEN THE FOLLOWING BULLISH TARGET
2615 -
BEARISH TARGETS
3347
EMA5 CROSS AND LOCK BELOW 3347 WILL OPEN THE FOLLOWING BEARISH TARGET
3277
EMA5 CROSS AND LOCK BELOW 3277 WILL OPEN THE SWING RANGE
3234
3171
EMA5 CROSS AND LOCK BELOW 3171 WILL OPEN THE SECONDARY SWING RANGE
3089
2996
As always, we will keep you all updated with regular updates throughout the week and how we manage the active ideas and setups. Thank you all for your likes, comments and follows, we really appreciate it!
Mr Gold
GoldViewFX
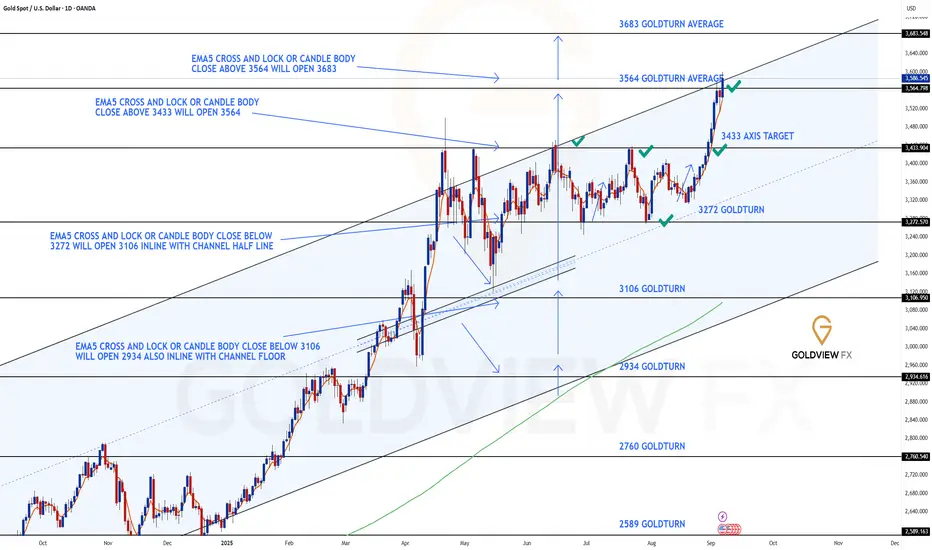
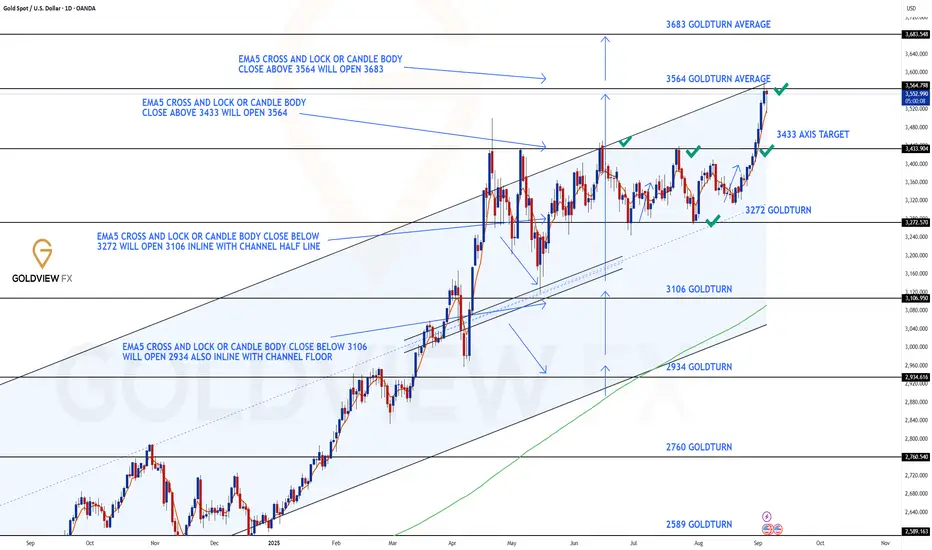
GOLD DAILY CHART ROUTE MAPDaily Chart Update
Range Break, Gap Confirmation & Next Target Achieved
As anticipated in our previous update, price finally pushed through for a test of 3433, confirming the strength of the upside momentum we discussed. This test produced a candle body close gap open for 3564, which has now been successfully achieved just as projected.
The close above 3564 further unlocks 3683 as the next long-term upside target. An EMA5 lock will serve as added confirmation for continuation toward this zone. Meanwhile, both 3564 and 3433 now transition into key support levels for this chart idea.
Current Outlook
🔹 3564 Target Reached
Our gap target has now been completed with a decisive candle body close above. This confirms bullish continuation and shifts focus to the next zone.
🔹 Next Objective – 3683
The successful 3564 break opens a fresh long-term target at 3683. EMA5 lock confirmation will strengthen the case for this move.
Updated Key Levels
📉 Support – 3272 (pivotal floor)
📉 Short Term Supports – 3433 & 3564
📈 Resistance / Next Upside Objective – 3683
Thanks as always for your continued support,
Mr Gold
GoldViewFX
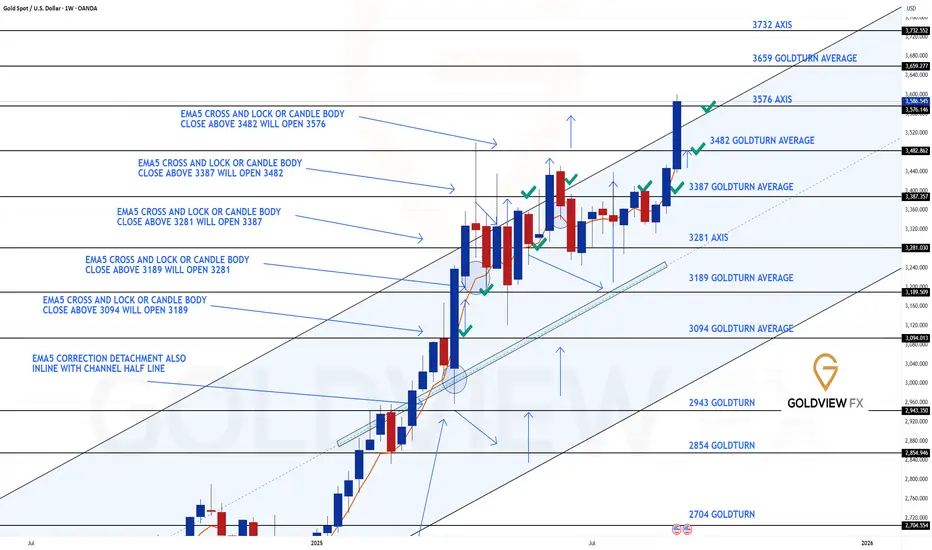
GOLD WEEKLY CHART MID/LONG TERM ROUTE MAPWeekly Chart Update
As anticipated, we got the 3482 gap target hit just as projected. Momentum carried further into the final channel top target at 3576, completing the upper channel move.
Current Outlook
🔹 Gap Targets Achieved
Both 3482 and 3576 have now been met. Price action delivered cleanly into these objectives, validating the prior bullish structure.
🔹 Candle Body Close Above 3576
The weekly body close above the channel top at 3576 has now opened the door to the larger 3659 long-term gap target. EMA5 would provide further confirmation if momentum sustains.
🔹 Channel Top Now Key Test
We need to see 3576 - 3482 (channel top) hold as support to confirm the new range zone play. If it holds, the 3659 - 3732 range becomes the next bullish zone. Failure to provide support above 3482 - 3576 will mean the breakout is short-lived, with risk of a swift correction back down.
🔹 Range Support Levels
3576 and 3482 now act as layered support levels to keep the bullish case intact within this range.
Updated Levels to Watch
📉 Support – 3482 & 3576
Key supports for this new range. Holding above 3576 strengthens the case for continuation toward 3659. A failure back below 3576 puts 3482 into play as the next defensive level.
📈 Resistance – 3659
The newly opened long-term gap target. This becomes the next upside objective if structure holds above 3576.
Plan
With 3482 and 3576 achieved, focus shifts to the 3659 gap. The bullish continuation depends on 3576 holding as support. If buyers defend it, the range extends upward into new territory. If not, expect a sharp corrective move back into the prior range.
Thanks as always for your support,
Mr Gold
GoldViewFX
Best Trend-Following Price Model For Gold XAUUSD Trading
In this article, I will show you a powerful chart setup for profitable trend following trading Gold. I will break down how it works with examples.
Here is how this price model looks:
It is based on 5 important conditions that should be strictly met.
1 - Gold should trade in a global bullish trend.
The price should consistently update Higher Highs HH and Higher Lows HL.
2 - Higher Lows should respect a rising trend line, acting as a support.
It should be respected by at least 3 consequent bullish movements from that.
3 - After a formation of a high above a trend line, the price should start a correctional movement in a minor trend in a bullish flag pattern.
It can be a horizontal, parallel or expanding channel.
4 - Correcting, Gold should test a major rising trend line, being within a flag.
5 - A bullish movement should initiate after a trend line test and the price should break and close above a resistance line of a flag.
When all these 5 conditions are met, we can expect a bullish movement on Gold at least to a level of a current high from where a correction started.
A broken resistance line of a flag and a major rising trend line will compose a safe zone to buy Gold from.
The best time frame for this model will be a daily.
Let's study a real example of such a price model on Gold chart on a daily.
Examine a price chart of Gold on a daily time frame above.
All 5 conditions are met, and we can anticipate a rise to the underlined red resistance.
Our buy zone will be based on a broken resistance of the flag and a major rising trend line.
You can see that our goal was successfully reached.
Here is the proof -
This price model will help you to predict strong bullish waves , trading Gold. A simple combination of a trend analysis and a price action are the 2 basic components that you need to study to identify that properly.
❤️Please, support my work with like, thank you!❤️
I am part of Trade Nation's Influencer program and receive a monthly fee for using their TradingView charts in my analysis.

GOLD WEEKLY CHART ROUTE MAP UPDATEHey Everyone,
After completing our 1h, 4h and daily chart ideas this week, please now see update on our weekly chart idea, which we also smashed into pips!!!
As anticipated -
This time, bulls followed through in full force:
✅ We got our Target Hit at 3482 after confirming the gap from the body close above 3387.
✅ To finish the week on a high, we also completed our long-range axis target at 3576, which has been highlighted on the chart since the beginning of our tracking on this chart idea.
🔹 3482 Gap Target Achieved
The upside gap has now been fully confirmed and met.
🔹 Axis Target 3576 Completed
The higher-timeframe target we’ve tracked since the start has been fulfilled, marking a strong close to the week.
With both the 3482 gap and 3576 axis target achieved, the bullish roadmap we’ve tracked has now played out to completion. Near-term, we’ll watch how price reacts around 3576. A strong close above could open fresh upside extensions, while failure here may trigger a healthy pullback toward 3387 for retest.
We will now come back Sunday with a full multi timeframe analysis to prepare for next week’s setups, including updated views on the higher timeframes, EMA5 alignments, and structure expectations going forward.
Thanks again for all your likes, comments, and follows.
Wishing you all a fantastic weekend!!
Mr Gold
GoldViewFX

DAILY CHART ROUTE MAP UPDATEHey Everyone,
After completing our 1h and 4H chart this week, please now see update on our daily chart idea that we have been tracking. This chart idea has also played out to perfection!!
Sunday we advised that 3433 had now produced a candle body close above this level leaving gap target open for 3564 - This target is now complete!!
🔹 GAP TARGET 3564 - DONE
We will now look for a body close and/or ema5 cross and lock above this level to confirm a continuation. Failure to lock will confirm a rejection into the lower Goldturns for support.
Thanks as always for your support.
Mr Gold
GoldViewFX
Good News and Bad News for Gold as It Hits Record HighsAs gold continues to surge to record highs (~$3600) , two major risks exist that could impact its momentum—one potentially positive, and the other negative.
The Potential Removal of Trump's Tariffs
A federal appeals court recently ruled that Trump’s tariffs, imposed under the International Emergency Economic Powers Act, were unlawful. As a result, U.S. businesses have paid over $210 billion in tariffs that are now considered illegal.
Trump’s administration is preparing an appeal to the Supreme Court, and if the tariffs are reversed, it could reduce Treasury revenue. This could lead to increased borrowing, potentially putting downward pressure on gold prices.
Concerns Over the Fed's Independence
Concerns about the Federal Reserve's independence also pose a risk to gold. If these concerns grow, markets could price in a higher risk premium against the dollar, which could boost gold’s appeal.
Helping to moderate these concerns, at least for now, two Republican senators recently announced they would block any replacement for Fed Governor Lisa Cook until her lawsuit over her firing is resolved.

GOLD 4H CHART ROUTE MAP UPDATEHey Everyone,
After wrapping up our 1H chart idea, here’s the update on the 4H chart we shared Sunday. Absolute perfection. We saw the EMA5 cross and lock above 3424, which opened 3499, target hit. Then another EMA5 cross and lock above 3499 opened 3561, also hit perfectly, right to the point.
We were able to map a range target without any historical data, relying on the law of averages and it played out beautifully.
From here, we now need an EMA5 cross and lock above 3561 to open 3615. Failure to lock will likely see lower Goldturns tested for support and bounce.
We will keep the above in mind when taking buys from dips. Our updated levels and weighted levels will allow us to track the movement down and then catch bounces up.
We will continue to buy dips using our support levels taking 20 to 40 pips. As stated before each of our level structures give 20 to 40 pip bounces, which is enough for a nice entry and exit. If you back test the levels we shared every week for the past 24 months, you can see how effectively they were used to trade with or against short/mid term swings and trends.
The swing range give bigger bounces then our weighted levels that's the difference between weighted levels and swing ranges.
BULLISH TARGET
3424 - DONE
EMA5 CROSS AND LOCK ABOVE 3424 WILL OPEN THE FOLLOWING BULLISH TARGETS
3499 - DONE
EMA5 CROSS AND LOCK ABOVE 3499 WILL OPEN THE FOLLOWING BULLISH TARGET
3561 - DONE
BEARISH TARGETS
3347
EMA5 CROSS AND LOCK BELOW 3347 WILL OPEN THE FOLLOWING BEARISH TARGET
3277
EMA5 CROSS AND LOCK BELOW 3277 WILL OPEN THE SWING RANGE
3234
3171
EMA5 CROSS AND LOCK BELOW 3171 WILL OPEN THE SECONDARY SWING RANGE
3089
2996
As always, we will keep you all updated with regular updates throughout the week and how we manage the active ideas and setups. Thank you all for your likes, comments and follows, we really appreciate it!
Mr Gold
GoldViewFX

Gold Price Reaches a New All-Time HighGold Price Reaches a New All-Time High
As shown on today’s XAU/USD chart, the price of gold has risen above $3,530 per ounce for the first time in history.
In 2025, the increase in gold prices has been driven by sustained central bank purchases, asset diversification, steady demand for so-called safe-haven assets amid geopolitical and trade tensions, as well as general dollar weakness.
At the beginning of September, bullish sentiment may have been reinforced by:
→ Expectations of a Federal Reserve rate cut. According to the CME FedWatch tool, markets are pricing in a nearly 92% probability of a 25-basis-point rate cut at the Fed meeting on 17 September. Gold, as a non-yielding asset, is typically seen as a beneficiary of low interest rates.
→ News from China, where, in the presence of leaders from many countries, the establishment of a SCO development bank was announced. Market participants may have interpreted this as a new source of geopolitical risk and as pressure on the dollar’s status. Donald Trump has already claimed that the summit in China represents a conspiracy against the United States.
Technical Analysis of the XAU/USD Chart
Looking at gold’s price on 11 August, we:
→ Drew descending lines forming a red channel.
→ Highlighted an important support zone in the form of a bullish Fair Value Gap (marked as FVG1 in purple).
New data allows for the following observations:
→ FVG1 acted as support in the second half of August.
→ The red channel lines resemble a large-scale bullish flag pattern within a long-term uptrend, underscored by the EMA.
By using the July and August extremes, we can trace the outlines of an upward trajectory (shown in blue). The price is currently near the upper boundary, which could trigger a pullback, given overbought signals on the RSI indicator and investors’ potential desire to take profits after more than a 6% rise over the past 10 days.
From a bullish perspective, a possible pullback target could be the potential support area formed by:
→ FVG2. Although it does not strictly conform to construction rules, it reflects an imbalance in favour of buyers that led to a sharp price rally. Bears attempted to resist around the psychological $3,500 level but were defeated.
→ Level C, representing the 50% Fibonacci retracement of the A→B impulse.
It should be noted that the upward impulse has not yet been exhausted, as indicated by the green lines.
This article represents the opinion of the Companies operating under the FXOpen brand only. It is not to be construed as an offer, solicitation, or recommendation with respect to products and services provided by the Companies operating under the FXOpen brand, nor is it to be considered financial advice.
GOLD UPDATE VIEW – XAUUSD Eyes 3540 as Bullish Momentum Builds As highlighted in this morning’s analysis, Gold continues to show impressive strength while the USD weakens on expectations that the FED will cut rates soon. This is driving capital away from cash and back into Gold as a safe-haven asset.
🔎 Current Market Update
After consolidating around 3480 – 3490, Gold has now broken out strongly, moving towards the buy-side liquidity zone (3509 – 3515).
The overall structure remains bullish, with no clear signs of reversal yet.
Market is likely to test liquidity around 3509 – 3515, and if momentum holds, the next big target sits at the 3540 resistance zone.
📊 Updated Trade Plan
BUY ZONE (trend-following): 3488 – 3485
SL: 3480
TP: 3500 – 3509 – 3515 – 3530 – 3540
SELL ZONE (high risk): 3540 – 3543
SL: 3550
TP: 3530 – 3520 – 3510
👉 Current market conditions favour buying pullbacks in line with the trend. Consider shorting only if there is strong confirmation around 3540.
⚠️ Risk Note
Volatility remains very high, with sudden liquidity grabs possible. Always stick to TP/SL levels to protect your account.
💡 Summary: Gold’s bullish momentum remains intact. As long as the FED outlook supports rate cuts and USD stays weak, Gold is likely to keep climbing, with 3540 as the key upside target.
✅ Follow MMFLOW TRADING for daily market insights and updated trade plans on Gold.

GOLD H1 STRUCTURE Gold Buying Zones We Have
TRENDLINE BUY : 3503
FVG AREA BUY : 3509, 3492
ORDER BLOCK : 3448, 3442
ORDER BLOCK : 3408, 3403
These Are Our Buy Zones
Hope You Understand Thanks For Here Follow Us For More

GOLD (XAUUSD): The Next Potential Resistances
As Gold is now trading in a no man's land, here are
2 potentially strong resistances that I spotted.
Psychological Resistance 1: 3550
Psychological Resistance 2: 3600
The price is heading toward Resistance 1.
It will most likely be the next goal for the buyers.
❤️Please, support my work with like, thank you!❤️
I am part of Trade Nation's Influencer program and receive a monthly fee for using their TradingView charts in my analysis.
