GOLD FALTERS POST-FOMC – BUY OR SELL NOW?1. Market Context
Yesterday, the market had a risk-averse sentiment, so safe-haven flows poured into gold, pushing the price to test the resistance area of 4130–4133 – where gold had previously failed multiple times.
During the US session, the FOMC minutes were released with a rather "hawkish" tone:
The Fed is not yet ready to cut interest rates.
Wants to see more data before December.
Some members even want to maintain a tighter stance.
This news weakened gold's upward momentum, and the price adjusted down from the peak.
2. BUY Zones for the Day
🎯 Ideal BUY (highest priority):
4010
3998
🎯 Extended BUY:
4010 – 4015
4035 – 4040
→ These are reliable support zones, suitable for a trading style that catches the rebound.
3. SELL Zones
🔥 Strong SELL (hard resistance):
4130 – 4133
🔥 Extended SELL:
4148 – 4150
→ Both zones coincide with resistance that has reacted well multiple times before.
4. Special Zone to Watch – TREND DECISION
📌 4080 – 4085 (Fibo 0.5 – 0.618)
If the price clearly breaks 4085, gold may change trend for the day → prioritize BUY on breakout, limit SELL.
If 4085 holds, the market remains sideways within the range and continues the strategy of BUY support – SELL resistance.
5. Suggested Trading Strategy
Style: SL 10 points – TP 10 points
Priority: BUY at clear support – SELL at strong resistance
Avoid trading in the middle zone (noise – easy to hit SL).
Place orders only when the price hits the zone – don't fomo in between.
Goldtrading

Once again, perfectly capturing gold trading opportunitiesIn yesterday's gold strategy, we emphasized the rebound correction at the 4000 level and the short position at 4080, and the market action has fully materialized! Congratulations to those who followed our advice.Gold is currently dominated by bears, and the overall structure remains weak. Short-term support levels to watch are the 4040-4030 area and strong support around 4000. Resistance remains concentrated in the 4080-4100 area. If the price rebounds to this area and fails to break through, short positions can still be considered. In short, the core logic for today remains unchanged: a weak, downward-trending market. Trading should focus on the aforementioned support and resistance levels, patiently waiting and positioning. The slower pace of the market movement means a longer trading cycle, thus requiring more patience in executing each trade. Until the trend changes, our overall strategy remains to primarily short at higher levels during rebounds, supplemented by buying on dips, proceeding steadily and following the trend.

Gold bulls rallied to reverse the trend; what's next?We perfectly timed both our long and short positions in gold, exiting all positions with profits. Now that gold is rebounding again, we should avoid shorting again and patiently observe the resistance levels above, especially the 4100-4110 area. Whether gold can break through this resistance remains to be seen. If your current trading is not going well, and we hope to help you avoid common pitfalls, feel free to contact us for discussion!
Based on the current gold price trend, we should first focus on the short-term support area around 4050-4030, and the resistance area around 4100-4110. The overall strategy should be to sell on rallies within this range. In the middle range, it's best to observe more and trade less, avoiding chasing the market. Wait patiently for key entry points. Specific trading strategies will be provided at the bottom; please pay close attention.

GOLD 1H CHART ROUTE MAP UPDATE & TRADING PLAN FOR THE WEEKHey Everyone,
Please see our updated 1h chart levels and targets for the coming week.
We are seeing price play between two weighted levels with a gap above at 4114 and a gap below at 4057. We will need to see ema5 cross and lock on either weighted level to determine the next range.
We will see levels tested side by side until one of the weighted levels break and lock to confirm direction for the next range.
We will keep the above in mind when taking buys from dips. Our updated levels and weighted levels will allow us to track the movement down and then catch bounces up.
We will continue to buy dips using our support levels taking 20 to 40 pips. As stated before each of our level structures give 20 to 40 pip bounces, which is enough for a nice entry and exit. If you back test the levels we shared every week for the past 24 months, you can see how effectively they were used to trade with or against short/mid term swings and trends.
The swing range give bigger bounces then our weighted levels that's the difference between weighted levels and swing ranges.
BULLISH TARGET
4114
EMA5 CROSS AND LOCK ABOVE 4114 WILL OPEN THE FOLLOWING BULLISH TARGETS
4175
EMA5 CROSS AND LOCK ABOVE 4175 WILL OPEN THE FOLLOWING BULLISH TARGET
4232
EMA5 CROSS AND LOCK ABOVE 4232 WILL OPEN THE FOLLOWING BULLISH TARGET
4289
EMA5 CROSS AND LOCK ABOVE 4289 WILL OPEN THE FOLLOWING BULLISH TARGET
4361
BEARISH TARGETS
4057
EMA5 CROSS AND LOCK BELOW 4057 WILL OPEN THE FOLLOWING BEARISH TARGET
4006
EMA5 CROSS AND LOCK BELOW 4006 WILL OPEN THE FOLLOWING BEARISH TARGET
3965
EMA5 CROSS AND LOCK BELOW 3965 WILL OPEN THE SWING RANGE
3923
3861
As always, we will keep you all updated with regular updates throughout the week and how we manage the active ideas and setups. Thank you all for your likes, comments and follows, we really appreciate it!
Mr Gold
GoldViewFX

SILVER (XAGUSD): Bullish Continuation After Pullback
There is a high chance that Silver will go up from the underlined support.
A bullish breakout if a neckline of an inverted head & shoulders pattern
provides a strong confirmation.
Expect a rise to 53.2 level.
❤️Please, support my work with like, thank you!❤️
I am part of Trade Nation's Influencer program and receive a monthly fee for using their TradingView charts in my analysis.

Gold pullback on November 19th: Buy on dips!The 1-hour moving average for gold has turned upwards, indicating continued upward momentum. After breaking through and stabilizing above 4100, gold is currently exhibiting a steady upward trend on the 1-hour chart. The 4090 area has formed short-term support, and buying on dips to this level presents a buying opportunity.
Gold: Buy at 4090, stop-loss at 4078, target 4150-4160;
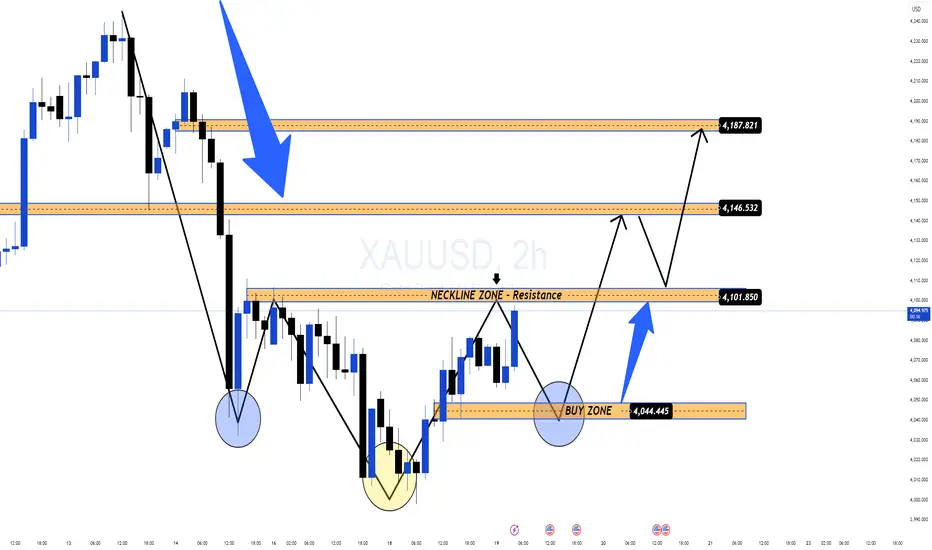
Gold Forms Inverted Head & Shoulders: Reversal Signal!After a short-term corrective decline, the $4,000 level has triggered strong BUY momentum, creating a clear price rebound at the end of yesterday's session. The increase in buying volume indicates that the BUY side is returning to the market after several sessions of being pushed down.
📊 Prominent Technical Structure
On the 2H chart, gold is completing the Inverted Head & Shoulders pattern – one of the strongest bullish reversal patterns.
• Head: liquidity bottom at 4,00x
• Two shoulders: forming symmetrically with good bounce
• Neckline: area 4,101–4,102, currently a key resistance
Price is likely to:
1️⃣ Slightly adjust to the neckline area or BUY ZONE 4,044–4,046
2️⃣ Retest – Accumulate – Confirm breakout
3️⃣ Break out towards 4,146 → 4,187 when the pattern is complete
🎯 Short-term Expectations
Volatility may increase ahead of upcoming economic data, so the reasonable strategy remains:
✅ Prioritize BUY according to the pattern
• Wait for retest of neckline or area 4,044–4,046
• Observe confirmation force (Volume – Momentum – Rejection)
• Target towards 4,146 → 4,187 if the pattern is activated
⚠️ Note
– The reversal trend is only truly confirmed when the price clearly breaks the 4,101–4,102 area.
– Market sentiment currently leans towards recovery, but clear signals are needed before entering large (long-term HOLD) positions.
XAUUSD – HEAD AND SHOULDERS PATTERN FORMING ON H4💛 XAUUSD – HEAD AND SHOULDERS PATTERN FORMING ON H4 🎯
🌤 Overview
Hello everyone, it's Lana here again 💬
Gold, after a strong decline, is forming a clear Head and Shoulders structure on the H4 timeframe, following a long-term upward trendline. This pattern allows us to expect a rebound to the old peak area, but before that, the price may "dip" down to complete the structure.
💹 Technical Analysis (ICT Perspective)
The Left Shoulder – Head – Right Shoulder is gradually completing around the trendline + supporting FVG.
The area around the 50% Fibonacci above is a reasonable zone for the price to form the right shoulder, and if it breaks above the neckline, it could pave the way back to the strong liquidity area above 4200.
In the short term, the 4118–4120 area is both resistance + the neckline of the pattern, suitable for a technical Sell.
The 4040–4042 area coinciding with the trendline + OB is a nice support to watch for a Buy if the price adjusts deeply.
🎯 Reference Trading Plan
💢 SELL Scenario (scalping at resistance)
Sell 4118–4120 │ SL: 4125
TP: 4105 → 4086 → 4060 → 4040
💖 BUY Scenario (priority according to the pattern)
Buy 4042–4040 │ SL: 4034
TP: 4075 → 4090 → 4100 → 4140 → 4200
⚠️ Important Notes
Trading according to the pattern is just an expectation trade, so it should be combined with candle signals on smaller timeframes (M15–M30) before entering a trade.
The upcoming FOMC meeting and NFP report, after a prolonged US government shutdown, could lead to very unpredictable volatility.
Reduce volume, avoid holding large positions through major news events.
🌷 Conclusion with LanaM2
The Head and Shoulders pattern on H4 is opening up beautiful opportunities for both short Sell and Buy according to the larger trend 💛
Be patient and wait for the price to reach the marked areas, be disciplined with SL, and don't FOMO before the news.
If you find this useful, please 💛 Like – 💬 Comment – 🔔 Follow LanaM2 to update the gold perspective with me every day ✨

Will gold prices fall again after bottoming out and rebounding?Gold Technical Analysis: Gold prices initially fell below 4000 today, but rebounded during the US session. A significant reversal in initial jobless claims data propelled gold to around 4082, reversing the overall downward trend and pushing prices back into range-bound trading. While there were intraday rebounds, gold ultimately met resistance and fell, with higher highs continuing to decline, indicating a clear overall weakness. As I repeatedly emphasized yesterday, gold was poised for a drop, and I stressed the 4100 resistance level. I also repeatedly highlighted the strategy of selling on rallies. The key resistance level to watch is the 4080-4100 range, which was the sideways trading area at the end of yesterday's session.
Currently, the bears still have the upper hand. The short-term effective support is in the 4000-3990 range, while the resistance has been emphasized in the 4080-4100 area. If this area is touched again, another short position can be taken. In short, today's theme is still a weak downward trend with fluctuations. In terms of operation, you can wait for entry based on the above support or resistance levels. The slowdown in the fluctuation pace has extended the market cycle, so every entry requires sufficient patience.

Short first, then long; perfectly grasping the market rhythm.On Tuesday, the bottoming strategy suggested that gold should pay attention to the 4000 level for a rebound and correction. As expected, it rebounded to around 4040. After the opening, a short position was arranged at 4052, which reached the profit target of 4030 as expected. Then, a long position was arranged at 4000, which was closed at 4015. The intraday strategy was to first short and then long, reaping a profit of 37 pips!
Gold prices continued their weak opening on Tuesday, with selling pressure emerging after breaking below short-term moving averages yesterday. Although delayed data such as the September non-farm payrolls will be released this week, the results may reinforce the Federal Reserve's stance of holding rates steady, putting continued pressure on gold prices. Overall, gold prices are likely to adjust this week. With no major data releases today, the market focus is on speeches by Federal Reserve officials and changes in expectations for interest rate cuts.
Gold's technical outlook remains bearish. The hourly chart is still within a standard downward channel. After rebounding to around 4055 at the open, it fell back again, indicating a weak corrective structure. No effective reversal signal has been seen in the short term. The strength or weakness of the European session will be the key observation point for today's trend. The watershed above is still the 4045-4070 area. As long as the price continues to be pressured below this range, the bearish structure is likely to continue. The first support level to watch is the 4000 mark. If it breaks down effectively, the bearish target will continue to be around 3980. In terms of trading strategy, if there is a rebound to the 4045-4070 area before or after the European session, consider shorting gold in batches, following the channel structure. The overall outlook remains bearish.

How to properly seize gold trading opportunities?Gold Technical Analysis: Reviewing yesterday's gold price performance, it showed a clear downward trend overall. Specifically, the gold price moved downwards along the five-day moving average. This trend often suggests a short-term weak market from a technical analysis perspective. During the US session, the gold price experienced a significant decline, which undoubtedly exacerbated the tense atmosphere in the market.
From the daily chart analysis, gold closed yesterday with a medium-sized bearish candlestick with upper and lower shadows. This candlestick pattern contains a wealth of market information. The presence of the upper and lower shadows indicates that both the bulls and bears exerted their strength briefly during the struggle, but ultimately the bears prevailed, pushing the price lower and closing with a bearish candlestick. This forms a "three-day losing streak" pattern on the daily chart, indicating a short-term weak trend. From a trend perspective, the bearish pattern in the gold market remains unchanged.
Based on the above technical analysis and market trends, we can make a reasonable prediction for the future price movement of gold. We expect the price to further test the support level of the daily chart's lower trendline. Therefore, our trading strategy for today remains unchanged: shorting on rallies. Specifically, we will focus on the 10-day moving average as our entry point for shorting. On the downside, we will first look at yesterday's low. If the price breaks below yesterday's low, we can expect it to fall further. Taking into account various factors, we have identified the following specific resistance and support levels. The resistance levels are 4050-4070 and 4100, respectively. These levels have historically exerted downward pressure on prices and are key resistance areas that we need to pay close attention to during trading. The support levels are 4005-3980 and 3930, respectively. These levels are crucial points where prices may find support and rebound. Regarding trading recommendations, we suggest entering short positions in the 4050-4070 range. It is important to note that the market is fraught with uncertainty and risk, and the above trading strategy is for reference only. When making investment decisions, investors should fully consider their own risk tolerance and investment goals, and make decisions prudently. We hope every investor can have good luck in the market and achieve their investment goals. In summary, today's gold trading strategy is to primarily sell on rallies and secondarily buy on dips. The key resistance level to watch in the short term is 4050-4070, and the key support level is 4005-3980. Please keep up with the pace.

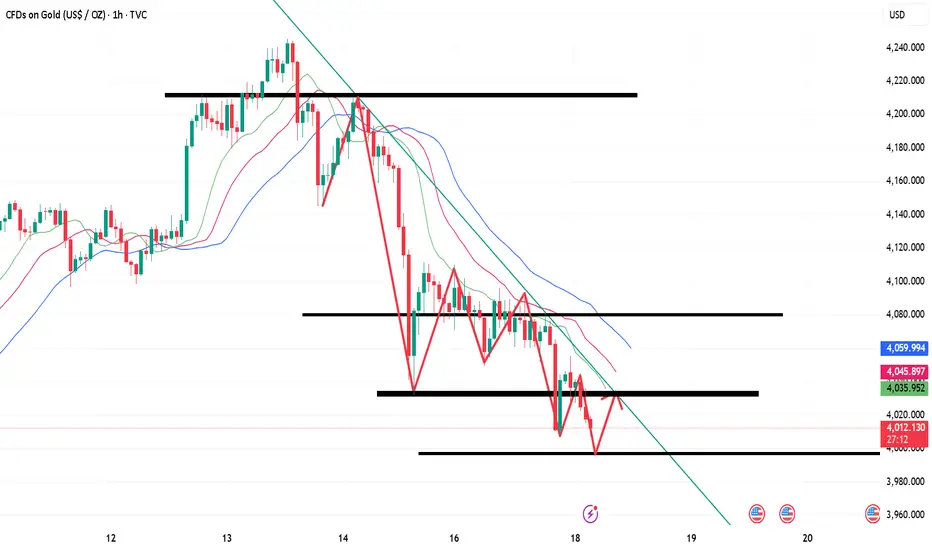
Gold Short-Term Trading Guide (November 18th)!!!The US released some unemployment claims data, and gold briefly broke through 4000 before experiencing a strong rebound. Is this rebound merely a flash in the pan due to the data, or will it help reverse the gold bullish trend?
First, we should note that gold is still generally weak. The 1-hour moving averages are still in a bearish crossover, indicating continued downward momentum. Gold is also still trading within a 1-hour downtrend channel. If gold continues to trade within this channel, the overall trend will likely remain one of oscillating decline. The upper resistance level of the 1-hour downtrend channel has now moved down to around 4068. If gold rallies below 4068, the strategy remains to sell on rallies.
Gold prices naturally fluctuate, just like the tides. Volatility creates opportunities. If gold cannot break through the 4068 level, the rebound may be short-lived. Until a break above 4068 is achieved, continue to sell on rallies.
US Session Trading Strategy:
Sell gold at 4060, stop loss at 4070, target 4000-3980;

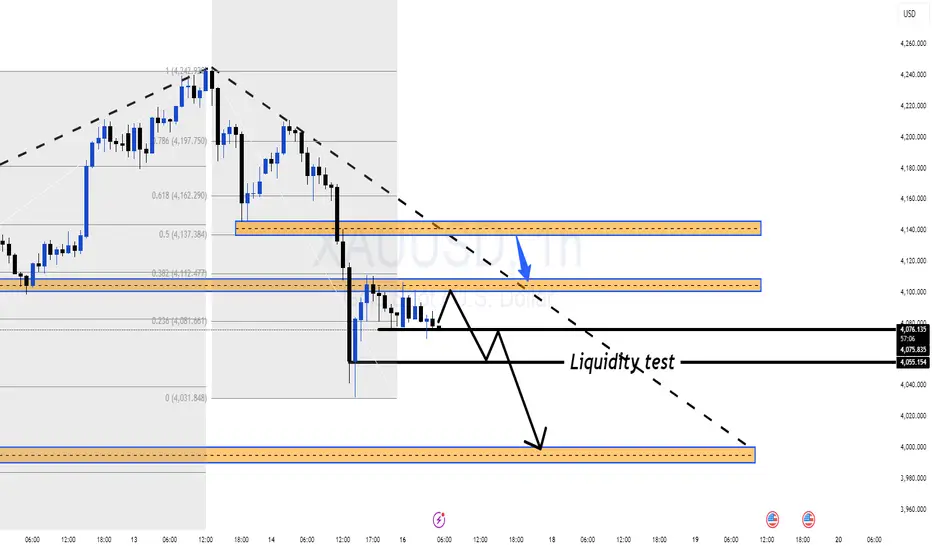
Gold Stuck Below 4,050$: Bears Eye a Liquidity Flush Under 4,000🔍 Market Context
Gold has been under pressure for four consecutive sessions as expectations for a December Fed cut fade.
The Dollar is supported by growth worries but not strong enough to trigger a clean risk-off bid into gold.
Result: XAU/USD keeps hovering near weekly lows, with sellers patiently watching the 4,000$ liquidity shelf.
📊 Technical Structure – H1 (MMFLOW View)
Overall bias remains bearish, with price capped by a descending trendline from the recent 4,24x high.
Price is compressing inside a tight 4,053–4,000$ distribution range, which also aligns with a Volume Profile POC around 4,053$.
The last leg down is tracked with Fibonacci extensions:
Key downside liquidity cluster: 3,945$ → 3,876$ (1.272–1.618 extensions).
Current PA looks like a bear flag / tight consolidation under resistance – a classic setup for either:
a clean break below 4,000$ into deeper liquidity,
or a shakeout dip into demand before a sharp short-covering bounce.
In short: gold is coiling under POC 4,053$, preparing either a final flush to 3,945–3,876$ or a squeeze back into the old value area.
🎯 Idea Scenarios (for study, not signals)
Scenario 1 – Trend Continuation: Break of 4,000$
As long as H1 closes stay below 4,053$, bearish bias is valid.
A decisive break and retest failure at 4,000$ opens the door toward:
🎯 3,945$ – first liquidity pocket / 1.272 ext.
🎯 3,876$ – deeper liquidity / 1.618 ext. & key demand.
For existing shorts from higher, those zones are logical areas to scale out / manage exits.
Scenario 2 – Liquidity Sweep Then Short-Covering Bounce
If price spikes into 3,945$ ± a few dollars and shows:
long downside wicks, or
clear M15–M30 rejection structure,
Gold could stage a counter-trend rebound toward:
4,000–4,015$, then 4,053$ (POC), and potentially 4,098$ if momentum extends.
This would be a liquidity-reaction play, not a confirmed trend reversal unless bulls reclaim and hold above 4,098$.
Invalidation of the bearish view
A sustained move with H4 closes above 4,098$ would weaken the current down-structure and force a reassessment of the medium-term bias.
⚜️ MMFLOW TRADING Insight
When price is trapped under POC, patience beats FOMO.
Let the market either:
break and accept below 4,000$, or
reclaim 4,053$–4,098$
…before committing heavily.
Bears still have the upper hand, but bulls will only regain narrative if they defend 3,945–3,876$ and push price back into the old value area.
“In a downtrend, your job isn’t to call the bottom – it’s to sell weak rallies and let liquidity do the heavy lifting.”

Gold pullback on November 18th, expect a rebound.Gold prices are trading around 4015. For short positions, watch the 4050 level; a move to short at this level would be a good entry point. This level represents the low point of the initial upward move at the beginning of the week and has now become effective resistance. Hold this area for shorting. The 8-hour uptrend line provides support around 3993. If the price breaks below this uptrend line, the downtrend could accelerate, potentially reaching as low as 3924. Focus on shorting today; hold short positions below 4053 and prepare to maximize profits! Weak outlook! Specific and more winning entry points will be provided during the trading session! Take profits on the short positions!
#Intraday Strategy: Hold short positions below 4050 and maximize profits! Weak outlook!
Focus on the 3995-4005 range, a key support/resistance level!
It's not that the market is good.We made the right call.Federal Reserve Governor Robert Waller stated that he supports another rate cut at the December meeting due to growing concerns about a sharp slowdown in the labor market and employment. Waller said, "I'm not worried about accelerating inflation or a significant rise in inflation expectations. My focus is on the labor market. After several months of weakness, the September jobs report later this week or any other data in the coming weeks is unlikely to change my view that another rate cut is necessary." Waller specifically noted that he favors another 25 basis point cut. He stated, "I'm concerned that restrictive monetary policy is putting pressure on the economy, especially its impact on low- and middle-income consumers. A rate cut in December would provide additional protection against a faster weakening of the labor market and move policy in a more neutral direction." At the same time, he indicated that price data suggests tariffs will not have a long-term impact on inflation, and another rate cut would be a risk management approach.
The overall tone was neutral, and gold's technical indicators also showed a downward breakout. The next step is to continue the downward trend with consolidation, and the 4000 level will soon be tested. I will focus on the timing of shorting here. The price is severely oversold in the short term, so aggressive shorting is not advisable. The first resistance level to watch is the 4050-4070 area, followed by the 4100 level. Support lies at 4000-3980; a break below this level could see a further 100 USD drop to the 3900-3880 area. The Bollinger Bands on the daily chart are gradually tightening, awaiting the release of the non-farm payroll data to determine the medium- to long-term direction. Currently, the overall strategy remains to follow the technical trend and sell on rallies. For strategy: short gold in batches at 4050-4070 with a target of 4020-4000 (hold if it breaks through). A second short entry point is at 4095-4100. For a short-term long opportunity, watch the 4000 level (short-term counter-trend long positions should target a 15-20 USD profit).

Gold bulls are losing momentum Arebound means continuingto shortLast week, the longest government shutdown in the US ended. Key economic data will take time to be released, and Federal Reserve officials have been releasing hawkish signals, reducing the probability of a December rate cut. Gold prices rose overall, boosted by a weaker dollar and safe-haven demand, reaching a high of $4245 last week. Silver followed a similar trend but rose even more, once increasing by nearly 10%. On Friday, both spot gold and silver experienced a rapid drop, narrowing the weekly gains. Gold, which reached a high of around $4210, plummeted to around $4030, a drop of up to $180. With the government shutdown over, market trends are likely to change. Gold's historical high of $4381 this year is unlikely to be surpassed this year, and even if it is, it will likely be next year. In my view, last week's high of $4245 was a secondary high. The upward trend that began on October 1st when the shutdown started is coming to an end, and a pullback to the starting point of this upward trend, around $3850, where the shutdown began, is possible.
As seen on the daily chart, gold's short-term support is currently at 4050. Since last Friday, this level has not been breached. As long as 4050 holds, gold is likely to continue oscillating within the 4050-4100 range for a few more days. However, it's important to note that if the daily chart breaks below 4050, caution is advised, as the move could accelerate, potentially targeting the 4000-3900 range. A break below 3900 would likely lead to a return to the starting point around 3850. If strong support is found, it would likely be around 3850-3800.
Secondly, looking at the short-term 4-hour chart, if gold fails to break below 4050, the next resistance levels are around 4080 and 4100. The immediate target is the 4050-4105 range. If it returns above 4100 today, it could reach around 4110. However, it's crucial that 4100 is not breached and held. If it reverses and breaks the high of 4110 from last Friday night's rebound, gold might test 4150, which could be considered the limit of this rebound. This possibility exists and should not be ignored. Of course, the overall trend is bearish, and unless it returns to the 3850-3800 range, avoid rushing into long positions.

4002 or 4161?By examining the gold chart on the 4-hour timeframe, you can see that the price has returned to the top of that important level after not breaking the resistance of 4161 and is currently trading in the range of 4071. If the price consolidates above the 4046 range, we can expect the price to rise to 4105 and 4161. The second scenario is that if gold can reach the bottom of 4046 in the last hours of the working day, we can have a fall to the important level of 4002. This analysis will be updated.
با بررسی چارت طلا در تایم فریم 4 ساعته مشاهده میکنید که قیمت پس از آن که مقاومت 4161 رو شکست نتونست دیگه به بالای اون سطح مهم برگرده و الان در حال حاضر در محدوده 4071 درحال معامله میباشد .
در صورت تثبیت قیمت بالای محدوده ی 4046 میتونیم انتظار رشد ثیمت را تا 4105 و 4161 رو داشته باشیم.
سناریو دوم هم این است که اگر طلا در آخرین ساعات روز کاری بتواند خودشو به پایین 4046 برساند میتونیم ریزش را تا سطح مهم 4002 داشته باشیم.
این تحلیل به روز رسانی خواهد شد

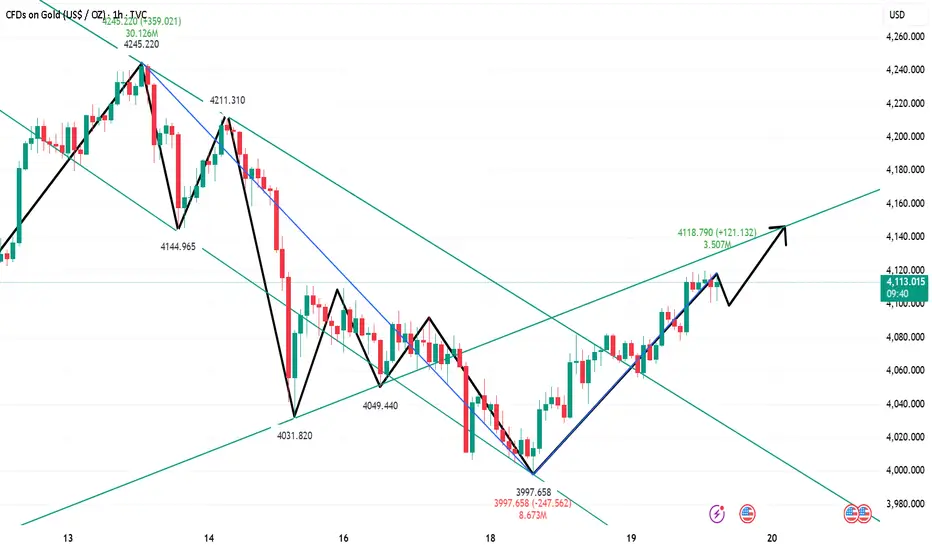
XAUUSDHello Traders! 👋
What are your thoughts on GOLD?
Gold completed the expected bullish correction, reached the resistance zone and the broken trendline, and was strongly rejected from that area.
This rejection confirms continued bearish pressure in the market.
In the current region, we expect gold to move through a period of sideways consolidation, followed by a continuation of the downward move toward lower levels.
As long as the price remains below the resistance zone, the medium-term outlook stays bearish, and further downside movement is favored.
Don’t forget to like and share your thoughts in the comments! ❤️

Gold is expected to rise and then fall in the short term.After opening today, gold was pressured down by the 4110 area, finding support at around 4050 and rebounding. The 1-hour and 4-hour charts show severe oversold conditions, indicating a clear short-term stabilization. Therefore, overall, while maintaining a bearish outlook for gold, a short-term rebound is likely, with a high probability of further declines.
Key resistance remains at the 4110 area, followed by the 4140-50 area. A sustained bearish stance is warranted; an unexpected upward breakout could extend the rebound, but a decline is still expected. Key support during the European session is at the 4050 area, with the 4030-40 area being a short-term key level. A break below this level would likely lead to further declines towards the 3980-3950 and 3915 areas.
Gold's upward momentum is weak, so shorting is the only option.Gold Technical Analysis: Gold suddenly entered a downtrend at the end of last week, with a target price around 4210. On Friday, it reached a high of around 4211 before retreating, breaking below 4100 to around 4032, resulting in a large bearish candlestick on the daily chart. The question now is whether this downward trend will continue. The daily chart shows a consistent decline in highs, suggesting that the resistance level at the three key points could easily trigger a second downward reversal. Therefore, we should expect a pullback at the beginning of this week. Therefore, at the beginning of this week, we definitely expect gold prices to continue falling. However, since the fast and slow lines are still above the zero axis, even if prices fall, it will only be a pullback. Looking at the candlestick chart, the trendline support is around $4,000, which is both our target for shorting this week and a place to try to place long orders. If it breaks down, it may test the lower Bollinger Band at $3,890. However, it should be noted that the halfway resistance level of Friday's full-blown bearish candlestick is at $4,130, which is also the highest point of the rebound in the two days following the sharp drop on October 21. If gold prices break through this level again, it will mean the end of this round of pullback.
Gold rebounded slightly after the opening but continued to face pressure at higher levels and fell back again. In the short term, the 4110-4120 area has formed effective resistance. If the rebound is still pressured by the 4110-4120 area, then the gold rebound is extremely weak, and there may be some room for further adjustment. However, even if the gold rebound is slightly stronger, the resistance below 4150 still indicates a head and shoulders pattern on the 1-hour chart, favoring a short-term bias towards range-bound selling. Today's core strategy should be to sell on rallies. Although there was a technical rebound after Friday's sharp drop, the rebound strength was limited. As long as it cannot break through the key resistance of $4120, any rally is an opportunity to short. It is necessary to pay close attention to whether the rebound shows signs of exhaustion. If the rebound of the right shoulder is insufficient, the head and shoulders pattern will be officially established, and the gold price may face a deeper decline. Therefore, today's strategy is still to sell on rallies.

What's next for gold after its sharp drop?Gold Technical Analysis: Last week's gold market was incredibly exciting, like riding a crazy roller coaster. Gold, which had been soaring all the way, suddenly plummeted on Friday, dropping by $180. This plot twist caught many off guard, leaving many investors bewildered. So what will happen to gold this week? From a technical analysis perspective, the daily chart closed bearish with a significant drop, indicating substantial upward pressure in the short term. The market outlook is less optimistic. The 4000 level is crucial; if it holds, the market may consolidate for a while. However, if it breaks, it's likely to seek support around 3930 or even lower, near 3886. The 4-hour chart is currently in a consolidation phase. If the market can recover lost ground and reclaim key moving averages, the bulls still have some hope. Otherwise, the bears may continue their rampage.
Gold has formed a head and shoulders pattern on the 1-hour chart. If it cannot regain a foothold above 4150 this week, then the 1-hour rebound will form the right shoulder of the head and shoulders pattern. Therefore, if gold rebounds this week and is pressured below 4150, continue to sell on rallies. After Friday's sharp drop, there may be a rebound correction at the beginning of the week, and then we will see how strong the rebound is. As for the trading strategy this week, I think selling on rallies is the most reliable approach. If gold rebounds to around $4110-$4120 early this week, this is a key resistance zone from the previous period and also near the high point of Thursday night's rebound. It is highly likely to encounter resistance. Aggressive traders can consider shorting with a small position, with a target of $4050-$4030. For a more conservative approach, wait for a rebound to the $4140-$4150 range before placing short orders. This is the upper edge of the previous consolidation range. The initial target is $4100-$4080. If the downtrend continues, look towards the $4000 psychological level, or even lower to the $3930-$3887 area.

XAUUSD – WEEKLY SESSION SCENARIO UPDATE 💛 XAUUSD – WEEKLY SESSION SCENARIO UPDATE 🎯
🌤 Overview
Hello everyone 💬
Gold prices at the start of the week remain mostly unchanged, the price structure on H4 is intact, so Lana continues to maintain the old trading strategy.
Currently, gold is weakly reacting around the mid-term resistance zone, not strong enough to break through – but also without clear reversal signals.
💹 Technical Analysis
📉 Price is moving within a narrow range between key liquidity zones:
Zone 4138–4140 is the nearby resistance, where the market has repeatedly reacted downwards.
Zone 4200 coincides with confluence fibo + descending trendline – strong resistance.
Zone 3990–3988 is a crucial support, also a lower liquidity area, suitable for technical rebound Buy.
Market liquidity is weak, reflected in the wicks and narrowing range.
🎯 Reference Trading Plan
💢 SELL (priority on adjustment rhythm)
4138–4140 | SL: 4146 | TP: 4120 → 4105 → 4089
4200 | SL: 4212 | TP: 4185 → 4160 → 4133
💖 BUY (strong support)
3990–3988 | SL: 3984 | TP: 4002 → 4032 → 4060
⚠️ Market Insight (Macro Insight)
Gold declines alongside US stocks and Bitcoin, indicating a lack of liquidity across the market.
This behavior is common during phases like:
2008 Financial Crisis
Early 2020 pandemic panic
Investors are forced to sell profitable assets to cover losses, causing gold – even as a safe haven – to decline. This reflects a strong increase in cash demand and widespread fear.
🌷 Conclusion with LanaM2
Gold is moving within a tight range and heavily reliant on liquidity 💛
If you find this useful, please 💛 Like – 💬 Comment – 🔔 Follow LanaM2 for daily gold analysis ✨

Gold Still in Distribution, FOCUS ON SELL Setups at 4,10x–4,14x 🔍 Market Context
Risk sentiment remains fragile as investors reassess the global rate and stimulus story.
Goldman Sachs notes that rising worries about the size of Japan’s fiscal stimulus are bringing financial risk premia back, putting pressure on long-term JGBs and the JPY. Capital tends to rotate into USD and yield-bearing assets in this environment, which limits the upside for gold in the short term.
📊 XAU/USD Technical Structure (H1)
After topping around 4,242 USD, gold broke its short-term uptrend and is now moving in a descending structure.
Price is currently capped below the 0.5–0.382 Fibonacci area around 4,11x, which overlaps with a strong supply / Sell Liquidity zone on the chart.
Below price, we have a series of liquidity / support pockets:
4,098 – 4,077 – 4,048 USD: short-term downside liquidity levels.
OBS BUY ZONE around 4,00x: major demand zone where price previously launched a strong rally.
Current price action shows sellers still in control – every bounce into 4,10x–4,14x is being rejected quickly, which fits a “sell the rally” approach.
🎯 Trend-Following Trade Ideas (for reference)
Zones below are technical areas to watch, not signals or financial advice.
Scenario 1 – Shallow Pullback Sell
Sell Zone 1: 4,102 – 4,104
SL: 4,110
TP levels:
TP1: 4,098
TP2: 4,077
TP3: 4,048
Idea: Price makes a minor intraday pullback into local supply, then resumes selling pressure toward lower liquidity pockets.
Scenario 2 – Deeper Pullback into Fib/Trendline Confluence
Sell Zone 2: 4,142 – 4,144
(confluence of descending trendline + Fibonacci combo)
SL: 4,150
TP levels:
TP1: 4,133
TP2: 4,105
TP3: 4,088
TP4: 4,060
Idea: If the market grabs more upside liquidity first, the 4,14x zone offers a better R:R area to align with the H1 downtrend.
⚜️ MMFLOW TRADING View
As long as price stays below 4,14x and H1 structure keeps printing lower highs, gold remains in a distribution phase.
Pullbacks into the 4,10x–4,14x liquidity band are treated as opportunities to optimize SELL entries, while the 4,00x OBS BUY ZONE is the key area to reassess any potential larger bottoming process.
“In a downtrend, our job isn’t to call the bottom – it’s to use every weak bounce to sell from a better position.”