GNT/BTC Long with 4.4 R/R: Im bullish on this project for the fundamentals and am happy to see a long set-up while BTC dumps.
I will trail my stop up to secure profits. Hopefully sell at target 1 and buy back in a little lower. Then keep a tight stop loss.
There's a lot of Alt Coin blood to buy right now so i don't want to stay in the trade long.
Golem

Golem/Bitcoin (29 May) #GNT $GNT #BTC $BTC#BUY #WAIT
GNT is moving in all good formations : Bullish Flags in big timeframe and small timeframe, but there's still a chance to drop down to 1000sts so you should leave your money to prepare the bad case.
Current Price : 1213
Buyzone : Close to 1000 as possible
Sellzone : 1400-1600-2000-2300
Stoploss : Below 1000

GNT/BTC - 30-minute chartTrend lines, Fibonacci target of ABC, give it some time big picture looks at big up retracement.
Good luck trading,
-TheTrex

GNTUSD Altcoin Golem Buy the rumor, sell the news In June we are going alpha with the golem protocol, Buying in my yellow box for massive acumulation before we are late. First target for cautious investors. im selling in 1$ and beyond

There is a possibility for the beginning of an uptrend in GNTETHTechnical analysis:
. Golem/Ethereum is in a range bound and the beginning of uptrend is expected.
. The price is below the 21-Day WEMA which acts as a dynamic resistance.
. The RSI is at 34.
Trading suggestion:
. There is a possibility of temporary retracement to suggested support zone (0.00045600 to 0.00042600). if so, traders can set orders based on Price Action and expect to reach short-term targets.
Beginning of entry zone (0.00045600)
Ending of entry zone (0.00042600)
Entry signal:
Signal to enter the market occurs when the price comes to " Buy zone " then forms one of the reversal patterns, whether " Bullish Engulfing ", " Hammer " or " Valley " in other words,
NO entry signal when the price comes to the zone BUT after any of the reversal patterns is formed in the zone.
To learn more about " Entry signal " and the special version of our " Price Action " strategy FOLLOW our lessons:
Take Profits:
TP1= @ 0.00050590
TP2= @ 0.00055300
TP3= @ 0.00059700
TP4= @ 0.00065400
TP5= @ 0.00070400
TP6= @ 0.00087600
TP7= @ 0.00115490
TP8= Free

GNT Medium Term Analysis As GNT continues to consolidate above the $.08 support region It does appear to be coiling for a breakout higher. If GNT manages to breakout through the counter trend-line resistance I believe we should see a continuation higher. A break of the $.11 pivot level should lead to the $.13 and $.16 resistance regions over the upcoming weeks.

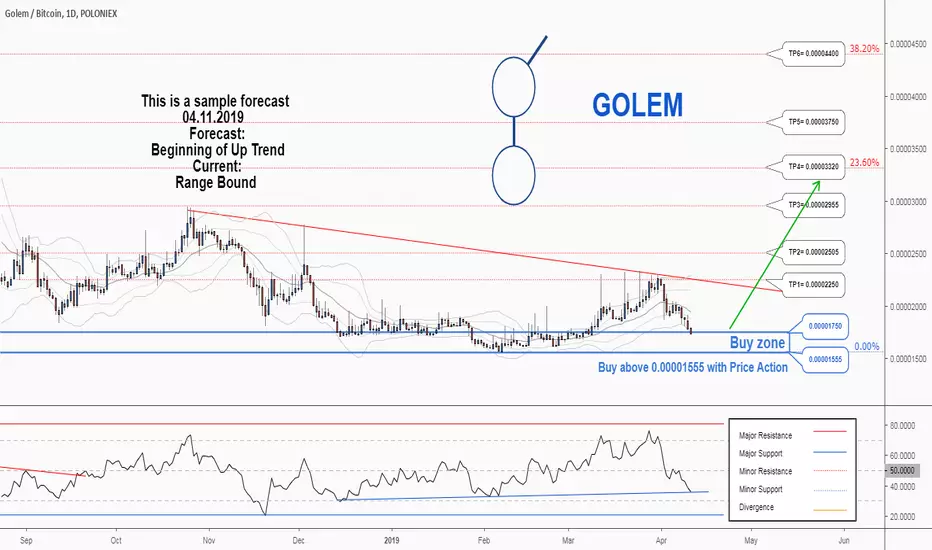
There is a possibility for the beginning of an uptrend in GNTBTCTechnical analysis:
. Golem/Bitcoin is in a range bound and the beginning of uptrend is expected.
. The price is below the 21-Day WEMA which acts as a dynamic resistance.
. The RSI is at 35.
. While the RSI downtrend and the price downtrend in the daily chart are not broken, bearish wave in price would continue.
Trading suggestion:
. There is a possibility of temporary retracement to suggested support zone (0.00001850 to 0.00001555). if so, traders can set orders based on Price Action and expect to reach short-term targets.
Beginning of entry zone (0.00001850)
Ending of entry zone (0.00001555)
Entry signal:
Signal to enter the market occurs when the price comes to " Buy zone " then forms one of the reversal patterns, whether " Bullish Engulfing ", " Hammer " or " Valley " in other words,
NO entry signal when the price comes to the zone BUT after any of the reversal patterns is formed in the zone.
To learn more about " Entry signal " and the special version of our " Price Action " strategy FOLLOW our lessons:
Take Profits:
TP1= @ 0.00002250
TP2= @ 0.00002505
TP3= @ 0.00002955
TP4= @ 0.00003320
TP5= @ 0.00003750
TP6= @ 0.00004400
TP7= @ 0.00005280
TP8= @ 0.00006160
TP9= @ 0.00007400
TP10= @ 0.00009000
TP11= @ 0.00010440
TP12= @ 0.00016800
TP13= Free

GNT nearing strong support areaSet a buy at 1935. Lots of areas of support.Seems like more areas of upside than downside, especially on the higher time frames.
Order got hit. Let's see where this goes.

GNT looking ready to blow!!!GNT pulled back perfectly into support, tagging the 100MA and bounced right back
We can see it breaking back above support and could make its way back up to resistance and move higher to other targets!
Thanks guys!

Golem Displays Huge Volume (360% Profits Potential)Golem's volume has been increasing massively in the past few days, and it is already moving.
Looking at the moving averages, we can see that EMA10 had a bullish cross of EMA50 and EMA100, this is a really strong bullish signal.
We have a trade active for this pair, GNTBTC, which can be found here:
This is a friendly reminder so that you too can profit from this altcoin... Remember to hit like.
Thanks a lot for reading.
Namaste.

GNTUSD Bullish , never returning to 0.06$.As i saw the Community liking my XRP Chart, i wanted to give everyone another very lovely scenario in the Crypto Economy.
This is another Cryptocurrency that has broken loose of the chains of bitcoin's bear market as well as XRP wich i forgot to mention in my last post.
Golem , better known as GNT, has been sitting on its bottoms for quite a while in the BUY-IN region of 0.06$ and is now heading to its first region of 0.30$ . if we break and retest this level we are in for more appreciation in value for GNT.
PS; I am just showing the basics here to not confuse people , and give everyone a clear view.
Deeper insight, levels & analysis are only given to students of AR Financials.

$GNT Big Picture: Falling wedge that could last till end 2019$GNT @golemproject
Big Picture: Falling wedge that could last till end 2019
Moving into the daily activity
Volume rised substantially over the last days/weeks
Reached upper trendline
Crossed over EMA100, now retesting it
Volume falling.
RSI & MACD deciding
ascending trendline acting as support
#GNT


Golem GNT/USD in accumulation zone. Perfect time for buying. Time to accumulate some tokens for this next bull continuation. Gnt excellent price right now.

GNTBTC 1DGolem is going fine, but a little risky for now. Thought can be bought for medium term. Don't forget to profit realization,
Be careful, break a leg!!


GNTUSD Buy signal/ 38% profit opportunityPattern: Break-out from the 1D Resistance.
Signal: Bullish.
Target: 0.11500.

There is a trading opportunity to buy in GNTETHTechnical analysis:
. GOLEM/ETHEREUM is in a range bound and the beginning of uptrend is expected.
. The price is above the 21-Day WEMA which acts as a dynamic support.
. The RSI is at 53.
. While the RSI downtrend and the price downtrend in the daily chart are not broken, bearish wave in price would continue.
. The price downtrend in the daily chart is broken, so the probability of the resumption of an uptrend is increased.
Trading suggestion:
. There is a possibility of temporary retracement to suggested support zone (0.00048100 to 0.00042600). if so, traders can set orders based on Price Action and expect to reach short-term targets.
Beginning of entry zone (0.00048100)
Ending of entry zone (0.00042600)
Entry signal:
Signal to enter the market occurs when the price comes to " Buy zone " then forms one of the reversal patterns, whether " Bullish Engulfing ", " Hammer " or " Valley " in other words,
NO entry signal when the price comes to the zone BUT after any of the reversal patterns is formed in the zone.
To learn more about " Entry signal " and the special version of our " Price Action " strategy FOLLOW our lessons:
Take Profits:
TP1= @ 0.00056000
TP2= @ 0.00060080
TP3= @ 0.00063700
TP4= @ 0.00070920
TP5= @ 0.00079680
TP6= @ 0.00088390
TP7= @ 0.00100870
TP8= @ 0.00116800
TP9= @ 0.00140600
TP10= Free

GNT Swing TradeGolem held the weekly support level at $0.055, forming a potential double bottom. If GNT can see some buying and a break of the $0.08 neckline/resistance level, I believe further upside may follow. If that is the case I will target the $0.09 and $0.10 levels, which align with the 0.27 and 0.618 fib extensions.

Descending channel Really close to ATL price and support.Descending channel Really close to ATL price and support.
I couldn't find any triggering event for @golemproject on the upcoming weeks/months.
Anyway we can expect a potential bounce from th3 1540sats level. Wait for confirmation. I will update if something changes
New All Time Lows$GNT #Golem Broke down from a descending triangle and now is at new all time lows....
After the drop we found some big pressure in volume to 1675sats. If this level cannot hold, next target can be 1422sats. If you are a hodler of #GNT, please be careful and protect your capital!
