Blue Skies or Elevator Down?Currently trading inside a chop zone.
The repeated holds on the downtrend algo suggest this entire area has been accumulation around PWH/PMH. With the Berkshire stake and the negative sentiment floating around, it’s hard to know their exact cost basis — but the structure hints accumulation took place near the 50-day (around 285) and along the downtrend algo, with the upside trigger lining up at 302.65 and BPS levels at 306.89/312+.
Key levels I’m tracking:
• Low-Vol ST 1: 290.58
• Low-Vol ST 1b: 323.20
• Buy/Defense Zones: 285 • 290.58 • 295
I trade intraday — pure scalps. My entire approach is finding the pressure points where one side gets trapped and putting them against the wall.
I’m a trading assassin. I hunt bulls. I hunt bears. I survive the market.
I see the chart, and I act.

Alphabet’s AI AwakeningAlphabet (Google) has been underestimated in the AI race, that’s changing fast. The launch of Gemini 3 marks a turning point, not just for the company, but for the broader narrative around who really leads the next phase of AI innovation.
Gemini 3 isn’t hype, it’s a credible, state-of-the-art model with multi-modal capabilities that challenge the best in class. Early reactions point to a system that doesn’t just generate, it reasons. For a company often seen as lagging behind OpenAI or Meta, this is a breakout moment. The stock is reacting. Google just punched through US$300 for the first time ever, with momentum that suggests this isn’t a one-off event, but the start of a re-rating.
What makes Google different is distribution. Unlike startups, it doesn’t need to chase users. Google Search, YouTube, Android, these are pipes already connected to billions of people.
Gemini isn’t stuck in a lab, it’s being embedded into products that are already part of everyday life. That gives it an unmatched scaling advantage. The AI becomes useful immediately, commercially viable, monetisable.
The market is starting to price in more than ads. Gemini opens doors, from enterprise AI in the cloud, to paid features, to deeper integration across devices. The optionality is massive. And unlike other players, Alphabet can afford to play a long game. It's well capitalised, profitable, and now it has product leadership.
It also has access to public markets, if it needs to raise more capital.
This is what makes it the dark horse. Peter Thiel also calls it the last mover advantage. Quietly positioned, now breaking out. If the current trajectory holds, Alphabet isn’t just participating in the AI boom, it’s shaping it.
For investors and traders, this isn’t about catching a trend, it’s about backing a giant that just woke up.
The forecasts provided herein are intended for informational purposes only and should not be construed as guarantees of future performance. This is an example only to enhance a consumer's understanding of the strategy being described above and is not to be taken as Blueberry Markets providing personal advice.

Google Stock (NASDAQ: $GOOGL) Rises on Nano Banana Pro UpdateGoogle parent Alphabet (NASDAQ: NASDAQ:GOOGL ) introduced Nano Banana Pro, an upgraded version of its AI image-editing and generation platform powered by Gemini 3 Pro. The update improves text legibility inside AI-created images—one of the most persistent challenges for image models—and integrates deeper reasoning features from Gemini 3, enabling more consistent output and broader creative control.
The tool will also be available across Google Search’s AI Mode, the Gemini API, Google Ads, and Flow, the company’s filmmaking platform. Free-tier Gemini users will receive limited access quotas, a move designed to increase usage while showcasing the improved capabilities.
The launch comes just days after Google unveiled Gemini 3, a major release aimed at closing competitive gaps with OpenAI. According to The Wall Street Journal, the earlier launch of Nano Banana in August significantly accelerated user growth and retention, making this enhanced version a strategic release. While ChatGPT still leads in usage, Google’s rapid iteration suggests a strong push toward regaining market share across creative and enterprise AI applications.
Technical Analysis:
Alphabet shares have been bullish overall, recently breaking above a long-respected trendline to the upside. This breakout confirms ongoing upward momentum supported by improving AI fundamentals, rising cloud demand, and investor optimism around new product rollouts.
The stock did pull back on Friday following the Nano Banana Pro announcement, but the technical structure remains intact. The trendline breakout continues to act as a strong foundational level, and buyers may re-enter if price revisits that zone. A sustained hold above recent highs opens room toward the next major target region, while failure to reclaim momentum could trigger a short-term retest before continuation.
Overall, Google’s AI expansion supports the broader bullish bias, with fundamentals and technicals aligning for potential upside continuation.

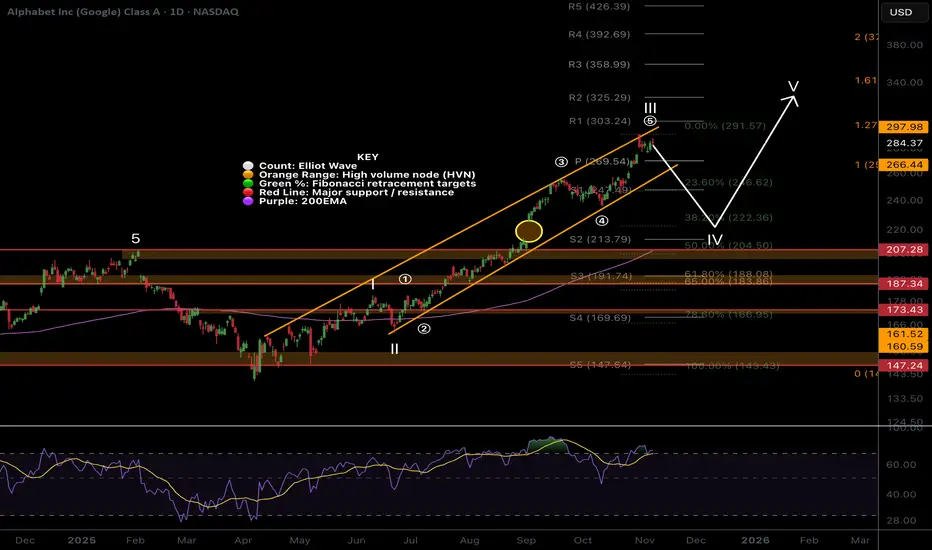
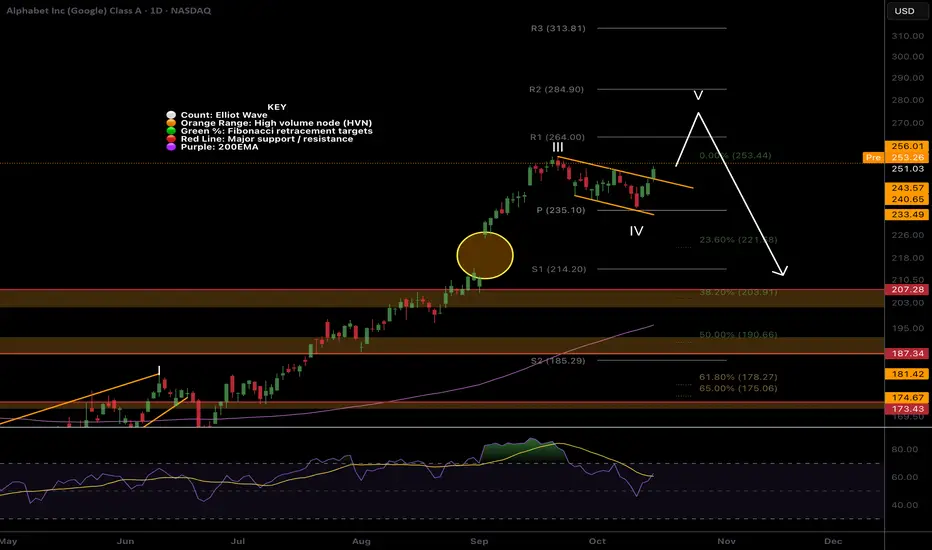
Alphabet (GOOG) Set For Correction -RSI Shows Bearish DivergenceThis daily chart highlights an upside impulse in the making
Price action fits neatly within the orange uptrend
The major portion of the move appears complete with waves 1-3 finished as shown by the white labels
RSI displays strong bearish divergence against the higher highs on the chart
The large wave ((4)) is expected to unfold next
The downside target zone is shown by the pink box between 245 and 208 representing the 38.2-61.8% Fibonacci retracement of wave ((3))
The bottom of the smaller wave 4 sits within this zone at 237 and price often retests that level
And yes wave ((4)) could break down the uptrend
After that the final wave ((5)) should at least retest the wave ((3)) peak at 304
Good Luck!

Even The Most Accomplished Make Mistakes $Goog [Berkshire]Berkshire Hathaway made an entrance into the Mag 7 (Excluding Apple) with its purchase of Alphabet / Google I believe that this was a mistake solely based on the fact that the majority of the tech industry is extremely overvalued. While Googles Valuation at least in my opinion is justified considering how strong Its business model is with its High Margin Reoccurring Subscription models (Google Cloud),(YouTube Premium),(Google Workshop),(Google Play) to name a few and how Dominate it is in Ads with YouTube / Chrome. It also Dominates Web Search let alone the majority of people saying they will "Google something" it sounds stupid but its a good mental metric on how people think of search. Google has built Search / web ecosystem to complement each other and force you to use there services in one way or another you are using there web ecosystem everyday from Google maps, to Google Docs or Gmail, they made you dependent on there services, Especially the younger generation (GenZ) is growing very dependent on Google Maps which may be free but shows you the grip they have on peoples web use. The Primary issue I have with Berkshire Hathaway entering at these prices is generally the markets are indiscriminate if the mag 7 or tech industry has a red day no matter how strong Google may be that will bring them down too.
-----------------------
My Personal Thesis on Google:
I am very bullish on several areas of Alphabet Including but not limited to Google Cloud, YouTube, Its subscription Services, Its high Margin software business model. Most Importantly to me is There Robotics Section Deepmind and Gemini Robotics. Robotics is underappreciated and my personal belief is that it is the Next AI like boom but we are very early to this. Robotics has use cases in every industry from Solving lack of labor issues and an aging workforce / population especially in western countries Robots can easily pick up this slack and they will greatly benefit from Artificial intelligence Google / Alphabet has the money and cashflow to heavily invest in this area maybe not creating the physical humanoid robots but they can definitely excel in the software section of it. Segments like Waymo are also interesting and bullish. Google is also massively profitable has very little debt, and an extremely solid balance sheet.
-----------------------
Risks:
I Believe the biggest Risk for Alphabet once again is that The American Tech Sector is extremely Overvalued, I Also See moderate amount of risk being that Google is such a monopoly that leaves it open for Antitrust Suits.
-----------------------
Business Model:
Google Is Vertically Integrated its Business was closely tied to the AI Boom being one of the Big 3 with its AI spending. People Disregard its extremely impressive moat it possesses having one of the strongest moats in tech let alone in the history of business.
-----------------------
Fundamentals:
Cash: US$98.50b
Debt: US$26.60b
Equity: US$386.87b
Total Liabilities: US$149.60b
Total assets: US$536.47b
Net Margins: 32.23%
-----------------------
Metrics:
Return On Equity: 32.1%
Return On Assets: 22.5%
Return On Capital Employed: 28.8%
-----------------------
Valuation:
Price to Sales: 8.9x
Price To Earnings: 27.7x
Price To Book: 8.9x
-----------------------
Disclaimer: I am not Initiating buy, Sell or Hold Opinions. I Only make these posts for Conversation. I am not a financial Expert or an Analyst.
GOOGL Bullish Breakout: Pennant SetupGOOGL’s daily chart remains firmly bullish, with price riding above the 20, 60, and 120-day moving averages and printing a clean sequence of higher highs and higher lows. After a strong leg up into the $292.50 area, price has slipped into a tight bullish pennant, consolidating near the top of the range while the last candle shows renewed buying interest. The demand zone around $275.50, aligned with the 20-day MA, is the key short-term floor to watch.
The primary path favors continuation. A daily close above $295 would confirm a breakout from the pennant and the $292.50 resistance, opening the door toward $305 initially and potentially $315 as price enters fresh discovery territory. If instead GOOGL breaks below $284, that would signal short-term pattern failure and invite a deeper test of support near $275.50, with risk of extension into the 270s. For the bullish view, a decisive daily close below the $275.50–273 zone would be a clear invalidation and shift the narrative toward a broader correction rather than trend continuation.
Thought of the Day 💡: Strong trends reward patience, but clear levels help you tell the difference between “normal noise” and a real regime change.
This is a study, not financial advice. Manage risk and invalidations.
-------------------------
Thanks for your support!
If you found this idea helpful or learned something new, drop a like 👍 and leave a comment, I’d love to hear your thoughts!

Short Alphabet (GOOGL) near 290Head and shoulders is visible on H4 and on the Daily. I will look for a firm break and retest of the neckline to confirm a momentum shift.
An ABCD harmonic completed around 288, which marks a potential reversal zone based on measured move symmetry.
RSI shows a 40-point divergence on H1 and H4, from 82 down to 42. This indicates buyers are losing pressure while sellers gain control.
RSI is stretched across multiple intraday timeframes, consistent with mean reversion risk.
The primary Daily trend remains up. The H4 trend has flattened and started to roll, which supports a countertrend short setup.
Given the longer-term uptrend and elevated speculative sentiment, I will size conservatively and require price action confirmation.
Entry zone: around 290 at the ABCD completion area.
Stop loss: 305 to allow room for volatility without crowding the structure.
First target: 259, which aligns with prior demand and conservative mean reversion.
Risk-to-reward ratio: approximately 1 to 1.7.

Google ( $GOOG) Faces €573M Fine but Trend Remains BullishGoogle (GOOG) has been hit with a major legal setback after a Berlin court ordered the company to pay €573 million ($666 million) in damages to two German price-comparison platforms. The case stems from long-running antitrust disputes tied to Google’s alleged practice of favoring its own shopping service over competitors—an issue the European Commission initially penalized in 2017 with a €2.4 billion fine.
The court awarded Idealo €374 million plus €91 million in interest, while Producto GmbH will receive €89.7 million plus €17.7 million in interest. Both companies argued that Google’s search dominance limited their visibility, costing them years of lost revenue. Although pleased that much of the €3.3 billion originally sought by Idealo was dismissed, Google maintains that it disagrees with the ruling and will appeal. The company insists the 2017 remedy addressed the concerns and that the EU’s monitoring supported that view.
However, the Berlin judges concluded that Google’s changes were not sufficient to eliminate the competitive harm—even after 2017. This marks the first time a national European court has explicitly stated that Google’s remedy failed to end the abuse, potentially opening the door for billions more in follow-on claims across Europe. Plaintiffs may push for larger settlements, making this an evolving legal headwind for Alphabet.
Technical Outlook
Despite the legal news, GOOG’s chart remains structurally bullish. The stock has been in a steady uptrend, supported by consistent higher lows and strong demand across tech. Recently, price broke above a key trendline, signaling renewed upside momentum.
GOOG did experience a pullback on Friday as headlines hit, but the broader direction remains intact. As long as the stock holds above its breakout zone and the trendline, bullish continuation remains the dominant bias with buyers stepping in on dips.

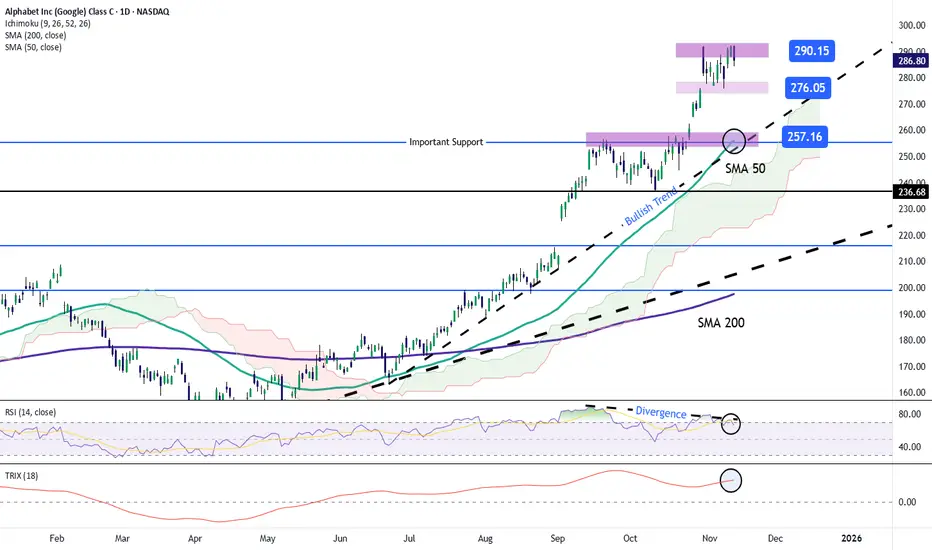
Google Stock Approaches the $300 MarkGoogle’s stock has managed to remain near its all-time highs, and since its last major correction, it has posted a gain of more than 5% over recent trading sessions. However, the company’s recent comments regarding an increase in capital expenditures, projected to reach approximately $91 billion, have started to slow the stock’s upward momentum in the short term. This expansion in investment implies a greater financial commitment and a risk that expected revenue growth may not materialize. For now, buying pressure has entered a consolidation phase, which could lead to indecisive price movements in the coming sessions. Nonetheless, if the overall market bias remains bullish, this could support a gradual move toward the 300-dollar per share level.
Uptrend
Since late June, Google’s stock has maintained consistent upward movements, forming a rising trendline that has guided the price toward the $300 area. Despite the recent neutral phase, there are no significant bearish corrections threatening this trend, which continues to serve as the dominant technical structure in the short term. If buying pressure holds, the trendline could gain strength in the coming sessions. However, the recent lack of directional momentum also leaves room for potential short-term pullbacks.
RSI
The RSI indicator line shows dominant buying momentum, though it remains close to the overbought zone (around 70). Additionally, while the stock’s price has made higher highs, the RSI has formed lower highs, signaling a potential bearish divergence that could indicate an imbalance in market strength. This setup could lead to a short-term correction period in the coming sessions.
TRIX
The TRIX indicator remains above the neutral level of 0, suggesting that the average of exponential moving averages continues to show consistent buying strength. As long as the TRIX keeps rising, it could signal dominant buying pressure in the medium- to long-term trend.
Key Levels to Watch:
290 USD – Major Resistance: This level corresponds to the stock’s all-time highs and represents the most important bullish barrier to monitor. A breakout above this area could trigger a more aggressive short-term uptrend, potentially pushing the stock toward the psychological 300-dollar level, provided buying pressure remains dominant.
276 USD – Immediate Support: This level corresponds to the recent pullback zone and may serve as temporary support against short-term corrections.
257 USD – Key Support: This level coincides with both the uptrend line and the 50-period simple moving average. A break below this zone could endanger the current uptrend structure and give way to a new bearish bias of technical relevance.
Written by Julian Pineda, CFA, CMT – Market Analyst
Can One Company Control Computing's Future?Google has executed a strategic transformation from a digital advertising platform to a full-stack technology infrastructure provider, positioning itself to dominate the next era of computation through proprietary hardware and breakthrough scientific discoveries. The company's vertical integration strategy centers on three pillars: custom Tensor Processing Units (TPUs) for AI workloads, quantum computing breakthroughs with verifiable advantages, and Nobel Prize-winning drug discovery capabilities through AlphaFold. This approach creates formidable competitive barriers by controlling foundational computational infrastructure rather than relying on commodity hardware.
The TPU strategy exemplifies Google's infrastructure lock-in model. By designing specialized chips optimized for machine learning tasks, Google achieved superior energy efficiency and performance scaling compared to general-purpose processors. The company's multibillion-dollar deal with Anthropic, deploying up to one million TPUs, transforms a potential cost center into a profit generator while locking competitors into Google's ecosystem. This technical dependence makes migration to rival platforms financially prohibitive, ensuring Google monetizes a significant portion of the generative AI market through its cloud services regardless of which AI models succeed.
Google's quantum computing achievement represents a paradigm shift from theoretical benchmarks to practical utility. The Willow chip's "Verifiable Quantum Advantage" demonstrates a 13,000-times speedup over classical supercomputers in physics simulations, with immediate applications in molecular structure mapping for drug discovery and materials science. Meanwhile, AlphaFold delivers quantifiable economic impact, reducing Phase I drug development costs by approximately 30% from over $100 million to $70 million per candidate. Isomorphic Labs has secured nearly $3 billion in pharmaceutical partnerships, validating this high-margin revenue stream independent of advertising.
The geopolitical implications are profound. Google holds the second-highest number of quantum technology patents globally, with strategic IP covering essential scaling technologies like chip tiling and error correction. This intellectual property portfolio creates a technical chokepoint, positioning Google as a mandatory licensing partner for nations seeking to deploy quantum technology. Combined with the dual-use nature of quantum computing for both commercial and military applications, Google's dominance extends beyond market competition to national security infrastructure. This convergence of proprietary hardware, scientific breakthroughs, and IP control justifies premium valuations as Google transitions from cyclical advertising dependence to an indispensable deep-tech infrastructure provider.
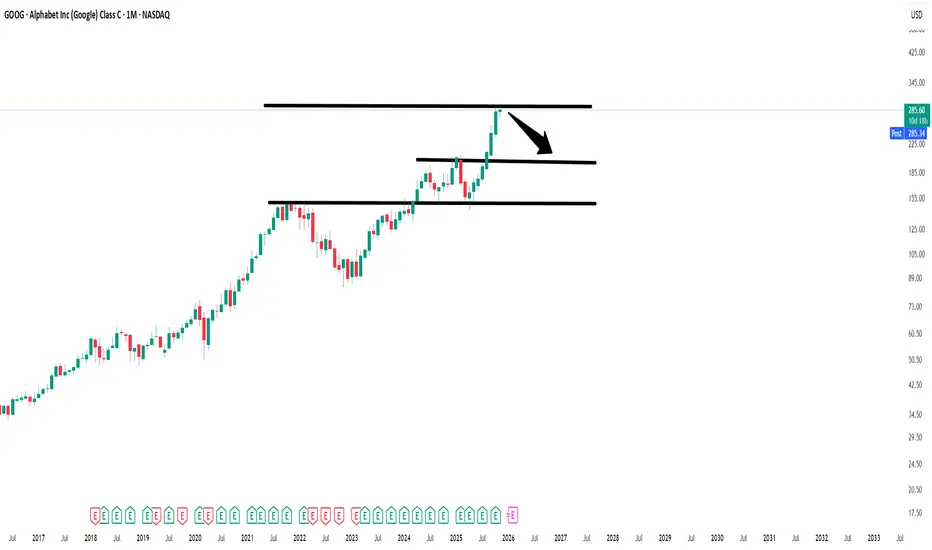
GOOGLE Bull Cycle running out of steam. Be ready to sell.It's been exactly 2 months (September 05, see chart below) when we last had a look at Google (GOOG) giving a strong break-out Buy Signal that methodically hit our $275 Target:
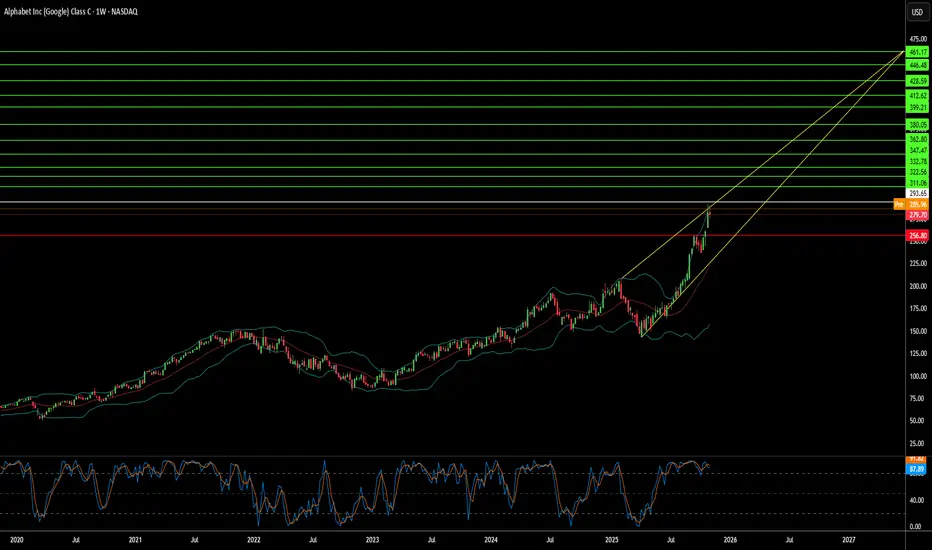
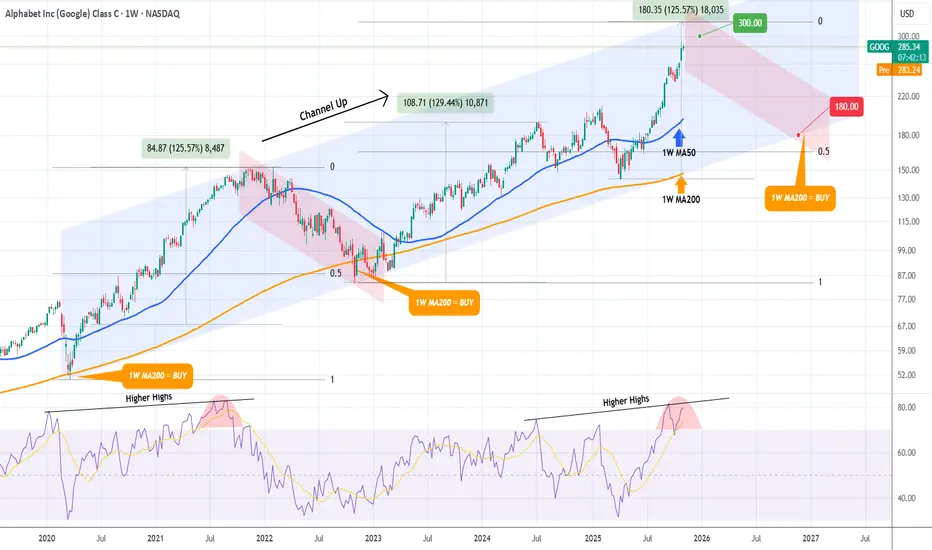
This time we look at the stock from a much longer term perspective on the 1W time-frame, where it is approaching the top (Higher Highs trend-line) of the Channel Up that started on the COVID crash (March 2020).
This is a major Sell Alert as the 1W RSI is also printing a Double Top formation similar to the November 15 2021 Top. Given that +125% rallies have been the most common long-term sequences of this pattern, we believe that any price above $300 is a major Sell for Google.
The strongest long-term Support and Target of correction sequences/ Bearish Legs has been the 1W MA200 (orange trend-line) and this is our Target for 2026. We estimate that a potential contact with the 1W MA200 can be made at around $180 (also marginally above the 0.5 Fibonacci level from the bottom of the previous correction). A contact with the 1W MA200 will be our next long-term Buy on Google.
-------------------------------------------------------------------------------
** Please LIKE 👍, FOLLOW ✅, SHARE 🙌 and COMMENT ✍ if you enjoy this idea! Also share your ideas and charts in the comments section below! This is best way to keep it relevant, support us, keep the content here free and allow the idea to reach as many people as possible. **
-------------------------------------------------------------------------------
💸💸💸💸💸💸
👇 👇 👇 👇 👇 👇
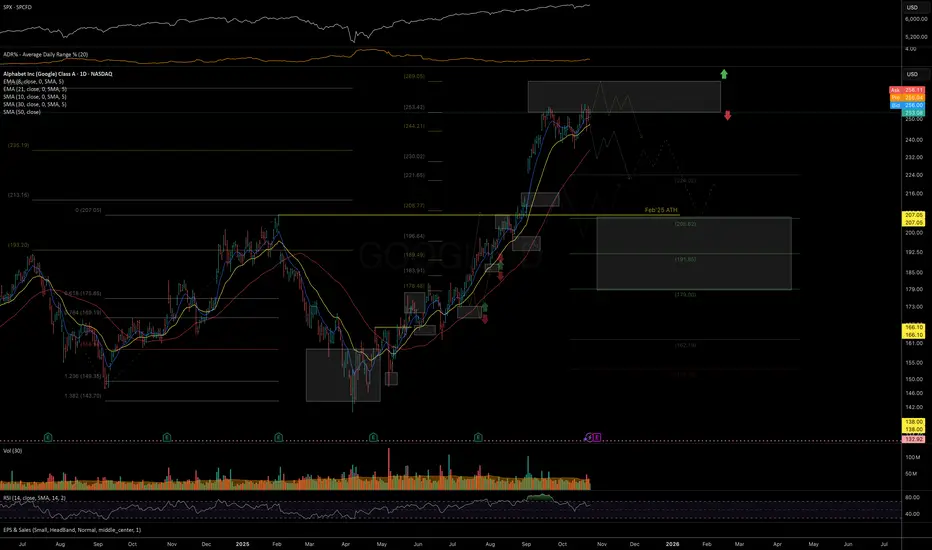
Google pullback still in play, local chartWave III continues but price looks exhausted and may trap late investors causing them to capitulate lower later.
Wave (5) of III is likely to complete with a throw-over of the upper channel boundary. Wave IV has an expected retracement target of the 0.382, $222, filling the gap left and meeting the daily 200EMA.
Daily RSI has printed bearish divergence from overbought.
Continued upside hasa target of the R3 pivot, $358.
GOOGL Bullish Continuation: Breakout Retest Toward 300Hello, traders! GOOGL on the 1D chart remains in a dominant uptrend after a clean breakout from its September–October range. Price is pressing near highs, with momentum and breadth consistent with a bull flag resolution. The prior Resistance at $255.50 marked the top of that range; the breakout above it signals continuation. First key support sits near $230.00, which flipped from resistance earlier and aligns with the trend structure.
Primary path: look for a constructive pullback into the breakout zone at $276–$281 to hold, then continuation toward the psychological $300 handle and, if momentum persists, the $305–$310 zone. Breakout traders can also use a daily close above the recent high at $291.59 as confirmation; a stronger trigger is a daily close > $292.00 on firm volume. If buyers fail to defend the near-term structure, a decisive close back below $253.00 would invalidate the bullish view; tighter risk managers can use a close below $276.00 as the line in the sand.
This is a directional study with tactical levels, not a signal. Manage position size and stops according to your plan. This is a study, not financial advice. Manage risk and invalidations

Breaking: Alphabet Inc. (NASDAQ: $GOOG) Spike 12% TodayThe share price of Alphabet Inc. (NASDAQ: NASDAQ:GOOG ) Spike 8% on Thursday early market trading breaking out of a bullish flag pattern.
The asset is currently overbought as seen by the RSI at 83, making it poised for a reversal in the short term. Adding to the bullish thesis, NASDAQ:GOOG is trading above key MA respectively.
In another news, Google parent Alphabet
is planning a “significant increase” in spend next year as it continues to invest in AI infrastructure to meet the demand of its customer backlog, executives said Wednesday.
The company reported its first $100 billion revenue quarter on Wednesday, beating Wall Street’s expectations for Alphabet’s third quarter. Executives then said that the company plans to grow its capital spend for this year.
“With the growth across our business and demand from Cloud customers, we now expect 2025 capital expenditures to be in a range of $91 billion to $93 billion,” the company said in its earnings report.

GOOG | The Year of Quantum | LONGAlphabet, Inc. is a holding company, which engages in software, health care, transportation, and other technologies. It operates through the following segments: Google Services, Google Cloud, and Other Bets. The Google Services segment includes products and services, such as ads, Android, Chrome, devices, Google Maps, Google Play, Search, and YouTube. The Google Cloud segment refers to infrastructure and platform services, collaboration tools, and other services for enterprise customers. The Other Bets segment relates to the sale of healthcare-related services and internet services. The company was founded by Lawrence E. Page and Sergey Mikhaylovich Brin on October 2, 2015 and is headquartered in Mountain View, CA.

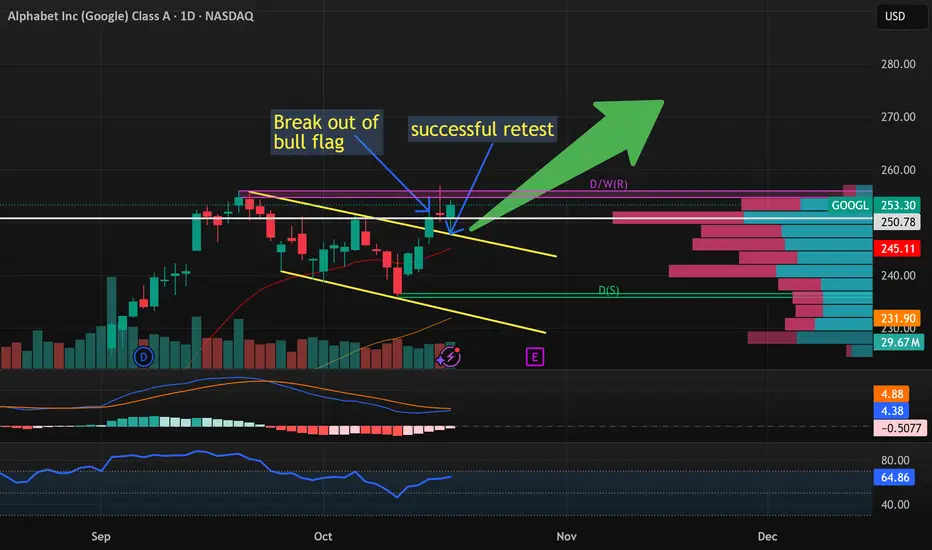
Bull run for GOOGL incoming?Google just pushed out of it's bearish flag channel. Then, on Friday it successfully retested it.
Trading at a forward of P/E of 19.6x which is the lowest of all the Mag7.
Ideally I'd like to see GOOGL break the ATH support and trade the breakout.
But that this point already, I will likely begin to open a long position.
Ideally this doesn't happen so close to earnings (As it can blow up the entire pattern), but I think it's still worth a shot.
GOOGL Alphabet Options Ahead of EarningsIf you haven`t bought GOOGL before the rally:
Now analyzing the options chain and the chart patterns of GOOGL Alphabet prior to the earnings report this week,
I would consider purchasing the 305usd strike price Calls with
an expiration date of 2026-1-16,
for a premium of approximately $8.30.
If these options prove to be profitable prior to the earnings release, I would sell at least half of them.

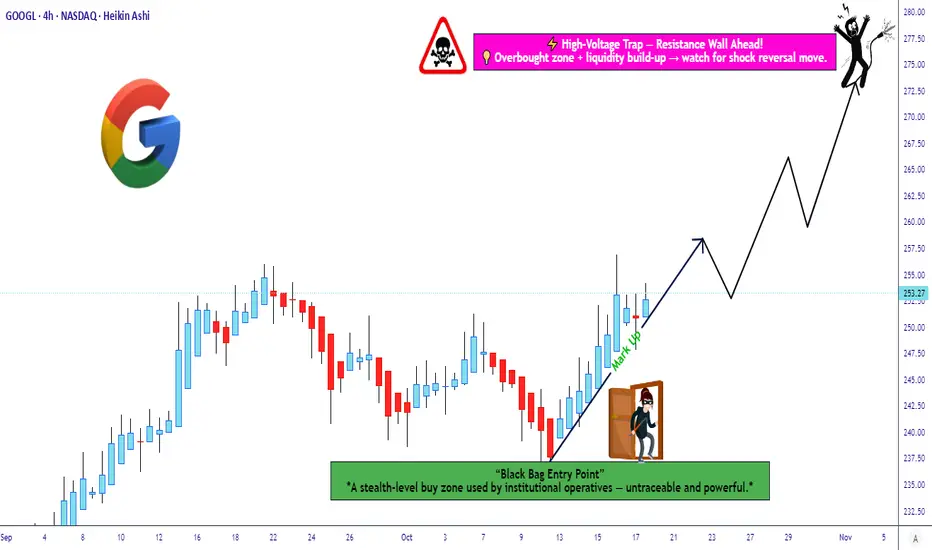
Is This the Perfect Entry Zone for the Next GOOGL Upside Run?🎯 GOOGL: The "Thief's Heist" Trading Strategy | Layered Entry Playbook 📊
💼 Asset: ALPHABET INC. (GOOGL)
Market: NASDAQ | Style: Swing/Day Trade Hybrid
🎭 The Setup: Bulls Running the Show
Bias: 🟢 BULLISH
Listen up, trading family! 👋 GOOGL is setting up what I call the "Thief's Entry Strategy" - a layered approach that lets you accumulate positions like a professional poker player stacking chips. No FOMO, no chasing - just calculated, methodical entries that would make Ocean's Eleven jealous. 🎰
🚪 Entry Strategy: The "Thief Layering" Method
Instead of going all-in at one price (rookie move 🙅♂️), we're using multiple limit orders to build our position:
📍 Layered Buy Limits:
Layer 1: $240.00
Layer 2: $245.00
Layer 3: $250.00
💡 Pro Tip: You can add more layers or adjust levels based on your risk appetite and account size. This method reduces average cost and minimizes timing risk - basically, you're stealing better prices while everyone else panic-buys at the top! 😎
Alternative: If you prefer simplicity, current market price entry works too - but where's the fun in that? 🤷♂️
🛡️ Risk Management: The "Escape Route"
Stop Loss: $235.00
⚠️ Reality Check: Dear Thief OG's (Original Gangsters of Trading), this is MY stop loss level based on technical structure. YOU need to assess your own risk tolerance, position size, and account management rules. Your money = your rules. Trade at your own risk, always! 🎲
🎯 Target Zone: The "Electric Fence"
Take Profit: $275.00
This level represents a confluence of:
⚡ Strong resistance zone (high voltage wall!)
📈 Potential overbought conditions
Bull trap territory where late buyers get caught
Strategy: Scale out as we approach target. Don't be greedy - banks get robbed, but smart thieves get away clean! 💰
⚠️ Reality Check #2: This is MY target. You might want to take profits earlier, hold for more, or scale out in portions. Your trading plan, your decision. Secure the bag at your own discretion! 💼
🔗 Related Pairs to Watch (Correlation Play)
Keep your eyes on these tech titans - they often move in sympathy:
NASDAQ:MSFT - Microsoft Corp | Big tech correlation, AI play
NASDAQ:AAPL - Apple Inc. | FAANG/tech sector leader
NASDAQ:META - Meta Platforms | Ad revenue correlation with GOOGL
NASDAQ:NVDA - NVIDIA | AI infrastructure play
NASDAQ:QQQ - Nasdaq 100 ETF | Overall tech sector health indicator
Why it matters: If these pairs show weakness, GOOGL might follow. If they're pumping, wind's at our back! 🌊
📊 Key Technical Points
✅ Support holding at current structure
✅ Bullish momentum building on lower timeframes
✅ Risk-reward ratio favorable with layered entries
✅ Volume profile suggesting accumulation phase
🎬 The "Thief Style" Philosophy
This isn't financial advice - it's a trading game plan based on technical analysis and strategic positioning. The "Thief" approach means:
Stealth entries (layering in)
🧠 Smart exits (not overstaying the party)
🎯 Calculated risk (always know your out)
🎪 Having fun while staying professional
📉 Trading involves substantial risk of loss and is not suitable for everyone. Past performance is not indicative of future results.
✨ If you find value in my analysis, a 👍 and 🚀 boost is much appreciated — it helps me share more setups with the community!
🏷️ Tags:
#GOOGL #Alphabet #StockMarket #SwingTrading #DayTrading #TradingStrategy #TechnicalAnalysis #StockAnalysis #NASDAQ #TechStocks #LayeredEntry #RiskManagement #TradingIdeas #PriceAction #SupportAndResistance #ThiefStrategy #FAANG
Trade smart, stay safe, and remember: the market doesn't care about your feelings - only your strategy matters! 🎯💪
Long $GOOGL, Too much pessimism priced in!- NASDAQ:GOOGL is one of the hated FAANG often get hit in the crossfire of misinformation campaign be it Ads related or Search related.
- NASDAQ:GOOGL is a verb and has lot of things going in favour. Leader in Quantum Computing, Healthy Growth in Cloud Services, Leader in Adtech, De-facto standard for Searches.
- Gemini is a decent LLM and I am seeing diversification of LLMs in the industry.
- Waymo is leader in autonomous vehicles.
- Google has invested in the future like SpaceX which could easily multiply its investment.
Fundamentally,
Year | 2025 | 2026 | 2027 | 2028
EPS | 9.54 | 10.18 | 11.71 | 13.21
EPS% | 18.93% | 6.71% | 15.10% | 12.81%
Base Case (Forward p/e ~ 20 )
Year | 2025 | 2026 | 2027 | 2028
Stock Price | $190 | $203 | $234 | $264
Bear Case ( Forward p/e ~ 15 )
Year | 2025 | 2026 | 2027 | 2028
Stock Price | $143 | $152 | $175 | $198
Bull Case ( Forward p/e ~ 25 )
Year | 2025 | 2026 | 2027 | 2028
Stock Price | $238 | $254 | $292 | $330
Comfortable buying NASDAQ:GOOGL < 160 and targeting $210-220 in 1-1.5 year timeframe.

GOOGL: price at important resistance zonePrice has been following the outlined structure from the July and August updates, showing the expected relative outperformance versus SPX. However, instead of forming a prolonged Autumn consolidation, price moved almost directly to the target resistance zone for the uptrend since the April bottom: 250–270.
While one more short-term push toward the top of the resistance zone is possible, as long as price remains below 270, I am watching for rising selling pressure and a potential durable consolidation to develop in the coming weeks. If price manages to post a sustained breakout above 270, the current structural view would need to be reassessed.
Caution is advised with any new long exposure at these levels, and consider protecting open long positions in case of a reversal or broader market weakness.
Chart:
Previously:
• On resistance and potential consolidation (Aug 29):
Chart:
Link: www.tradingview.com
• On local support (Aug 11):
Chart:
Link: www.tradingview.com
• On upside potential & relative strength vs SPX (Aug 5):
Link: www.tradingview.com
• On breakout setup (Jul 13):
Chart:
Link: www.tradingview.com
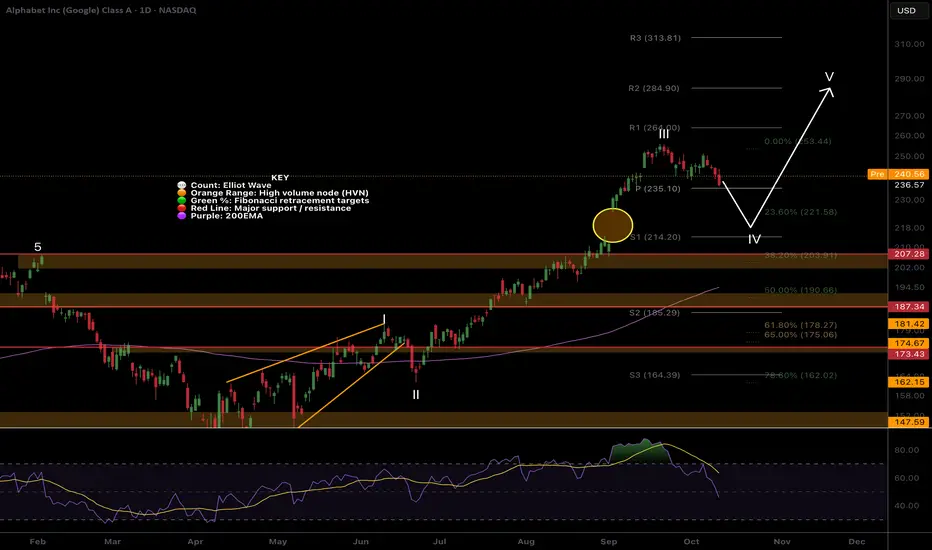
Google ready for higher!I am liking the look of NASDAQ:GOOG for another push to all time high before lower to complete macro elliot wave 3.
Wave 4 has typical target of the 0.382 Fibonacci retracement which sits at the previous all time high and also fils the gap left and meets the daily 200EMA! Lots of confluence and ill be buying here if we get it.
Daily Rsi has crossed bullishly from below the EQ.
Safe trading
Google Gap fill + wave 4?Google has had a great run into price discovery in wave III uptrend but now appears exhausted and ready for a short term pullback setting up new signals.
The gap looks likely to be filled as coinciding the wave IV Fibonacci targets and the S1 daily pivot.
RSI is making its way into oversold with plenty of room to fall. Price may fal as far as the 0.382 Fibonacci and retest the previous all time high!
Safe trading
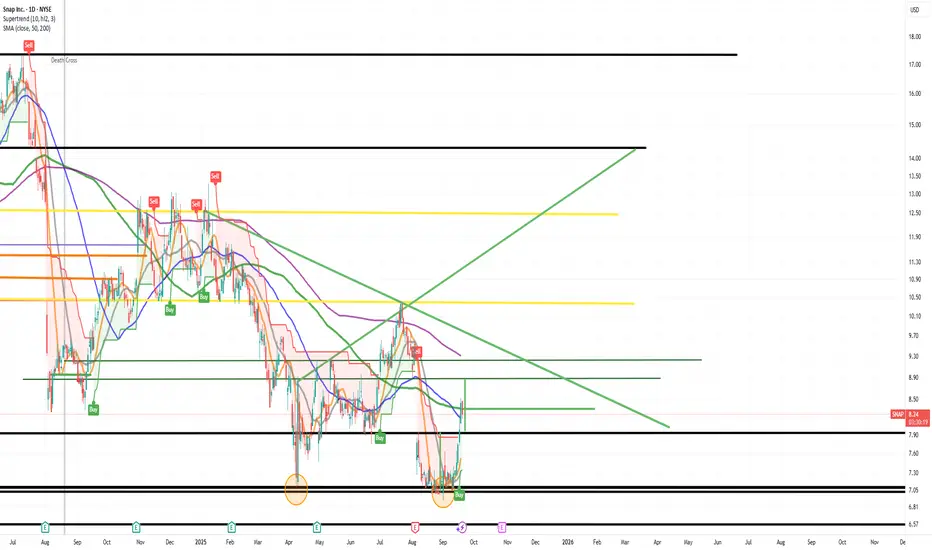
The King of $SNAP is back, with a price target of at least $13As a seasoned multimillionaire trader, I’ve navigated countless market cycles, and few trades have been as straightforward and profitable as Snapchat. Historically, NYSE:SNAP has offered clean technical setups and predictable momentum, making it one of the easiest gains in my portfolio.
Currently, I see a compelling opportunity unfolding:
Initial Target: $9.25 – This represents a gap-fill level that I consider virtually guaranteed based on historical price action and volume profile.
Breakout Potential: $11.00 – Once NYSE:SNAP clears the $9.25 threshold, I expect a rapid move toward $11, driven by momentum and short-covering.
Major Resistance: $13.00 – This is where I anticipate the next significant pause or consolidation.
1) Cup and Handle
2) Doulbe Bottom
Given the current setup, this is an ideal time to initiate a long position. The risk/reward ratio is highly favorable, and the technical indicators support a bullish continuation.
And yes, I’m sharing this publicly — not because I expect anyone to listen (let’s be honest, most won’t), but because I like receipts. When NYSE:SNAP hits these levels, I want the record to show: I called it first.
Strong buy recommendation. But hey, ignore it if you want — I’ll be too busy counting gains.