Crack-Up BOOM and BUSTHey everyone, Wave-Tech here. Join me on a historic journey as I reconstruct the Grand Super Cycle while diving into the historic and captivating world of Elliott Wave Theory!
This was to have been my maiden video cast—it didn't turn out as well as I hoped. Time got away from me, and the video ended abruptly before I could finish.
Rather than redoing it, I decided to keep the first and most authentic take intact for better or worse.
I made it private so that I could review it before publishing; however, I let too much time pass and was unable to change the setting back to public from private .
You can view the private video HERE :
The accompanying text is beneath the chart below:
In the simplest terms, Elliott Wave Theory is a measure of market psychology and sentiment coupled with Fibonnaci ratios designed to create a structural framework for determining at what stage of advance or decline a given market is in.
The basic premise for inherent advance and progress is three steps forward (impulse waves 1, 3, and 5) and two steps back (corrective waves 2 and 4).
According to Elliott, there are 9 degrees of trend, all of which are fractal in nature. The largest is the Grand Super Cycle, and the smallest is the Sub-Minuette.
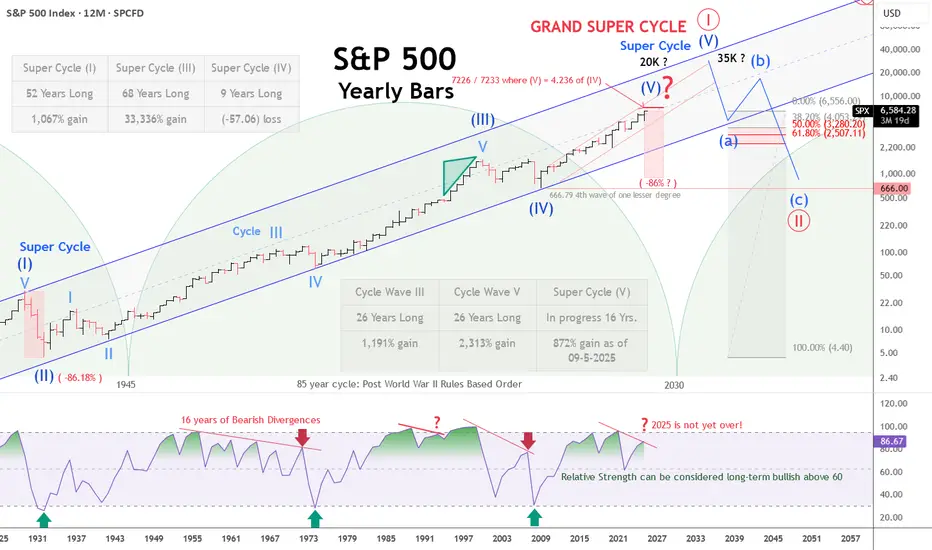
Today, we’re exploring a yearly bar chart of the S&P, which covers trends at the Super Cycle and Cycle degree, revealing the pending culmination of a Grand Super Cycle—a colossal trend spanning centuries.
Buckle up as we unravel the rhythms of the stock market's epic ride!
The SUPER CYCLE:
Let’s start with the big picture: five waves of advance at the Super Cycle degree.
According to Ralph Nelson Elliott, with the sole exception of the GRAND SUPER CYCLE, the Super Cycle is the largest of all trends, a monumental set of impulsive and corrective waves that will set the tone and punctuate Grand Super Cycle terminals for Centuries to come—or at least through the fall of Empires or Civilizations.
Each of these waves tells a story of growth, correction, and renewal. The current Grand Super Cycle has been shaping markets and Nations for over a century. We can see this Grand Super Cycle unfolding in waves of Super Cycle dimension.
WAVE COUNTS:
The chart highlights five waves at Super Cycle degree: the first lasted 52 years with a gain of more than 1000%, the third stretched 68 years with a staggering 33,336% gain, and the fourth, a shorter 9-year span, saw a -57.06% loss, which marked the GFC low in 2009.
We are currently in the fifth Super Cycle wave, which is still unfolding and could mark the end of this Grand Super Cycle at any moment.
In contrast, the post-GFC "everything bubble" Crack-Up BOOM can persist to the upper trend channel boundaries noted near 18k and 35k.
Zooming in, we encounter the fractal Cycle degree waves comprising Super Cycle (III). Take Cycle Wave III and Cycle V, both 26 years long, delivering gains of 1,191% and 2,313% respectively.
And from the Super Cycle wave (IV) low in 2009, we are 16 years into Super Cycle Wave V, with an impressive 872% gain as of September 5, 2025.
This current wave could easily extend further, but its length is sufficient to suggest we may be nearing a pivotal turning point that might end the Grand Super Cycle with a sufficient black swan trigger.
The Fourth Turning:
Now, let’s touch briefly on the 85-year cycle, a rhythm that syncs beautifully with the concept of the "fourth turning"—a period of crisis and transformation.
The last one kicked off in 1945, post-World War II, ushering in the rules-based order that America and the West thrived in—an order that is arguably destined to end by 2030 if it hasn't already. This turning cycle hints at a historic shift on the horizon, or one that is currently already underway.
THE RSI:
Glance at the lower pane of the chart, where the Relative Strength Index (RSI) reveals a tale of caution. Since 1955, we’ve endured 16 long years of multiple bearish divergences—times when the market’s price and momentum didn’t align, signaling trouble ahead.
I like to call this the bearish divergences that cried wolf for nearly a generation! Note that it wasn't until the RSI closed beneath the mid-line that the sell-off into the 1974 low registered an oversold reading.
We saw the RSI fail again upon the new highs in 1993-94 following the highs in 1987.
1995 kicked off the infamous five years of irrational exuberance, which led to the tech bubble peak and subsequent crash into the 2002 low.
Not to be outdone by the 2000 blow-off top, the 2002 low ushered in yet another five years of irrational exuberance, culminating right in time for the 2008 Global Financial Crisis. This time, the RSI finally got it right on the first go round.
Currently, against the highs printed in 2021, the V-shaped snap-back rally following the mini bear market of 2022, the move to new highs in 2024 has flagged a bona fide bearish divergence. It will be interesting to see how the RSI looks after the close of 2025.
These divergences are like red flags, whispering that the party might not last forever, even though it may.
Price Targets:
So, where might this Super Cycle Wave V take us in terms of price? Let’s apply a Fibonacci projection—specifically, where Wave V equals 4.236 of Wave IV.
Doing the math, from the Wave IV base at 666.79, we’re looking at a target of around 7,226-7,233 on the S&P 500.
That’s only about 10% upside from recent highs—not quite the blow-off top of 18K or 35K, but a target to approach with eyes wide open.
Now, let’s consider a sobering scenario:
If Super Cycle Wave V ends here, or north of 7K, signaling the close of Grand Super Cycle ONE, history might repeat itself with a bear market akin to 1929’s four-year plunge.
An 86% decline could drop the S&P to around 917—still well above the Wave IV low of 666.79, another common target, but a stark reminder of the cycles’ power.
In Closing:
Thank you all for listening and reading if you've gotten this far. This was my first video. I got blindsided and cut off by the time constraint, so I apologize for the abrupt ending.
The market’s cycles and waves are a dance of numbers and human spirit, and we’ve only scratched the surface of their grandeur and implications.
Stay curious, stay informed, and keep your life vests on while riding these waves, okay!
Grandsupercycle
Grand Super Cycle S&P 500 Analysis: Riding the Fifth of the FiftIn Elliott Wave Theory, we're navigating the vast ocean of market cycles, and currently, we find ourselves in uncharted waters: the fifth of the fifth of the Grand Super Cycle or Grand Millennium Wave. This level of analysis delves into macroeconomic cycles of epic proportions, spanning centuries, and it's raising questions, even some of a doomsday nature.
1. The Fifth of the Fifth: Unprecedented Territory
We're accustomed to analyzing cycles within cycles, but reaching the fifth of the fifth at the Grand Super Cycle level is unprecedented. This raises profound questions about the nature of market behavior, suggesting we're witnessing historical shifts in global economics.
2. Where Does the Fifth End?
The big question is where this fifth wave concludes. The sheer scale of this cycle prompts speculation about significant market events, perhaps even a structural shift in the global financial system.
3. "The Fifth Wave" Movie: Coincidence or Significance?
The release of the movie "The Fifth Wave" in 2016 adds an intriguing layer to this analysis. While it's speculative, it's fascinating to ponder if there's a connection between cultural expressions and market cycles. Are there subtle signals in popular media about broader economic shifts?
4. Significance of the Next Correction
To grasp the significance of our next correction, we need to understand the scale of the Grand Super Cycle. Consider that the Tech boom and bust, the 2008 real estate Great Recession, and even COVID-19 can be contained within smaller waves. For instance, the Tech boom and bust and 2008 recession could be viewed as an ABC correction in the wave 2 of the Grand Super Cycle, while COVID-19 might be seen as an expanded flat wave within the Millennium Super Cycle, itself a part of a larger wave three of a step up in the Grand Millennium Super Cycle.
Conclusion:
Analyzing the S&P 500 at the Grand Super Cycle level is like navigating through the cosmos of economic cycles. We're currently at a juncture never seen before, the fifth of the fifth, prompting profound questions about the future trajectory of global markets. While we can't predict with certainty where this wave will end, understanding its scale and significance can provide valuable insights into potential market movements and economic shifts on a grand scale.
(Note: This analysis is speculative and based on Elliott Wave Theory. Investors should conduct thorough research and consult with financial professionals before making any investment decisions.)

20 Year SPX Bear MarketAfter looking over and fine-tuning my analysis for SPX over the past few months, I think I've calibrated things as good as they will get for now (barring any new, major developments which would force me to re-adjust my wave count). SPX has been on a tear from 1877 to 2022 for a very large Grand Supercycle (a 5 wave move lasting more than 100 years).
Though timely corrections were seen during the Great Depression (1929-39 roughly) and during the 9-11/Iraqi War timeframe (early 2000s), to name a few, the Bulls have always responded and claimed higher highs afterwards. Giving SPX traders the feeling that it will never ever come down.
However, the injection of the COVID era seems to have forced the SPX into a much different and more dramatic phase potentially. Though a new all-time high was seen after the introduction of COVID-19, the lingering nature of this disease and its effect on global economies will continue take a toll on the US Stock Market as it seems.. Surely, I'm no Doctor but I think SPX has a case of Long COVID to put it more plainly.
Beyond the fractal by fractal wave counting, I've also heavily considered fibonacci levels plus RSI readings. Things to note:
1) Wave 5 terminates between +1.38 or +1.618, compared to the size of Wave 4. Currently the hypothetical Wave 5 sits at more than +2(00%) the size of Wave 4, technically making it extended.
2) The Elliott Wave science suggests that RSI has the lowest peak in Wave 1, the highest peak in Wave 3 and an obvious divergence in the peak of Wave 5's divergence. Looking at the circled areas of SPX's RSI window, all of these guidelines seem to ring tru. Its clear to see that the RSI peaked in Wave 3, its also clear to see that although Wave 5 made a higher-high in price action - the RSI level terminated at a lower level compared to Wave 3, its also clear to see that the RSI in Wave 1 was the lowest of the three-trending-waves (1,3 and 5; Waves 2 and 4 are corrections against the trend).
As for price levels, its my belief that if SPX cannot reclaim and hold support above 4000=4600 in the next few years to come then the pending pump (which should initiate in the days/weeks ahead) will only serve as a correction/relief rally/retracement. WIthout 4000-4600 turning into support (in the next few years), I have reason to believe that the Bear Markets is even more likely (see outline below).

STRONG impulsive sub-millennium degree BULLISH WAVE 3 UNDERWAY!!LITECOIN just began a STRONG IMPULSIVE WAVE 3 of sub-millennium degree from 75.37 which is going to be subdivided into WAVES I, II, III, IV, V of grand-super-cycle degree. Currently LITECOIN is on a WAVE (III) of I, with a projected TARGET AREA 99.34-99.71 for WAVE I of 3. Please check your chart and let me know if you agree.

$3k BULLISH WAVE ((b)) of (X) UNDERWAY: TARGET AREA 29443-29742BITCOIN is currently going down in a MILLENNIUM WAVE (X), and subdivided into waves ((a)),((b)),((c)). This MILLENNIUM wave is the 2nd largest wave cycle in the history of BITCOIN. Now, after hitting my previously projected TARGET AREA of 27558-27330 which ended WAVE ((a)) of (X), I am now projecting that BITCOIN is GOING UP $3k temporarily in a WAVE ((b)) of (X) to TARGET AREA 29443-29742. This BULLISH GRAND-SUPERCYCLE WAVE ((b)) is going to be subdivided into WAVES (w),(x),(y). WAVE (w) will be subdivided into 5 waves, WAVE (x) into 3 waves, and WAVE (y) into 5 waves. Please comment below and let me know what you think.

$3K DROP: WAVE V of (V) of ((a)) to target area 27558 - 27302!!!BITCOIN is now UNDERWAY heading down to a very significant PIVOT POINT: the end of WAVE ((a)). WAVE ((a)) is a GRAND SUPERCYCLE Elliot Wave and is the 4th largest cycle in the history of BITCOIN. Please notice how BITCOIN just made a LOWER LOW with WAVE IV relative to WAVE (IV) of SUPERCYCLE DEGREE. I believe this means WAVE IV just ended and WAVE V of (V) of ((a)) is now UNDERWAY down to target area 27558 - 27302. This means the end of wave ((a)) and the start of wave ((b)) going up in 3 waves (A), (B), and (C). Please check your chart and let me know if you agree or not.

Grand Super Cycle - Epic Crash Upward progression for 19.93%. Followed by a super crash 71.85%. Beginning between August 2021 and Jan 2022. Double bottom in December 2024.

NASDAQ 100 Index Supercycle Wave 5 ForecastShown is a forecast of Supercycle Wave 5 in the NASDAQ 100 Index. I also break down the structure of the Supercycle Wave 5 we're currently in and lay out a target zone for Grand Supercycle Wave 5, Submillennium Wave 5, Millennium Wave 1, and Millennium Wave 2 - which should prove to be the largest decline in the history of the Index.
___________________________________
Blue Line: Primary Forecast
Yellow Line: Secondary Forecast
Orange Line: Tertiary Forecast
___________________________________
Pink: Cycle Degree
Purple: Supercycle Degree
Blue: Grand Supercycle Degree
Cyan: Submillennium Degree
Green: Millennium Degree
___________________________________
I suspect that we're still in Cycle Wave 4 with more downside to come currently, but, at least for the next couple of years, I don't see an end coming to the historic bull run we've been lucky enough to witness.
I'm not claiming this forecast to be set in stone; this is merely my interpretation of where we are in the progressive structure of this index based on the rules and guidelines laid out in the Elliott Wave Principle. If you believe in the Wave Principle, then at the very least this analysis should display the form that progress will take, with time and amplitude estimated based on common occurrences found in all degrees of waves of all manner of things that experience non-linear progress over time. I will continue to conduct daily analysis of the index to alert me to any changes in the long term trend, but I feel confident in knowing where major points of resistance and support should be for the next several years and in what the market will not do under any circumstance aside from total collapse.

btc could use a dipExpecting a few 30% dips on the way up.
Previous Idea fully reached target. Significant level were hit today.
Still bullish overall!

BITCOIN LONG--Non-logarithmic-- Wave 3 -- BTC ATH within monthsThis is a detailed breakdown of the Elliot wave structures for bitcoin on the Grand SuperCycle time frame.
We are currently just beginning wave 1 of the always most impulsive wave 3 of the Grand SuperCycle timeframe.
Truly impressive times you are all observing.

BITCOIN LONG Elliot Grand SuperCycle Wave 3 Underway.As the title suggests, we have now begun wave 1 of wave 3 of the Grand Super Cycle time frame since the inception of Bitcoin.
The drop from 20k to 3 k was a 3 wave WXY complex zig -zag correction.
We have now seen wave 1 and wave 2 of wave 3 of the grand super cycle time frame complete.
Wave 1 was the impulsive 5 wave move from 3k to 14k.
The 5 wave nature of that move invalidates other less knowledgeable elliot wave analysts claiming another drop in some kind of zig zag.
That is impossible when you consider the structure of these waves.
(IE, the drop from 20k to 3 k was a 3 wave move as seen here, not a 5, therefore, not a zig-zag.)

CGC exiting grandsupercycle descending channel. Elliot FLAT abcAs title suggests,
CGC is exiting its long term descending channel after completing a elliotwave FLAT abc correction.
Bottom @ 1.272 Fib trend extension.
