Graph found potential support
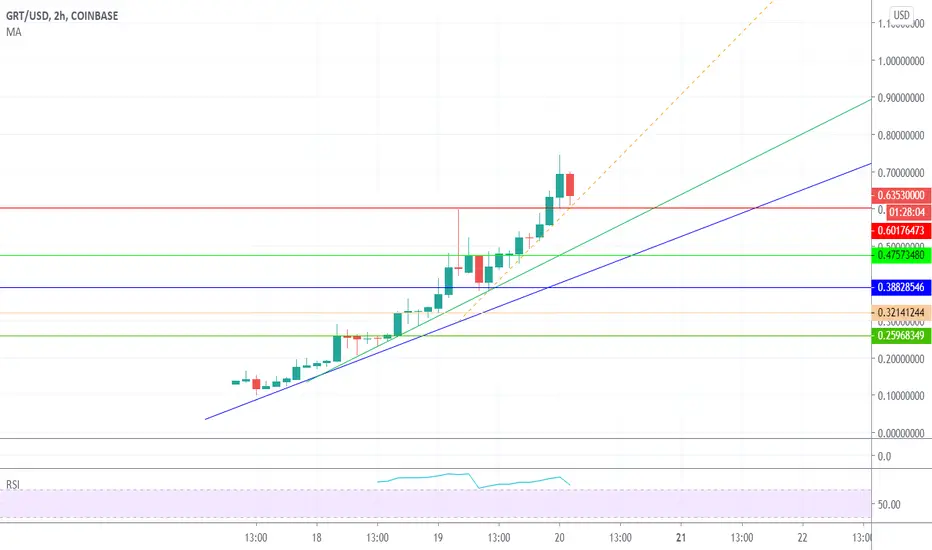
Looks like #bull flag pattern to me.
Also found a potential support at 0.5 fib.
If the support holds and the downtrend is broken then it's 99% signal to buy !
Graph


The GraphAPI Graph
API Graph is used by such giants as Facebook, Twitter, GitHub.
Now is a good price to buy if you haven't bought it yet. If you bought it, then hold.
The first target is the psychological $ 1 mark.

Taking a long position on GRTI have observed this uptrend channel formed on GRT/USDT. It appears to be in an uptrend based on the higher highs and higher lows displayed on the 15-minute chart. The uptrend shows support along the 50EMA. The coin is new to Binance and should be traded with caution. If you decide to trade this pair, it would be best to use a tight trailing stop loss.

Graph to 1€ !look at the chart, isn't it beatiful ?
buy this coin while you still can for cheap !
if this crypto follow the parabolic trend lines,
then it's safe for it to go for 1€.
MACD indicator show same thing happened again.
Will it happen again ? Let's see !

GRT - Web 3.0 - The Graph (The Google of Blockchain) Coin has immense potential. Will become the new Web 3.0.
DYOR but I’m expecting coin to be $1 by Xmas. And potentially $30+ next year!

Open Graph - GRTThis is not so much of a Technical Analysis.
This is an introduction to a project I have been waiting a long time for. Open Graph provides a valuable service to the crypto industry in general, and because of this - the token will become well adopted. I believe this will continue to go up and outpace Bitcoin for a little while longer.
Buy the dips!
Just like Injective Protocol, this is following its own pattern. Up 700% since it was traded on Coinbase. I am buying the dips.
New Char LayoutHere is a little bit about my set up:
1. I changed the background color, candle (body and wick) colors and general appearance in the "Settings tab".
2. Added an indicator to remind of the sessions.
3. Starred my favorite tools for easy use.
4. I used the "Save Drawing Template As..." feature to save what I use frequently on every tool.
*This post is for new users. These were my must do's before I even thought of trading with trading view. Hope this helps!
*My confirmations are not posted.
U

SELL TEZOS XTZSell XTZ and buy BTC or USDT, in my opinion bulls for this shitc is over and in the long term we will see ATL 0.000087 levels

Still undecisive. Still alt all the way)Expecting XRP to drop one more time
before the high-table speculators kick in.
It is still uncertain whether the price
will pump.
Better be bear, than sorry)))
For a while. See the levels.
I don't believe that
the bottom is in.

EURJPYPodemos observar como actualmente acaba de rebotar en un triple techo que además es nuestro KEY LEVEL diario con lo que después de rebotarlo esperamos que caiga o bien en monthly o bien que mínimamente nos haga un punto 3 en la tendéncia alcista para que suba a retestear el triple techo, además encontramos un HCH que puede ayudarnos a confirmar la posterior caída para volver a subir una ve ya hemos hablado de:
1. Key levels
2. Tendencias
3. Price action
vamos por el 4, Fibo, el cual también nos indica una caída del valor hasta el 61% que es una zona interesante ya que al valor le ha costado mucho superarla anteriormente, además coincide con la caída que debería hacer después de ver el HCH.
En Conclusión: Baja para subir

Bull TrapClassic bull trap graph. Don't you think?
I'll stay out of the buying bitcoin and I will change my mind, only if we get fixed above 2nd downtrend line. Plan to buy btc at 6900 and lower
Tweets are my opinions, not financial advice
My twitter: @CryptoWolfy7


Bitcoin Dominance to 97% ?Looking at a Bitcoin dominance chart, I am finding lots of technical facts that BTC dominance is slowly going to 97%, do you agree with me? After my drawings I have converted all of my cryptocurrency to Bitcoin as the graph looks terrifying for other crypto market. I prefer to stay out of trading and just hodl BTC as it looks very painful for the rest of the crypto market. Looking at a graph we have "W" (marked red) which is an uptrend for Bitcoin Dominance, we have a major gap in price, which needs to be filled in. We also have an upside down head and shoulders (marked blue)! We broke many tough resistance levels, which now became support level's. There is one more strong downtrend resistance line (starting from 21st June 2016 going along 19th February 2017) to beat and the road is open to 70-73% BTC Dominance. I would like to hear what others think, sorry for my drawings )
PS I'm not saying that the other crypto is going to be cheaper with USD, I think that BTC will moon against dollar and the other crypto

CHFJPY AnalysisKindly refer to the rectangle. Based on previous history. It indicates that the graph may go long. The reason for this deduction is due to graph struggling to go short. Please feel free to comment.

EURUSD AnalysisEURUSD will make a short turn as there is small pinbar indicator. Please feel free to comment and provide feedback.

GBPUSD AnalysisBased on previous support ( please refer to support zone). There seems to be a strong indicator of the graph going long. Please feel free to comment!!

IShort

Facebook INC. Short Term Bounce Play!There seems to be a bounce play here, with a safe exit labeled above.
I believe this may see lower as for the first time ever the weekly cloud has turned. FANG stocks are in trouble.
We have bullish indicators everywhere, with momentum pushing slightly bullish.
Its easy to have a tight stop loss right below the 160 area, or just lower low from this dip to reduce risk.
Happy trading, debating and speculating.
Be sure to FOLLOW for updates and check out my other charts for amazing calls.
F

NOKIA GRAPH ANALYSIS (trying new techn) - Multi path predictions*Note - this is my first graph of not using chart patterns but just trying to fit stuff together to predict. Please take the prediction with a grain of salt.
The marked intersection point seems like the most likely point for a breakout with multiple conversions. Looking at the different paths, it should be possible to predict the future direction!
Again, feedback would be awesome this is legit just a random graph I made.


Similar trends to ltc and eth leading up to a breakout Looking at the clear trend its following very similar to LTC and ETH, the two channels leading up to a potential breakout.
looking for volume increase for confirmation
B
