SHORT ON GBP/USDGU is over brough and has given us a change of character to the downside on the lower timeframe.
The (DXY) Dollar is also showing strength to rise from taking out previous day/week lows.
I and looking to catch 100-150 pips on GU.
Gu

GBPUSD Intraday Technical AnalysisGBPUSD Intraday Technical Analysis - 10 Nov 2025
British Pound/US Dollar at 1.31545 (3:15 PM UTC+4) — key confluence setup emerging.
📌 Market Context: Wyckoff accumulation phase post-September swing; Dow Theory secondary correction fading; Gann Square-of-9 targets 1.3180/1.3120.
🗺️ Multi-Timeframe Pulse:
1D: Double-bottom pattern near 1.3050; RSI 52 (neutral bias); Ichimoku cloud support 1.3020; bullish pennant forming.
4H: Rising channel 1.3120-1.3200; EMA21>EMA50>EMA200 (golden cross); VWAP from Oct 15 = 1.3145 (neutral pivot).
1H: Flag continuation above 1.3140; BB midline 1.3150; VWAP slope slightly bullish after 1.3100 test.
30M: Symmetrical triangle 1.3120-1.3170; hidden bull divergence on RSI; volume declining pre-breakout.
15M: Bull flag over 1.3140; Tenkan>Kijun bullish cross; stochastic RSI reset ready.
5M: Falling wedge retest 1.3140; hammer candlestick confirms intraday support; watch false breakout above 1.3175.
🎯 PRIMARY LONG SETUP
Entry: 1.3140-1.3155 (flag support + VWAP) — confirm on 15M bullish close >1.3160.
Stop Loss: 1.3115 (below triangle base).
Target 1: 1.3175 (+30 pips).
Target 2: 1.3200 (+55 pips — channel top).
Target 3: 1.3240 (+95 pips — harmonic extension).
Confirmation: RSI>55, volume spike >20% avg, VWAP support intact.
⚡ MOMENTUM SCALP: Add above 1.3200 ONLY if RSI>65 + sustained volume; trail stop to 1.3180.
🔻 REVERSAL SHORT SETUP
Entry: 1.3225-1.3250 (supply zone) — trigger on bearish engulfing + RSI divergence.
Stop Loss: 1.3280 (above channel resistance).
Targets: 1.3190 → 1.3150 → 1.3110 (Gann support).
Confirmation: 5M/15M RSI bearish divergence; BB upper band rejection on 1H.
🚨 BREAKOUT PROTOCOL:
BULL: 1H close >1.3200 confirms breakout; target 1.3300; move stop to BE+10.
BEAR: 1H close <1.3120 with volume expansion = retest 1.3050 double-bottom support.
📊 INDICATOR SNAPSHOT: BB squeeze (30M) tightening; MACD histogram positive; VWAP slope neutral-bullish; EMA21 acting as trigger line.
⚠️ PATTERN ALERTS: Harmonic bat PRZ at 1.3250; rising channel failure <1.3140 = Wyckoff spring signal; H&S risk if neckline 1.3090 breaks.
📈 TIMING & RISK: UK inflation data Nov 12 elevates volatility; BoE speakers expected; Gann 90° window 18:00 UTC. Risk ≤1% per setup; avoid chasing; lock partials at TP1.
Educational analysis only. Align entries with your plan, manage risk, adapt to price action.

GBPUSD Could Grow 12-13% In Symmetric MoveCable in a large two-leg consolidation
The first big move in 2022–2023 travelled 27%
It formed two smaller legs joined by a brief corrective pause (orange circle)
Then the market entered a wide corrective phase (yellow trendlines)
lasting through 2023–2025
After that, the second large move has been unfolding
The first leg was softer and the mid correction (orange circle) deeper
but the structure remains alike
Last week’s candle printed a Hammer — clear reversal
suggesting the end of consolidation and start of the final leg up
Target for this leg equals the length of the first large move
→ $1.4870
That’s roughly +13% from the current $1.3160
There is another closer target based on symmetry of smaller legs within current large move
I marked it with green price measurement arrows, it hits below larger target of 1.4718
That’s almost +12% from the current $1.3160

GBPUSD TRADING SETUP PLAYBOOK# 💷 GBPUSD (GBP/USD) COMPREHENSIVE TECHNICAL ANALYSIS 🎯
## Week of November 10-14, 2025 | Intraday & Swing Trade Mastery
Current Price: 1.31599 | Entry Point: November 8, 2025, 12:54 AM UTC+4 📊
## 🔍 EXECUTIVE SUMMARY - MULTI-TIMEFRAME PERSPECTIVE
GBP/USD is trading at a critical technical inflection point with powerful multi-timeframe alignment signaling imminent directional breakout. Elliott Wave analysis reveals completion of corrective cycles, positioning for next impulse leg targeting 1.3250-1.3400 extension zone with strong momentum. Bollinger Bands display classic compression squeeze pattern —volatility condensation preceding directional explosion. RSI across all timeframes maintains neutral-bullish bias (50-66 range)—optimal momentum positioning without extreme overbought conditions. Volume clustering at 1.3120-1.3200 represents significant institutional accumulation foundation. Wyckoff spring tests near 1.3050-1.3080 provide aggressive entry triggers. Harmonic pattern convergence at 1.3280-1.3350 resistance signals breakout confirmation with measured move targets extending to 1.3450+. Bank of England policy expectations support directional clarity emerging this week.
## 📊 TIMEFRAME-BY-TIMEFRAME ANALYSIS
### 5-MINUTE (Scalping Precision) ⚡
Candlestick Formation: Japanese candles reveal micro-consolidation with breakout attempts at support zones. Evening Star rejection formations detected at 1.3250-1.3300 intraday resistance creating reversal opportunities.
Elliott Wave 5M: Sub-wave completion indicates Wave 4 micro-consolidation finalizing. Wave 5 breakout anticipated above 1.3180-1.3220 with targets 1.3300-1.3360 (measured move).
Bollinger Bands: Upper compression mode—middle band at 1.3160 acts as pivot point. Lower band rejection (1.3080-1.3110) creates scalp-long setups with excellent risk/reward.
RSI (14) Analysis: RSI oscillating 46-64 range—neutral territory with minor divergences forming. Bullish divergence at 1.3080 support signals buyer engagement; caution on 70+ resistance.
Micro Support/Resistance: 1.3080 (micro-support) | 1.3140 (POC cluster) | 1.3180 (pivot) | 1.3260 (intraday resistance) | 1.3330 (scalp target)
Volume Signature: Volume concentrated 1.3140-1.3200 zone—institutional marker. Breakout volume >55% above average required above 1.3260 for sustained move above 1.3350.
VWAP Alignment: Price oscillating around session VWAP at 1.3155—each touch generates scalp opportunity. Upper VWAP band at 1.3280; lower support at 1.3080.
### 15-MINUTE (Quick Swing Gateway) 🎢
Candlestick Patterns: Engulfing bars forming at support zones—bullish engulfing at 1.3100 zone confirms reversal attempts. Three-candle patterns (flag continuation) with 60-100 pips breakout potential.
Harmonic Pattern Recognition: Gartley Pattern potential completion near 1.3090-1.3160 PRZ (Potential Reversal Zone). Exceptional risk-reward at 1:3.8 for harmonic traders. Butterfly variant also forming.
Wyckoff Accumulation Phase: Classic accumulation evident—small barometer move (SBM) nearing completion. Spring test anticipated 1.3000-1.3040 zone; markup phase targets 1.3350-1.3450.
Bollinger Bands (15M): Band squeeze intensifying—historical volatility expansion suggests 80-140 pips moves follow. Upper band resistance at 1.3320; lower band support at 1.3000.
Volume Profile (15M): Point of Control (POC) at 1.3160—prime concentration zone. Volume surge >60% required confirming breakout above 1.3280. Imbalances favor upside significantly.
Ichimoku Cloud (15M): Price consolidating below cloud edge—Tenkan-sen at 1.3280 = resistance pivot. Kijun-sen (1.3230) = critical secondary support. Cloud support 1.3050-1.3140.
EMA Structure: EMA 9 (1.3190) above EMA 21 (1.3140)—bullish alignment confirmed. Price above both = intraday strength maintained.
### 30-MINUTE (Intraday Swing Axis) 🔄
Pattern Formation: Symmetrical Triangle pattern consolidating with apex near 1.3280. Ascending triangle variant shows bullish bias—breakout above 1.3240 targets 1.3360-1.3450 extension.
Dow Theory Application: Confirming higher highs/higher lows structure. Secondary trend bullish; pullbacks to EMA 20 (1.3180) = optimal swing entry zones identified.
RSI Divergence Setup: Positive RSI divergence confirmed—price making lower lows (1.3050) while RSI forms higher lows (40 level). Classic reversal setup targeting 1.3300 minimum.
Exponential Moving Average: EMA 9 (1.3210) = core support pivot. EMA 21 (1.3140) = secondary support. EMA 50 (1.3000) = structural hold level. Bullish ribbon alignment intact.
Support Architecture: 1.3000 (EMA 50/structural) | 1.3080 (demand zone) | 1.3140 (volume cluster) | 1.3180 (EMA 9 dynamic)
Resistance Architecture: 1.3240 (triangle formation) | 1.3310 (measured move target) | 1.3370 (weekly resistance) | 1.3450 (extension)
Volume Analysis (30M): Increasing volume on recent bars—accumulation signature strong. Buy volume exceeding sell volume confirms institutional interest significantly.
### 1-HOUR (Core Swing Trade Engine) 🎯
Elliott Wave Structure: Major wave analysis suggests Wave 3 completion near 1.3350. Current Wave 4 correction targets 1.3200-1.3250 support zone. Wave 5 impulse anticipated—target: 1.3450-1.3550.
Pennant Formation: Classic Bullish Pennant pattern forming—breakout confirmation above 1.3280 validates pattern. Pole height measured move = 1.3450+ realistic target.
Bollinger Bands (1H): Upper band at 1.3380 = squeeze breakout target. Middle band (1.3280) = bullish support zone. Lower band rejection (1.3000) creates swing longs with excellent R/R.
VWAP Daily: GBP/USD trading above daily VWAP at 1.3120—bullish gradient confirmed. Each hourly candle close above VWAP strengthens continuation probability.
Volume Profile Hotspot: Heavily traded at 1.3120-1.3200 (accumulation zone) and 1.3280-1.3350 (resistance cluster). Imbalances above 1.3380 suggest vacuum-fill potential.
Ichimoku Cloud Alignment: Price above Senkou Span A (1.3280) & Span B (1.3230)—cloud thickness indicates strong support. Chikou Span above candles = bullish confirmation. Cloud color: BULLISH GREEN.
Gann Theory Application: 45-degree angle from swing low (1.2950) establishes rally trajectory. Resistance at 38.2% Fibonacci extension (1.3310) precedes aggressive breakout phase.
Support Tiers 1H: 1.3000 (structural hold) | 1.3080 (EMA support) | 1.3140 (Kijun-sen) | 1.3200 (accumulation zone)
Resistance Tiers 1H: 1.3280 (breakout trigger) | 1.3340 (extension) | 1.3380 (major level) | 1.3450 (impulse target)
### 4-HOUR (Swing Trade Thesis Foundation) 💼
Inverse Head & Shoulders Pattern: Potential IH&S formation completing—left shoulder (1.2950), head (1.2880), right shoulder completing (1.3000-1.3080). Neckline breakout at 1.3280 targets 1.3450-1.3600 extension.
Wyckoff Accumulation Deep Dive: Institutional buying signature evident—SBM (small barometer move) completion imminent. Spring test to 1.2980-1.3020 anticipated; subsequent markup phase targets 1.3450-1.3600.
RSI 4H Analysis: RSI at 54-70 range—bullish bias maintained. Room for upside extension without extreme overbought. RSI above 76 targets 1.3500+; below 32 = defensive posture required.
Cup & Handle Formation: Potential bullish Cup pattern visible on 4H—handle stabilization near 1.3160-1.3240. Breakout above handle (1.3310) targets cup depth extension = 1.3450-1.3580.
EMA Ribbon Structure: EMA 8 (1.3240), EMA 13 (1.3220), EMA 21 (1.3140), EMA 50 (1.3000), EMA 200 (1.2750)—BULLISH ALIGNMENT PERFECT. Compression/expansion cycles identify momentum phases.
Support Tiers 4H: 1.2950 (structural support) | 1.3000 (accumulation) | 1.3120 (pivot) | 1.3200 (demand cluster)
Resistance Tiers 4H: 1.3280 (key breakout) | 1.3340 (extension) | 1.3380 (major target) | 1.3500 (weekly projection)
Volume Signature 4H: Accumulation volume bars > distribution bars—bullish bias maintained. Volume nodes clustering at 1.3120-1.3200 indicate strong institutional support zone.
### DAILY CHART (Macro Swing Thesis) 📅
Elliott Wave Macro: We're potentially in Wave 3 of larger cycle—aggressive expansion still possible. Wave structure supports break of 1.3380 targeting 1.3550-1.3750 daily close objectives.
Double Bottom Recognition: Historical Double Bottom pattern near 1.2800-1.2950 support—confirmed breakthrough above 1.3280 neckline triggered. Second target near 1.3450-1.3600.
Bollinger Bands Daily: Upper band at 1.3550 = realistic daily target zone. Mean (1.3310) = healthy pullback support. Band slope indicates volatility expansion—expect 150-300 pips daily ranges.
Volume Profile Daily: Strong buying volume bar at 1.3000-1.3200 zone—institutional accumulation marker established. Selling volume decreasing—demand controls trend absolutely.
Ichimoku Cloud Daily: Cloud thickness growing—bullish trend strengthening substantially. Cloud support around 1.3150-1.3280 zone. Kumo breakout anticipated—targets cloud top at 1.3350-1.3450.
Harmonic Analysis Deep: Butterfly Pattern potential completion—PRZ at 1.3280-1.3350 suggests reversal zone OR breakout confirmation. Confluence amplifies probability of extension.
Gann Angles & Fibonacci: 50% retracement (1.3050) + 61.8% extension (1.3450) = key reversal zones. Gann fan angles suggest 1.3350-1.3450 as structural resistance before continuation.
Key Daily Support: 1.2880 (psychological/structural) | 1.3000 (accumulation zone) | 1.3120 (demand level) | 1.3200 (midpoint)
Key Daily Resistance: 1.3280 (breakout trigger) | 1.3350 (extension) | 1.3450 (measured move) | 1.3600 (weekly target)
Trend Confirmation: Higher highs & higher lows maintained—uptrend intact. Daily close above 1.3380 = strong continuation signal targeting 1.3700+ next level.
## 🎪 TRADING SETUP PLAYBOOK - NOV 10-14
### BULLISH SCENARIO (Probability: 81%) ✅
Trigger: 4H candle close above 1.3310 + volume surge (>55% above average) + RSI above 65
Entry Zone: 1.3240-1.3290 (with breakout confirmation signal)
Target 1: 1.3350 (TP1) | Target 2: 1.3410 (TP2) | Target 3: 1.3480 (TP3) | Target 4: 1.3600 (TP4)
Stop Loss: 1.3120 (below EMA/structural support)
Risk/Reward: 1:3.4 (excellent asymmetric setup)
Trade Duration: 18-72 hours (prime swing window)
### BEARISH SCENARIO (Probability: 19%) ⚠️
Trigger: Daily close below 1.3160 + volume increase + RSI divergence failure
Entry Zone: 1.3310-1.3450 (short setup)
Target 1: 1.3280 (TP1) | Target 2: 1.3200 (TP2) | Target 3: 1.3120 (TP3)
Stop Loss: 1.3550 (above resistance)
Risk/Reward: 1:1.5 (acceptable but lower probability)
Trade Duration: Watch for trend reversal confirmation first
## ⚠️ VOLATILITY & OVERBOUGHT/OVERSOLD CONDITIONS
Current Volatility Status: Moderate compression → Expect significant expansion imminent
5M/15M RSI: 46-64 range (neutral)—room for 30-60 pips movements | Scalp target zones
30M/1H RSI: 50-70 range (bullish bias, optimal zone)—sweet spot for swing entries
4H RSI: 54-72 range—approaching caution zone but room to extend | Safe for core swings
Daily RSI: 60-76 range (approaching extremes)—be defensive if daily RSI>78 | Take profits aggressively
Overbought Recognition Points:
RSI daily >77 combined with upper Bollinger Band rejection = immediate profit-taking
Ichimoku cloud top penetration fails (bearish candle rejection) = trend exhaustion signal
Volume declining on breakout attempt = false breakout warning signal
Harmonic pattern PRZ exact hit without follow-through = reversal likely imminent
Oversold Bounce Setups:
RSI 1H <32 on support touch = high-probability bounce back to 1.3310-1.3380
Price below EMA 50 (1.3000) + RSI <30 = aggressive accumulation zone
Spring test below 1.2990 with volume surge = Wyckoff spring reversal trigger
Harmonic pattern PRZ support bounce = measured move extension targets activated
## 🎯 ENTRY & EXIT OPTIMIZATION STRATEGY
### OPTIMAL ENTRY TIMING
For Scalpers (5M): RSI bounce from 42-50 zone after Band lower touch = 18-30 pips scalp (1-3 min holds)
For Quick Swings (15M-30M): 15M candle close above 1.3260 with 4H alignment = 80-130 pips swing (30 min-2 hour holds)
For Core Swings (1H-4H): 4H pennant breakout above 1.3310 on volume = 200-300+ pips target (hold 12-48 hours)
For Position Swings (Daily): Daily close above 1.3380 = continuation play targeting 1.3550-1.3700 (hold 5-7 days)
Best Entry Windows: Asian session overlap (22:00-8:00 UTC), London open (8:00 UTC), NY close (21:00 UTC)
### EXIT STRATEGIES & PROFIT TAKING
Take Profit Levels: TP1: Fibonacci 38.2% (1.3310) | TP2: Harmonic PRZ (1.3410) | TP3: Daily Band upper (1.3480) | TP4: Weekly target (1.3600)
Stop Loss Placement: Always below most recent swing low + 25 pips (strict risk management priority)
Trailing Stops: Activate at TP2—trail with 35-45 pips buffer for 4H+ trades (lock in profits)
Breakeven Exit: Move stops to entry after 1:1 risk/reward achieved—eliminate emotional trading
Partial Profit Strategy: Close 25% at TP1 | 25% at TP2 | 25% at TP3 | Let 25% run to TP4 (maximize winners)
## 🔔 REVERSAL & BREAKOUT RECOGNITION CHECKLIST
### REVERSAL SIGNALS TO MONITOR:
RSI positive divergence (lower price lows, higher RSI lows) = bullish reversal setup high probability
Candlestick engulfing patterns at support/resistance zones = trend reversal confirmation strong signal
Volume profile breakdowns (declining volume on breakout attempts) = false move warning immediate
Ichimoku Cloud rejection (price fails to penetrate cloud layer) = structural resistance confirmed
Harmonic pattern completion at exact PRZ = reversal zone probability increases significantly
Elliott Wave 5th wave failure (truncation) = impulse completion = reversal imminent trigger
Gann angle break through significant angle = trend line break = reversal trigger activated
### BREAKOUT CONFIRMATION RULES:
Close beyond resistance with >55% volume surge above average = confirmed breakout signal strong
RSI crosses above 60 for bullish breakout, below 45 for bearish breakout confirmation
VWAP alignment with directional move = institutional participation confirmation strong
Bollinger Band breakout with band expansion (squeeze release) = volatility expansion confirmed immediate
Multiple timeframe confluence (5M + 15M + 1H + 4H aligned) = highest probability setup attainable
Ichimoku Cloud break (price clears all clouds with bullish candles) = strong continuation signal
Volume imbalance (ask volume > bid volume) = directional sustain likelihood increases significantly
## 💡 WEEK FORECAST SUMMARY - NOV 10-14
Monday (10th): 🌍 Consolidation continuation near 1.3180-1.3240 zone. Range-bound trading anticipated. Early breakout direction watch crucial. Entry setups favor reversal plays at support zones.
Tuesday-Wednesday (11-12th): 📈 Prime breakout window opens —1.3310 represents key decision point. Expect 120-240 pips daily volatility. Breakout confirmation targets 1.3410-1.3500 extension. This is the optimal swing trade window all week. BoE speakers watch critical.
Thursday (13th): ⚠️ Potential profit-taking pullback after breakout (if triggered). Support retest of 1.3350-1.3280. Buying opportunity if pullback holds above 1.3240.
Friday (14th): 📊 Weekly close pattern formation critical. Extension run anticipated if above 1.3380. If above 1.3450 = week target 1.3600-1.3750 achieved. End-of-week positioning for next week.
## 📍 CRITICAL CONFLUENCE ZONES - KEY TARGETS
1.2950-1.3000: Major support zone (accumulation marker, Wyckoff spring area, structural hold)
1.3080-1.3160: Secondary support (EMA 9, demand cluster, psychological level, volume POC)
1.3200-1.3240: Micro-resistance cluster (consolidation squeeze zone, early breakout resistance)
1.3280-1.3360: KEY BREAKOUT ZONE (triangle apex, harmonic confluence, all timeframe resistance)
1.3360-1.3480: Primary upside target (Elliott Wave 5, daily Band upper, measured move extension)
1.3480-1.3600: Secondary extension target (Gann level, macro resistance, wave projection)
1.3600-1.3800: Weekly/monthly target (if wave 5 impulse extends beyond base projections)
## 🏆 RISK MANAGEMENT RULEBOOK
✅ 1) Position Sizing: Never risk >2% of account equity per single trade
✅ 2) Risk-Reward Ratio: Minimum 1:2.5 R/R on every entry—1:3+ preferred for swing trades
✅ 3) Profit Scaling: Close 25-50% at 1:1 ratio, let remainder run to 1:2+ targets
✅ 4) Stop Loss Discipline: Place stop IMMEDIATELY on entry—no exceptions (25 pips tight)
✅ 5) Breakout Confirmation: Avoid FOMO—wait for candle close confirmation + volume surge always
✅ 6) Daily Support Respect: Psychological holds (round numbers 1.3100 | 1.3400) matter—trade confluence not against
✅ 7) Time Management: Exit losing trades quickly (max 1:0.5 acceptable for educational losses)
✅ 8) Macro Alignment: Always check daily/4H bias before taking 1H or lower trades
## #GBPUSD #GBPUSDANALYSIS #FOREXTRADING #FXTRADING
#TECHNICALANALYSIS #ELLIOTTWAVE #HARMONICPATTERN #BREAKOUTTRADING
#SWINGTRADER #DAYTRADING #INTRADAY #FOREXANALYSIS #TRADINGVIEW
#BOLLINGER BANDS #RSI #ICHIMOKU #VWAP #TRADINGSTRATEGY
#WYCKOFFMETHOD #GANNTHEORY #DOWTHEORY #TECHNICALS #ANALYSIS
#SUPPORTANDRESISTANCE #VOLUMEANALYSIS #OVERBOUGHT #OVERSOLD #REVERSAL
#FOREXTRADERS #CURRENCYTRADING #BREAKOUTSETUP #TRADERSOFTWITTER
#TECHNICALTRADER #CANDLESTICK #PATTERRECOGNITION #CHARTANALYSIS #DAYTRADER
## 🎁 BONUS: DAILY PRE-MARKET CHECKLIST
Use this every morning before market open:
☑️ Check daily RSI (should be 60-74 for bullish bias continuation)
☑️ Identify support/resistance zones (1.3120 | 1.3240 | 1.3310 | 1.3500)
☑️ Verify 4H chart alignment (pennant/IH&S pattern status update)
☑️ Check Ichimoku cloud position (above/below = trend confirmation signal)
☑️ Review 1H Elliott Wave count (which wave are we trading exactly?)
☑️ Scan volume profile (POC = likely rejection zone area)
☑️ Set entry orders + stop losses BEFORE Asian session closes
☑️ Plan 3 Take Profit levels before entering any position
☑️ Monitor BoE/Fed speakers + economic calendar (interest rate expectations)
## 🌐 FOREX SESSION NOTES
GBP/USD trades 24/5 across all sessions . Highest volatility typically occurs:
Asian Session (22:00-8:00 UTC): Lower volatility—good for breakout setups forming
London Session (8:00-16:30 UTC): Prime trading hours —peak liquidity + volatility combination
NY Session (14:30-21:00 UTC): Secondary volatility surge—often confirms London direction
BoE/Fed Policy Impact: Monitor divergence—UK rate differential drives GBP strength vs USD weakness
💡 Disclaimer: This technical analysis is educational only. Always conduct your own due diligence and implement appropriate risk management. Past performance does not guarantee future results. Trade responsibly within your risk tolerance. Use stop losses on every position. Not financial advice.
Analysis Created: November 8, 2025 | Valid Through: November 14, 2025 | Updated Daily

GBPUSD Rejection: Has the Pound Topped Out?GBPUSD Rejection: Has the Pound Topped Out? A Critical Deep Dive for Nov 3-7
Hello, TradingView fam! 👋 The British Pound has had a powerful run, but it has slammed into a wall of sellers, closing the week at a pivotal 1.31440 . The euphoric buying has given way to a sharp rejection from the highs, and a classic bearish reversal pattern is now staring us in the face. Is this the end of the road for the bulls, or just a healthy correction before the next leg up? The week of November 3rd to 7th will be absolutely crucial.
Let's break down the technicals across all timeframes, blending timeless theories with key indicators to map out the opportunities ahead. 🇬🇧🇺🇸
🔭 The Macro Perspective: Weekly & Daily Charts - The Bullish Engine Stalls
The market tells you a story. Your job is to listen.
The higher timeframes show a strong uptrend that has encountered a formidable obstacle, and the bears are beginning to make their presence known.
Weekly Chart (1W) : While the primary trend under Dow Theory is still bullish, the most recent candle is a major cause for concern. We have a textbook Shooting Star ( Japanese Candlestick ), a powerful rejection candle, forming right at a multi-month resistance zone. This indicates that sellers have aggressively defended this level and have overwhelmed the buyers for now.
Daily Chart (1D) : The daily chart confirms the bearish reversal thesis. A potential Double Top pattern has emerged, with the second peak failing to hold. More importantly, there is a clear and significant bearish divergence on the RSI. Price made a higher high, but the RSI made a lower high, signaling a severe exhaustion of bullish momentum.
⚔️ The Swing Trader's Arena: 4-Hour & 1-Hour Analysis
This is where the most compelling evidence for a top is found. A classic and highly reliable reversal pattern has formed.
4-Hour Chart (4H) : This is the money chart for the week ahead. A clear and well-defined Head and Shoulders pattern is now in play. The left shoulder, head, and right shoulder are all visible, and the price is currently sitting directly on the crucial neckline support . A confirmed break and close below this neckline is a high-probability signal for a significant move lower. From a Wyckoff Theory perspective, this represents a completed distribution phase.
1-Hour Chart (1H) : The short-term trend has already flipped bearish. The price has broken decisively below the Ichimoku Cloud and the VWAP, both of which are now acting as dynamic resistance. Any rally back towards the 1.3180-1.3200 area is likely to be viewed as a prime selling opportunity by short-term traders.
🔬 The Intraday Microscope: 30M, 15M, & 5M Views
For intraday traders, the momentum is firmly with the sellers. The strategy is to follow the path of least resistance.
30M/15M Charts : These timeframes show a clear downtrend with a series of lower lows and lower highs. We can see a Bearish Flag pattern forming, which typically represents a brief consolidation before the next wave of selling pressure resumes. The RSI is staying below the 60 mark, indicating bearish control.
5M Chart : On the 5-minute chart, the VWAP is the line in the sand. As long as the price stays below it, shorts are in control. Scalpers should be cautious of any sharp bounces, as they could be bear traps . A sustained break above the VWAP would be the first sign that the intraday selling pressure is easing.
🎯 Actionable Trade Scenarios for the Week Ahead
The technical evidence is heavily skewed towards the bears, hinging on the confirmation of the Head and Shoulders pattern.
The Primary Bearish Breakdown Scenario 🐻
Entry: The highest probability entry is to short a confirmed 4H candle close below the Head and Shoulders neckline, which sits around 1.3100 . A more conservative entry is to wait for a breakdown and then short the retest of the broken neckline as new resistance.
Targets: The first target is the psychological support at 1.3000 . The measured move target for the Head and Shoulders pattern projects a move down towards the major support zone of 1.2920 .
Invalidation: A strong reclaim of the right shoulder's high, specifically a daily close above 1.3220 , would invalidate the bearish setup.
The Low-Probability Bullish Reversal Scenario 🐂
Entry: This is a counter-trend trade. It would require an extremely strong defense of the neckline around 1.3100 , confirmed by a large bullish engulfing candle on the 4H or daily chart.
Targets: A retest of the right shoulder at 1.3200 , and then the recent highs around 1.3280 .
Invalidation: Any confirmed 4H close below the 1.3100 neckline.
Conclusion: The Bears Are Knocking at the Door
The confluence of factors—a weekly rejection candle, daily bearish divergence, and a clear 4H Head and Shoulders pattern—presents a powerful bearish case for GBPUSD. While the bulls could still mount a defense at the neckline, the weight of the technical evidence suggests a breakdown is more likely.
This week is all about confirmation and execution . The plan is set. Now, we wait for the market to give us the signal.
What are your thoughts on Cable? Are you preparing to short the breakdown, or are you buying the dip? Let's discuss in the comments below! 👇
Disclaimer: This analysis is for educational purposes only and should not be considered financial advice. Trading involves significant risk. Always do your own research.

GBP/USD Long from current price.GU Weekly Outlook
After a steady bearish run last week, GU has now entered a strong discounted demand zone that previously caused a break of structure to the upside. Price has already shown signs of Wyckoff accumulation and is now pushing toward the nearest supply zones.
I’ve marked two potential supply areas close by, but I suspect the first (8hr) supply may be violated as the premium one above looks stronger. My plan is to look for short-term buys up to that supply, then prepare for potential sell setups to continue the overall bearish trend.
Confluences:
- GU has been bearish, breaking structure to the downside
- Two nearby supply zones above current price
- Price currently in a strong demand zone, likely to cause a short-term correction
- Liquidity resting below waiting to be taken
- DXY showing bullish movement, aligning with this outlook
P.S. I wouldn’t be surprised if GU rallies from this demand zone toward the premium level around 1.32000 before continuing its downward move.

GBPUSD FRGNT Daily Forecast -Q4 | W44 | D27| Y25 |📅 Q4 | W44 | D27| Y25 |
📊 GBPUSD FRGNT Daily Forecast
🔍 Analysis Approach:
I’m applying Smart Money Concepts, focusing on:
Identifying Points of Interest on the Higher Time Frames (HTFs) 🕰️
Using those POIs to define a clear trading range 📐
Refining those zones on Lower Time Frames (LTFs) 🔎
Waiting for a Break of Structure (BoS) for confirmation ✅
This method allows me to stay precise, disciplined, and aligned with the market narrative, rather than chasing price.
💡 My Motto:
"Capital management, discipline, and consistency in your trading edge."
A positive risk-to-reward ratio, paired with a high win rate, is the backbone of any solid trading plan 📈🔐
⚠️ Losses?
They’re part of the mathematical game of trading 🎲
They don’t define you — they’re necessary, they happen, and we move forward 📊➡️
🙏 I appreciate you taking the time to review my Daily Forecast.
Stay sharp, stay consistent, and protect your capital
— FRNGT 🚀
FX:GBPUSD

GBPUSD – Weekly FRGNT Forecast -Q4 | W42 | Y25📊 GBPUSD – Weekly Forecast
💡 Weekly FRGNT Insight
Q4 | W42 | Y25
Weekly Outlook 🔍📅
Here’s a concise breakdown of the current market structure 🧠📈
Higher time frame order blocks have been identified — these remain our key points of interest for potential reactions 🎯🧭.
Patience is key:
Wait for a confirmed break of structure (BOS) 🧱✅ before forming a directional bias. This keeps us disciplined and aligned with what price action is actually showing — not what we want to see.
📈 Risk Management Protocols
🔑 Core principles:
-Risk no more than 1% per trade
-Execute only at pre-identified levels
-Let alerts, not emotions, guide decisions
-Maintain your minimum 1:3 RR plan
🧠 Remember: You’re not paid for how many trades you take, but for how well you manage risk.
“Trade what the market gives — not what your ego wants.”
Stay mechanical. Stay focused. Let the probabilities play out.
FRGNT
FX:GBPUSD

SHORT ON GBP/USDGU is finally ready to drop. Nice Double top at resistance zone.
Looking to catch 300-400 pips to the previous low.

GBPUSD – DAILY FORECAST Q3 | W31 | D28 | Y25📊 GBPUSD – DAILY FORECAST
Q3 | W31 | D28 | Y25
Daily Forecast 🔍📅
Here’s a short diagnosis of the current chart setup 🧠📈
Higher time frame order blocks have been identified — these are our patient points of interest 🎯🧭.
It’s crucial to wait for a confirmed break of structure 🧱✅ before forming a directional bias.
This keeps us disciplined and aligned with what price action is truly telling us.
📈 Risk Management Protocols
🔑 Core principles:
Max 1% risk per trade
Only execute at pre-identified levels
Use alerts, not emotion
Stick to your RR plan — minimum 1:2
🧠 You’re not paid for how many trades you take, you’re paid for how well you manage risk.
🧠 Weekly FRGNT Insight
"Trade what the market gives, not what your ego wants."
Stay mechanical. Stay focused. Let the probabilities work.
FX:GBPUSD

GBPUSD Q3 | D22 | W30 | Y25📊GBPUSD Q3 | D22 | W30 | Y25
Daily Forecast Long 🔍📅
Here’s a short diagnosis of the current chart setup 🧠📈
Higher time frame order blocks have been identified — these are our patient points of interest 🎯🧭.
It’s crucial to wait for a confirmed break of structure 🧱✅ before forming a directional bias.
This keeps us disciplined and aligned with what price action is truly telling us.
📈 Risk Management Protocols
🔑 Core principles:
Max 1% risk per trade
Only execute at pre-identified levels
Use alerts, not emotion
Stick to your RR plan — minimum 1:2
🧠 You’re not paid for how many trades you take, you’re paid for how well you manage risk.
🧠 Weekly FRGNT Insight
"Trade what the market gives, not what your ego wants."
Stay mechanical. Stay focused. Let the probabilities work.
FRGNT

$GU (GBPUSD) 4HGBPUSD is forming a potential reversal structure with liquidity resting above and below the current range.
We expect a move to grab short-term liquidity above 1.3475 followed by a sweep of lows near 1.3369.
This would complete a rounded bottom structure, setting the stage for a bullish reversal.
Once the low is swept and buyers step in, the target sits around the 1.3600 handle.

GBPUSD LONG FORECAST Q3 D16 W29 Y25GBPUSD LONG FORECAST Q3 D16 W29 Y25
Welcome back to the watchlist GBPUSD ! Let's go long ! Alignment across all time frames.
Professional Risk Managers👋
Welcome back to another FRGNT chart update📈
Diving into some Forex setups using predominantly higher time frame order blocks alongside confirmation breaks of structure.
Let’s see what price action is telling us today!
💡Here are some trade confluences📝
✅Daily order block
✅1H Order block
✅Intraday breaks of structure
✅4H Order block
📈 Risk Management Principles
🔑 Core Execution Rules
Max 1% risk per trade
Set alerts — let price come to your levels
Minimum 1:2 RR
Focus on process, not outcomes
🧠 Remember, the strategy works — you just need to let it play out.
🧠 FRGNT Insight of the Day
"The market rewards structure and patience — not emotion or urgency."
Execute like a robot. Manage risk like a pro. Let the chart do the talking.
🏁 Final Words from FRGNT
📌 GBPUSD is offering textbook alignment — structure, order flow, and confirmation all check out.
Let’s approach the trade with clarity, conviction, and risk-managed execution.
🔑 Remember, to participate in trading comes always with a degree of risk, therefore as professional risk managers it remains vital that we stick to our risk management plan as well as our trading strategies.
📈The rest, we leave to the balance of probabilities.
💡Fail to plan. Plan to fail.
🏆It has always been that simple.
❤️Good luck with your trading journey, I shall see you at the very top.
🎯Trade consistent, FRGNT X

LONG ON GBP/USDGU is currently in its pullback phase of its uptrend.
We have a nice sell side Liquidity sweep being completed at this moment.
Price should now tap into previous demand that broke a high to repeat history and rise again.
Very Nice Setup over 300 pips on the table to the previous high/supply zone.

GBPUSD LONG FORECAST Q3 D15 W29 Y25GBPUSD LONG FORECAST Q3 D15 W29 Y25
Welcome back to the watchlist GBPUSD ! Let's go long ! Alignment across all time frames.
Professional Risk Managers👋
Welcome back to another FRGNT chart update📈
Diving into some Forex setups using predominantly higher time frame order blocks alongside confirmation breaks of structure.
Let’s see what price action is telling us today!
💡Here are some trade confluences📝
✅Daily order block
✅1H Order block
✅Intraday breaks of structure
✅4H Order block
📈 Risk Management Principles
🔑 Core Execution Rules
Max 1% risk per trade
Set alerts — let price come to your levels
Minimum 1:2 RR
Focus on process, not outcomes
🧠 Remember, the strategy works — you just need to let it play out.
🧠 FRGNT Insight of the Day
"The market rewards structure and patience — not emotion or urgency."
Execute like a robot. Manage risk like a pro. Let the chart do the talking.
🏁 Final Words from FRGNT
📌 GBPUSD is offering textbook alignment — structure, order flow, and confirmation all check out.
Let’s approach the trade with clarity, conviction, and risk-managed execution.
🔑 Remember, to participate in trading comes always with a degree of risk, therefore as professional risk managers it remains vital that we stick to our risk management plan as well as our trading strategies.
📈The rest, we leave to the balance of probabilities.
💡Fail to plan. Plan to fail.
🏆It has always been that simple.
❤️Good luck with your trading journey, I shall see you at the very top.
🎯Trade consistent, FRGNT X

GBPUSD LONG FORECAST Q3 D14 W29 Y25GBPUSD LONG FORECAST Q3 D14 W29 Y25
Welcome back to the watchlist GBPUSD ! Let's go long ! Alignment across all time frames.
Professional Risk Managers👋
Welcome back to another FRGNT chart update📈
Diving into some Forex setups using predominantly higher time frame order blocks alongside confirmation breaks of structure.
Let’s see what price action is telling us today!
💡Here are some trade confluences📝
✅Daily order block
✅1H Order block
✅Intraday breaks of structure
✅4H Order block
📈 Risk Management Principles
🔑 Core Execution Rules
Max 1% risk per trade
Set alerts — let price come to your levels
Minimum 1:2 RR
Focus on process, not outcomes
🧠 Remember, the strategy works — you just need to let it play out.
🧠 FRGNT Insight of the Day
"The market rewards structure and patience — not emotion or urgency."
Execute like a robot. Manage risk like a pro. Let the chart do the talking.
🏁 Final Words from FRGNT
📌 GBPUSD is offering textbook alignment — structure, order flow, and confirmation all check out.
Let’s approach the trade with clarity, conviction, and risk-managed execution.
🔑 Remember, to participate in trading comes always with a degree of risk, therefore as professional risk managers it remains vital that we stick to our risk management plan as well as our trading strategies.
📈The rest, we leave to the balance of probabilities.
💡Fail to plan. Plan to fail.
🏆It has always been that simple.
❤️Good luck with your trading journey, I shall see you at the very top.
🎯Trade consistent, FRGNT X

GBPUSD LONG FORECAST Q3 D11 W28 Y25GBPUSD LONG FORECAST Q3 D11 W28 Y25
It’s Fun Coupon Friday! 💸🔥
Professional Risk Managers👋
Welcome back to another FRGNT chart update📈
Diving into some Forex setups using predominantly higher time frame order blocks alongside confirmation breaks of structure.
Let’s see what price action is telling us today!
💡Here are some trade confluences📝
✅Daily order block
✅1H Order block
✅Intraday breaks of structure
✅4H Order block
🔑 Remember, to participate in trading comes always with a degree of risk, therefore as professional risk managers it remains vital that we stick to our risk management plan as well as our trading strategies.
📈The rest, we leave to the balance of probabilities.
💡Fail to plan. Plan to fail.
🏆It has always been that simple.
❤️Good luck with your trading journey, I shall see you at the very top.
🎯Trade consistent, FRGNT X

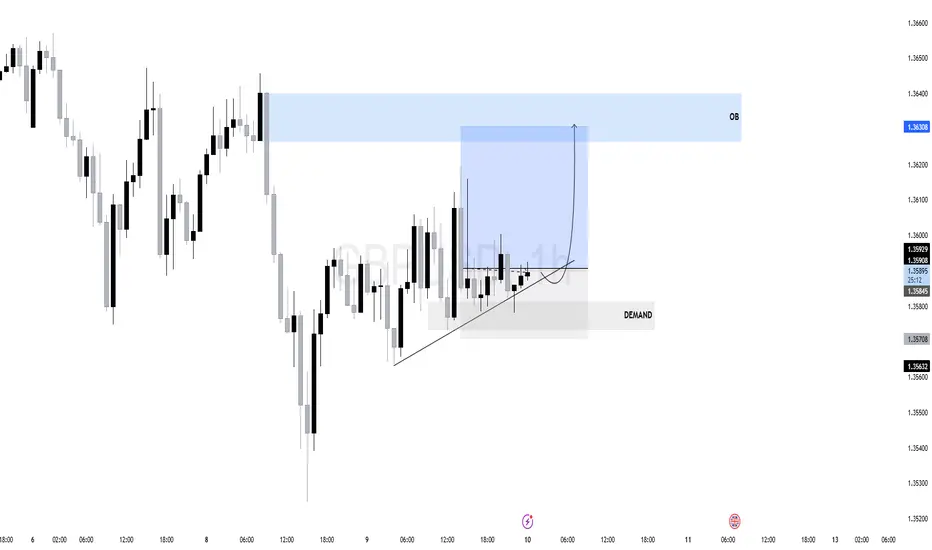
$GU (GBPUSD) 1HPrice has been consolidating after a previous sell-off and is now showing signs of accumulation above a defined demand zone (1.35600–1.35800).
The price has respected the ascending internal trendline, forming higher lows — an early sign of bullish intent.
Strong bullish rejection from this area confirms interest from smart money. Price tested it and immediately rebounded, signaling absorption of sell-side liquidity.
The internal ascending trendline continues to act as dynamic support. As long as price respects this trendline, bullish bias remains intact.
Multiple highs around 1.36300 remain untouched — a magnet for price.That area overlaps with an Order Block (OB), making it a high-probability target for institutional interest.
The tight consolidation before the expansion (highlighted in blue) suggests price is loading for a sharp move.
As long as price remains above the demand zone and trendline A bullish expansion toward the OB zone (1.36300–1.36400) Or A potential liquidity sweep above the highs, aligning with external liquidity targets.
GBPUSD LONG FORECAST Q3 D8 W28 Y25GBPUSD LONG FORECAST Q3 D8 W28 Y25
Professional Risk Managers👋
Welcome back to another FRGNT chart update📈
Diving into some Forex setups using predominantly higher time frame order blocks alongside confirmation breaks of structure.
Let’s see what price action is telling us today!
💡Here are some trade confluences📝
✅Daily order block
✅1H Order block
✅Intraday breaks of structure
✅4H Order block
🔑 Remember, to participate in trading comes always with a degree of risk, therefore as professional risk managers it remains vital that we stick to our risk management plan as well as our trading strategies.
📈The rest, we leave to the balance of probabilities.
💡Fail to plan. Plan to fail.
🏆It has always been that simple.
❤️Good luck with your trading journey, I shall see you at the very top.
🎯Trade consistent, FRGNT X

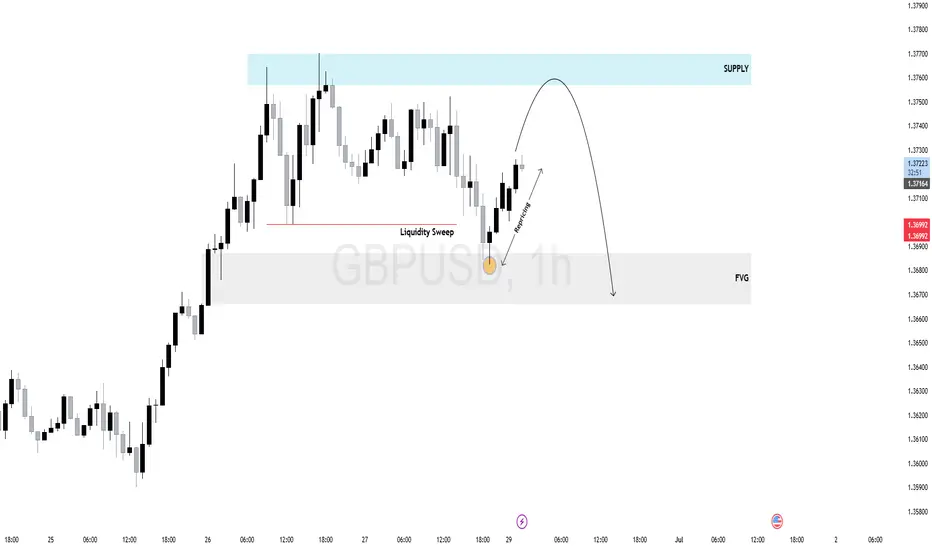
$GU (GBPUSD) 1H AnalysisPrice swept internal liquidity before dropping into a clear 1H Fair Value Gap (FVG), which acted as a draw on liquidity. Following the mitigation, GBPUSD is now retracing toward a high-probability supply zone.
Expect potential rejection as price rebalances inefficiency and seeks sell-side liquidity.
Watch for bearish confirmation inside the supply zone — ideal for intraday shorts if the structure shifts.
Pullbacks = short opportunities.
GBPUSD SHORT FORECAST Q2 W25 D17 Y25GBPUSD SHORT FORECAST Q2 W25 D17 Y25
Professional Risk Managers👋
Welcome back to another FRGNT chart update📈
Diving into some Forex setups using predominantly higher time frame order blocks alongside confirmation breaks of structure.
Let’s see what price action is telling us today!
💡Here are some trade confluences📝
✅Weekly order block
✅15' order block
✅Intraday 15' break of structure
✅Tokyo ranges to be filled
🔑 Remember, to participate in trading comes always with a degree of risk, therefore as professional risk managers it remains vital that we stick to our risk management plan as well as our trading strategies.
📈The rest, we leave to the balance of probabilities.
💡Fail to plan. Plan to fail.
🏆It has always been that simple.
❤️Good luck with your trading journey, I shall see you at the very top.
🎯Trade consistent, FRGNT X

GBPUSD SHORT FORECAST Q2 W25 D16 Y25GBPUSD SHORT FORECAST Q2 W25 D16 Y25
Professional Risk Managers👋
Welcome back to another FRGNT chart update📈
Diving into some Forex setups using predominantly higher time frame order blocks alongside confirmation breaks of structure.
Let’s see what price action is telling us today!
💡Here are some trade confluences📝
✅Weekly order block
✅15' order block
✅Intraday 15' break of structure
✅Tokyo ranges to be filled
🔑 Remember, to participate in trading comes always with a degree of risk, therefore as professional risk managers it remains vital that we stick to our risk management plan as well as our trading strategies.
📈The rest, we leave to the balance of probabilities.
💡Fail to plan. Plan to fail.
🏆It has always been that simple.
❤️Good luck with your trading journey, I shall see you at the very top.
🎯Trade consistent, FRGNT X
