#ZECUSDT Privacy Narrative 2025-2026!ZEC is a privacy coin, and before we jump into numbers, you should ask yourself:
Why are privacy coins leading this cycle?
If you haven’t asked this yet, then it’s time to dive deeper —
because the narrative itself is part of the pump.
🔥 Main Question
Will ZEC hold momentum and continue bullish,
Or will $800 be the end of this wave?
Short Answer:
I see ZEC reaching $1,500 before or by Feb 2025.
We already caught it in the $4XX range days ago after making this TA:
🧭 Technical Foundation
This ZEC read is based on:
Elliott Wave (EW)
Gann Timing
Fibonacci Map
Harmonic structure confirmations
ZEC is currently at a crossroads, and the next monthly close will decide its fate.
🔑 What ZEC Needs for $1,500
1. Weekly Hold for now to keep things up:
$480 must hold weekly
No monthly close below this range
2. Bullish Monthly Close:
$560–$630 monthly close → excellent strength
Confirms buyers defending the trend
3. Breakout Key:
$800 → breakout
Opens runway to $1,200 → $1,500
New ATH window
Monthly close = the key factor for ZEC’s entire roadmap.
💼 Trade Plan (My Setup)
My Buy Levels:
$359.25
$419.13
$479.00 → now in profit
Stop-Loss:
$250
A monthly close below $ 230 invalidates the structure.
Risk Allocation:
3–5% max investment
Even with a 2× target, the risk remains controlled
→ You risk $1 to aim for $2+
Duration:
180+ days
Confidence Level: Medium
📌 Quick Recap
Key support: $480 weekly
Monthly range to watch: $560–$630
Breakout: $800 → $1,200 → $1,500
❌ Invalidation: Monthly below $260
🧩 Risk: 3–5%
⏱ Duration: 6 months+
⚓ Renzo Tip
“Privacy coins rise when the crowd starts whispering, smart captains listen before the storm arrives.”
Do your own research, as always.
Prayer
May Allah protect our trades from hidden risks, guide us toward clarity,
and give us wisdom to manage both fear and greed in every cycle.
Hamadamark

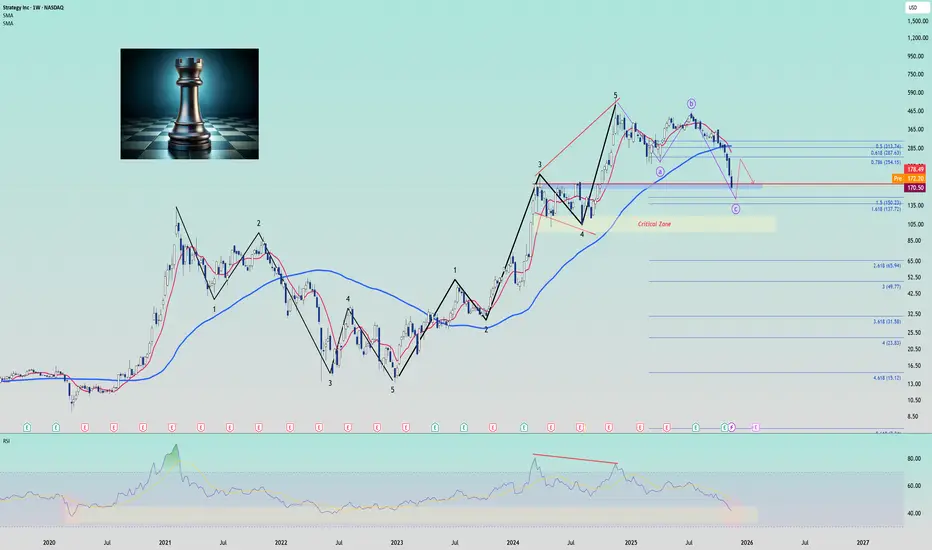
MSTR Chess Game: When Smart Money Plays Against Saylor!
Did you play chess before?
For me, i started playing it in the past 3 days, and even though i reached a nice speed rank, the performance and game review still show the blind movement! And this is EXACTLY what Saylor is doing! Let me show you the data:
He bought $1.5B at $52K (March), then added $3B at $60K+ (November) - always buying the momentum, not the value! Now MSTR down -50% from $360 while BTC only -10%... You see the pattern?!
Weeks ago (Oct 1, around $360) i told my friend, "If I play with 1-2, I will say this guy is ass*** and i will try to cost him a loss, and i will play the game to make him buy my sells then rekt him and buy his loss."
Just a few weeks and here we are! MSTR losing -50% and BTC run to his buy AVG $74K, yes, he is still in a safe zone, but the real game starts now!
The Technical Setup (this is where it gets interesting!):
So i use multiple methods - GANN 50% retracement hitting at $145, Fibonacci Golden Pocket at $152-163, and Volume Profile showing the highest trades at $147. Even RSI at 28 is showing divergence while price is making new lows!
Here's my trade plan:
Entry Zone: $145-155 (I'm scaling in here!)
Target 1: $183 (taking 25% off)
Target 2: $190 (another 50% off)
Stop Loss: $139 (below monthly support)
Risk/Reward: 1:2.8 (this is a beautiful setup!)
But wait, there's more data!
The correlation is crazy:
MSTR/BTC: 0.84 correlation
BTC/NDQ: 0.72 (and rising!)
If MSTR breaks $140, we could see BTC at $83-79K and NDQ dropping 5-8%!
Will Saylor survive? Here's the math:
BTC needs to hit $29K for margin calls - that's NOT happening!
He has $3.2B in unencumbered BTC
Bonds not due until 2027-2029
His software business still makes $50M quarterly.
So he plays it nicely, and the team behind still has more to do! Strategic Bitcoin Reserve talks, Gensler leaving, Q1 2025 crypto regulations - they're doing their best to make everything hold!
The sentiment data (this is golden!):
Fear & Greed: 25 (Extreme Fear)
Put/Call ratio: 2.3 (highest since 2022!)
Social volume: -78% last 7 days
You know what this means?! Smart money accumulating while retail panicking!
My analysis using:
GANN boxes on log scale (this is KEY!)
Custom MA ribbons with volume weighting
Multi-timeframe RSI divergence
Fibonacci zones from multiple swings
So what's the play?!
If you're conservative:
Wait for the weekly close above $180
Scale by 25% at a time
Use BTC/GOLD as a hedge
If you're aggressive like me:
Accumulate $145-155 NOW +2% invest
Sell $190+225 calls for income
Consider the BTC/MSTR pair trade
Next 30 days watch:
Monthly close Dec 31 (CRITICAL!)
Q4 BTC purchases announcement
Fed meeting Jan 29
MSTR earnings Feb 3
Anyway!
Would MSTR be saved now and rebound?! YES!
Professional accumulation is happening at these levels - the risk/reward is too good!
they do their best to make everything hold, the system is upgraded, the thinking scale has become faster than your mind now!
So, we're all here to make profits, and i wish i could short MSTR at $360, but now I'm buying!
if you like what you read and what you see, please press the like button, and your comments are welcome
Thanks, tradingview, for giving me a space here!
we ask Allah to reconcile and repay
#MSTR #Bitcoin #CryptoTrading #Saylor
#AVNT Update — RWA Sector Watch Chart shows
Nice falling wedge forming here.
AVNT is sitting between two options:
hold the current range and attempt a breakout following Aster’s movement,
or make a short-term breakdown with a wick toward 0.32 – 0.27.
Both zones are solid buy regions in my view.
🔑 Key Levels
Support zone: 0.32 – 0.27
Recovery line: 0.90 – 1.20
Breakout path: 2.20 – 3.50 (ATH recovery range)
Max investment on AVNT → 3 % of portfolio.
Trade it as a rotation play with clear stops and staged exits.
🧾 About Avantis
Avantis is the largest RWA perpetuals DEX in DeFi, built and backed on Base.
It allows trading of crypto and real-world assets (FX, commodities, indices, equities).
Supported by Pantera and Coinbase, it’s currently the top DEX on Base by volume,
offering institutional-grade products and up to 500× leverage in a transparent, permissionless way.
Avantis introduced Zero-Fee Perpetuals (ZFP) — traders pay fees only when they profit.
It also brought leveraged RWAs on-chain, driving rapid growth:
over 20 billion USD in cumulative volume and 15 million run-rate revenues since February 2024.
(See CMC for more background.)
✅ Quick Recap
Pattern: Falling wedge
Buy zones: 0.32 – 0.27
Recovery line: 0.90 – 1.20
Breakout targets: 2.20 – 3.50
Allocation: 3 % max
Trend bias: Bullish recovery if wedge holds
⚓ Renzo Tip
“When a wedge tightens, patience becomes your best entry signal; force it, and you miss the release.”
🤲 Prayer
May Allah bless us with calm decisions, protect our trades from haste,
and grant us the clarity to wait for confirmation before every move.
I’ve traded this coin from the early base around 0.30 → 1.80,
so returning to these levels offers a strong risk-to-reward window.
📈

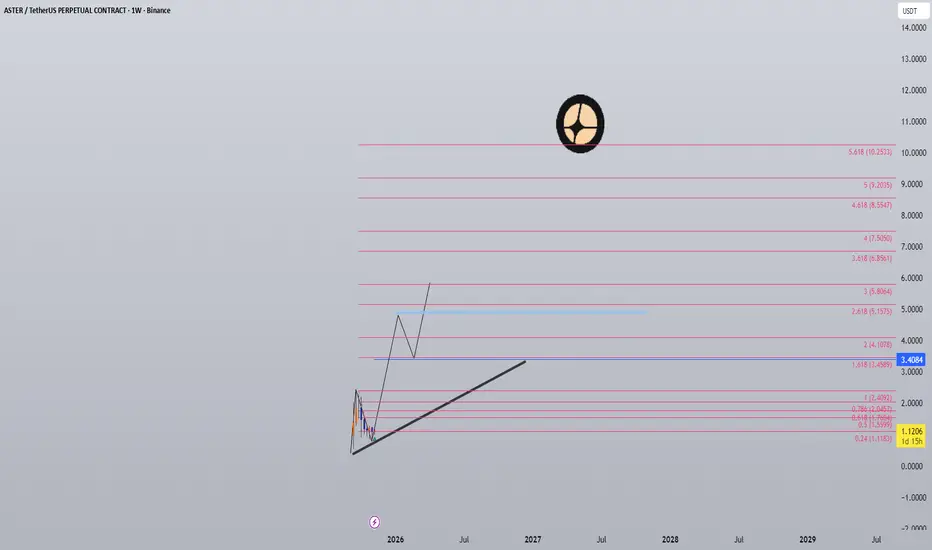
#ASTER 2025-2026! Trading PlanAster is one of the most significant investments I’ve made this year.
I entered from multiple DCA levels, bringing my average price to around $1 after entries between $1.5 and $ 0.95-0.85.
🎯 Trade Plan
Target Zones:
1️⃣ $6
2️⃣ $13
3️⃣ $21
4️⃣ $36
⏳ Timeframe: 90-180 Days
💰 Allocation: 15–20% of total available capital i have!
📏 Reminder: Even the perfect setup can fail; that is why risk control matters more than excitement.
💬 Personal Note
Thank you for every kind comment or feedback on this idea or others.
These interactions remind me why I started sharing analysis publicly again after focusing mainly on Telegram.
It’s also heartwarming to see familiar names from 2017 still here.
Some of you have been in touch with me personally for years,
And seeing you around again means a lot.
A big hug to all of you 💪
⚓ Renzo Tip
“The best trade isn’t just about price, it’s about patience, purpose, and the people who stayed through every wave.”
🤲 Prayer
May Allah bless our patience, protect our capital from greed,
and keep us surrounded by people who trade with integrity and gratitude.
yesterday
Trade active
Trade Active!
I entered from multiple DCA levels, bringing my average price to around $1 after entries between $1.5 and $ 0.95-0.85.
🎯 Trade Plan
Target Zones:
1️⃣ $6
2️⃣ $13
3️⃣ $21
4️⃣ $36
⏳ Timeframe: 90-180 Days
💰 Allocation: 15–20% of total available capital i have!
📏 Reminder: Even the perfect setup can fail; that is why risk control matters more than excitement.
🤲 Prayer
May Allah bless our patience, protect our capital from greed,
and keep us surrounded by people who trade with integrity and gratitude.
#ETHUSDT 2025–2028 OutlookFIB/GANN/classic Method Analysis
🔹 Gann Key Timing
According to Gann cycles,
25 November marks the start point of a new bullish attempt for ETH.
The $2,500 level is the critical line
if ETH closes a monthly candle below $2,500, it signals a significant change in the long-term roadmap.
Trend Setup
As long as ETH holds $2,500 and stays above the Blue Trend Line (A),
The bullish roadmap remains valid.
🎯 Roadmap Targets
Breakout Key:
$5,100 → Main breakout confirmation
Target 1:
$5,900 – $6,700 → First bullish leg (until Feb 2026)
Target 2:
$8,200 – $8,900 → Full bullish year if 2026 confirms
Target 3:
$10,150 → Extended top projection (2027–2028)
📌 All levels remain valid as long as ETH holds $2,500 on the monthly close.
💰 Trade Plan
We have active entries: from $3, XXX, with remaining buy levels between $1,500–$1,850–$2,150.
Set up invalidation: Monthly close below $2,500.
Max investment: 15 % of wallet.
Risk-Reward (R: R): ≈ 1: 2 or higher.
Example: If you hold 10 ETH, you risk about $10K vs. the potential upside of $35–70K.
⚖️ Summary
Support to hold: $2,500
Breakout confirmation: $5,100
Main targets: $5,900 → $6,700 → $8,900 → $10,150
Cycle: 2025 → 2028
Exposure: 15 % max
Always trade with a clear plan and controlled risk.
⚓ Renzo Tip
“The chart tells its truth to the patient — not the loudest trader, but the calm observer of time.”
🤲 Prayer
May Allah guide us to trade with clarity, protect our effort from greed and confusion,
and reward our discipline with lasting growth and wisdom.

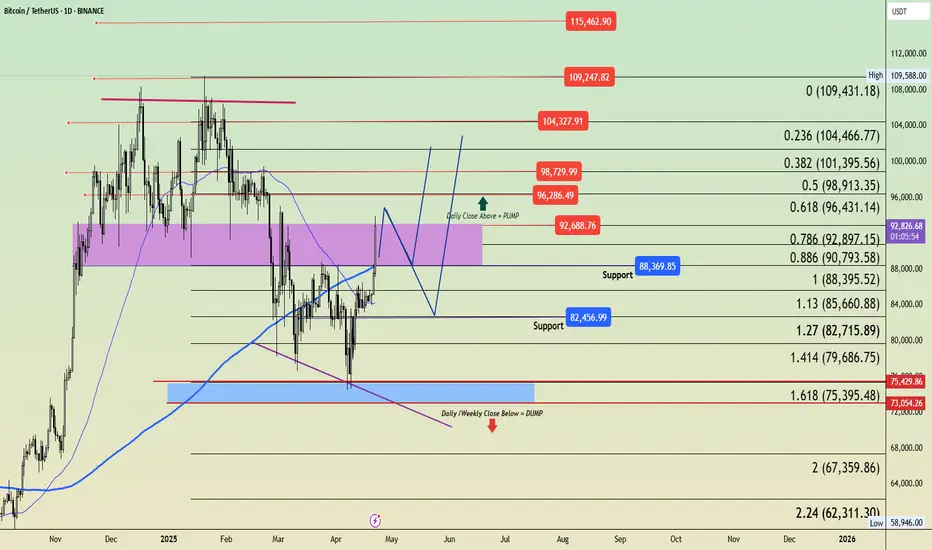
#BTCUSDT – Momentum Builds, $93K in Sight… What’s Next?#BTCUSDT Update! 🚀
Bulls have delivered strong momentum, breaking above the FWB:88K zone and pushing up to $93K — a move we haven’t seen since early 2025. That’s a massive +10% daily candle on BTC, a clear sign of market strength.
Meanwhile, gold faced a sharp rejection from its ATH, dropping nearly $200 from $3500 to $3325 on the daily chart. This highlights a shift in liquidity and profit-taking—BTC is clearly the beneficiary. BITCOIN🔥
🔍 BTC Technical Breakdown:
BTC has now broken out above the daily resistance zone, including the 200-day MA, and is hovering just below the mid-term key area of GETTEX:92K –$93K.
This range previously served as solid support for nearly 90 days, from Nov 25, 2024, to Feb 25, 2025.
➡️ The Real Test Now:
Can the bulls flip this zone into support and drive us toward new ATHs?
The next few days will tell.
📌 My Personal Bias:
If momentum continues, I expect BTC to stall between $93K–$97K.
A pullback to FWB:88K would be a healthy retest of broken resistance.
If bulls hold that level, we could see a clean breakout continuation.
If not, BTC may revisit the $84K–$81K range before mounting another attempt upward.
This movement aligns with the Plan A I’ve followed since February and confirms our broader strategy:
Chart PLAN A&B Below!
💬 If you’re wondering what I’m doing right now…
You might ask:
✅ Should I keep my investment?
✅ Should I book some profits?
✅ Should I open a new position?
Here’s what I did:
My team and I secured half of our profits around GETTEX:87K – FWB:88K , and some between $91K–$93K.
We’re holding the rest and ready to buy again on any retrace—if price plays out as expected.
It’s part of our proven strategy: Secure profits, stay exposed, and prepare for the next wave.
📢 Public Trades Update:
🔹 Entry Avg: $79K - $78K
✅ Sold 25% at $85K
✅ Sold another 25% at $92,7XX
🟢 Still holding 50%
🔹 Entry Avg: $79,900 - $77,500
✅ Sold 35% at $81K
✅ Sold another 35% at $92,7XX
🟢 Holding the rest
📌 Short-term traders: Use tight SLs and focus on solid levels.
📌 Long-term investors: (This part is done).
💡 If you ignored our updates from $103K - GETTEX:98K and got stuck at the top, it's only a matter of time before the market pumps again—just ensure you can benefit from movements & dips
⚠️ Risk Management & Altcoins
🔸 Altcoins are still highly reactive to BTC’s retracements.
🔸 Stick to the plan, don’t trade emotionally, and keep FIAT ready.
📌 Final Thoughts – Stay Disciplined!
✅ Don’t FOMO if you missed our buy levels—we shared them early.
✅ Don’t chase resistance—wait for clear confirmation.
🔹 Execute smart, protect your capital, and stay patient.
Please keep in mind that this is not financial advice and the purpose of these charts is to provide an idea of coin movement, not buy or sell signals. The cryptocurrency market is highly volatile and not suitable for everyone, so be aware of the potential risks before making any investment decisions. The information presented here is a personal effort and is subject to success or failure, and we welcome constructive criticism.
Good luck to all.
🙏we ask Allah reconcile and repay🙏
BITCOIN AT $7400 soonposible ascending triangle that will contain the price for a few months this year. $11.600 top $7400 bottom that will be rising every week.
