Key Levels – Where Gold Reacts, Not Indicators?Many traders start trading gold using indicators, and that’s something almost everyone goes through. However, the longer you stay in the market, the more clearly you realize one important truth: gold does not react to indicators; it reacts at key levels . Indicators only describe what price has already done, while key levels are where real money actually makes decisions.
Price does not move randomly. It reacts at important price zones.
Key levels are areas where the market has shown clear reactions in the past — strong reversals, repeated rejections, or consolidation before a breakout. In gold trading, these zones often align with major highs and lows, round numbers, or areas of concentrated liquidity.
This is where both retail traders and large capital are paying attention.
One major reason many traders consistently enter too late is over-reliance on indicators. Indicators are always based on past price data, so when a signal appears, the key reaction has often already happened. At that point, entries are less attractive, risk-to-reward deteriorates, and the probability of false breaks or stop hunts increases.
Indicators are not wrong, but they always lag behind price.
Professional traders don’t try to predict whether price will go up or down. They wait for price to reach a key level and then observe how the market reacts. Is price strongly rejected, or does it break through easily? Is real buying or selling pressure actually showing up?
Key levels are not places to predict — they are places to observe and react.
This doesn’t mean indicators are useless. Indicators still have value for momentum confirmation or for understanding market context. But they should not be the primary factor for making entry decisions.
Key levels tell you where to trade.
Indicators only help you understand how price is behaving.
Conclusion
If you are trading gold and still searching for the “best indicator for XAUUSD,” you may be asking the wrong question.
The better question is:
Which key level is the market respecting right now?
Because in the end, price reacts at levels — not at indicators.
Harmonic Patterns
BTCUSDTHello Traders! 👋
What are your thoughts on Bitcoin?
Bitcoin has entered a corrective phase after a strong bearish move and is currently ranging between a clearly defined support and resistance zone. As long as price remains inside this range, no major directional move is expected.
At the moment, price is expected to move toward the upper boundary of the range. Once this area is reached, price behavior should be closely monitored for confirmation.
Bullish case:
If price breaks and holds above the range high, the next upside targets marked on the chart will come into play.
Bearish case:
If price gets rejected from the range high and the lower boundary of the range is broken, bearish continuation is likely, with the next downside target around 73,000.
⚠️ Until a clear breakout occurs, the market remains in a consolidation phase
Please Don’t forget to like and share your thoughts in the comments! ❤️

XAUUSDHello Traders! 👋
What are your thoughts on GOLD?
Gold is currently trading near its all-time high (ATH) and the upper boundary of a short-term ascending channel.
This zone has acted as a strong resistance area, where price has been rejected multiple times in the past.
As long as price remains below this resistance, a bearish reaction is expected.
The base case is a pullback toward the lower boundary of the ascending channel, which serves as the minimum downside target.
If price breaks above the channel top, prints a new high, and a strong candle closes above the resistance zone, the bearish scenario targeting the channel low will be invalidated.
With the year-end approaching, low liquidity conditions increase the probability of fake breakouts and false moves.
Extra caution and confirmation are required before taking any breakout trades.
Please Don’t forget to like and share your thoughts in the comments! ❤️

Elise | XAUUSD – 30M -Liquidity Sweep → Trend Continuation SetupOANDA:XAUUSD
The sharp downside spike into 4308 was a liquidity grab, not a breakdown. Buyers stepped in aggressively, flipping momentum and pushing price back into a controlled bullish leg. Current pullback is corrective, not impulsive — suggesting continuation toward higher resistance if structure holds.
Key Scenarios
✅ Bullish Case 🚀
As long as price holds above 4332–4335, upside remains active toward:
🎯 4350
🎯 4365
🎯 4375 (Major Resistance Zone)
❌ Bearish Case 📉 (Invalidation)
A clean break and close below 4325 opens downside toward:
🎯 4312
🎯 4308 (Liquidity Base)
Current Levels to Watch
Resistance 🔴: 4350 → 4365 → 4375
Support 🟢: 4335 → 4325 → 4308
⚠️ Disclaimer: This analysis is for educational purposes only. Not financial advice.

Bitcoin CyclesHello Traders,
I have identified a bitcoin cycle and have market everything clearly. I expect we are following closely to the 2022 bear market which means we get a relief rally to 108K before bear market continues. Lets see how this works out.

XAU Near All-Time Highs Bullish Continuation or Fake Breakout?Hello and respect to all TradingView followers 🙌
Hope you’re having profitable trades and disciplined risk management 📊💚
🟡 Gold Market Overview (XAUUSD)
Gold has always been considered a safe-haven asset, especially during periods of economic uncertainty, inflationary pressure, and geopolitical tensions.
Recently, gold has maintained a strong bullish structure across all timeframes, attracting both long-term investors and short-term traders 📈
At the moment, price is very close to its All-Time High (ATH). However, a new historical high has not been confirmed yet, making this zone extremely critical and decision-making for the market ⚠️
📊 Technical Analysis
🔼 Bullish Scenario
Overall market structure remains bullish on all timeframes
Price is holding above dynamic support (ascending trendline)
If price breaks and firmly closes above the ATH resistance, we can expect:
Continuation of the bullish trend
Formation of new All-Time Highs
Entry into price discovery mode 🚀
📌 Key confirmation: strong candle close above resistance + sustained momentum
🔽 Bearish (Corrective) Scenario
Despite the bullish trend, momentum weakness is visible near the ATH zone
If price fails to break the resistance and we see:
Rejection from resistance
Or a fake breakout
then a healthy correction becomes likely
Potential downside targets:
Nearest static support zones
And in a deeper pullback, the dynamic support (ascending trendline)
🔹 Such a move would be considered a normal correction within a larger bullish trend, not a trend reversal 🔄
🧠 Summary
Overall trend: Bullish
Current price location: Near All-Time High
Market condition: Sensitive zone + momentum weakness
Trading approach: Wait for confirmation — breakout or rejection
⚠️ Disclaimer
This analysis is for educational purposes only and not financial advice.
Always manage your risk properly and follow your own trading plan 💼📉
📣 Poll Question
❓ Do you think gold will successfully print new All-Time Highs?
🔘 Yes, after a confirmed breakout
🔘 No, a deeper correction comes first
Share your thoughts in the comments 👇👇
🏷️ Tags
#Gold #XAUUSD #TechnicalAnalysis #PriceAction
#SupportResistance #ATH #TradingView
#Forex #Commodities #SmartMoney
#BullishTrend #MarketStructure #TradingPsychology 💹
XAUUSD Near All-Time Highs Bullish Continuation or Fake Breakout?

ETH-The final drop before the cows come home (SHORT TERM SHORT)hello all 👋🙋♂️🙋♀️ Thank you so much for coming today
Let's get right to it💡. Today we are looking at a 4 hour view of ETHEREUM. I have noticed several things about ETH price action and what it could indicate.
⬆️ above on chart 📈📉 you can see I have labeled
major trend line (support line)
We have made contact with this long standing trend line and have seen some bullish pressure after doing so.
🤸🤸♂️
HOWEVER
There has been a Head and shoulders bearish pattern formed on the 4 hour view in which we did go down from but bounced back up to make a bearish flag 🐻🧸
🌊🏄♂️🏄♀️
MORE RECENTLY
We have formed a bearish harmonic pattern, which leads me to believe we will try to continue our head and shoulders pattern (with a drop in price) ⏬🔻But will catch support at our major trend line ~(3800)
🐼This is a Short term short Idea. The cryptocurrency market is extremely volatile.💣
This is not financial advice
🐶
Always have a stop loss ✋🛑💲 set🆗
Any thoughts 💭💡, questions 🙋♀️🙋♂️❓, good 👍, bad👎, happy 😄 or sad 😥, in the comments always welcome.😄
Jazerbay ☯️

Don’t Rush to Call the Top on EURUSDEURUSD in the late December 20–21 period is showing a clearly bullish picture , supported by both fundamental news and technical structure . This is not a euphoric phase , but rather a period where the market slows down to accumulate before making its next move.
From a fundamental perspective, the ECB has kept interest rates unchanged and delivered a relatively positive outlook, while the USD lacks fresh momentum as U.S. data has not been strong enough to push the Fed back into a hawkish stance. This backdrop allows the euro to maintain a short-term advantage.
On the chart, price remains firmly above the 1.1680 support zone , and the Higher Low structure is still intact. The Ichimoku setup shows sideways movement above a thin cloud , a condition that often appears before a trend continuation rather than a reversal.
As long as the current support holds , the preferred scenario remains EURUSD pushing higher toward 1.1750, with the potential to retest the upper resistance zone. When the trend has not broken , following the flow is far wiser than trying to predict a top.

SSVUSDT Forming Falling WedgeSSVUSDT is forming a clear falling wedge pattern, a classic bullish reversal signal that often indicates an upcoming breakout. The price has been consolidating within a narrowing range, suggesting that selling pressure is weakening while buyers are beginning to regain control. With consistent volume confirming accumulation at lower levels, the setup hints at a potential bullish breakout soon. The projected move could lead to an impressive gain of around 140% to 150% once the price breaks above the wedge resistance.
This falling wedge pattern is typically seen at the end of downtrends or corrective phases, and it represents a potential shift in market sentiment from bearish to bullish. Traders closely watching SSVUSDT are noting the strengthening momentum as it nears a breakout zone. The good trading volume adds confidence to this pattern, showing that market participants are positioning early in anticipation of a reversal.
Investors’ growing interest in SSVUSDT reflects rising confidence in the project’s long-term fundamentals and current technical strength. If the breakout confirms with sustained volume, this could mark the start of a fresh bullish leg. Traders might find this a valuable setup for medium-term gains, especially as the wedge pattern completes and buying momentum accelerates.
✅ Show your support by hitting the like button and
✅ Leaving a comment below! (What is your opinion about this Coin?)
Your feedback and engagement keep me inspired to share more insightful market analysis with you!

NZDJPY | Bullish Continuation LoadingHello and well done to all my TradingView followers 👋✨
I hope you’re having profitable and well-managed trades 📈
🔹 Symbol: NZDJPY (New Zealand Dollar / Japanese Yen)
This currency pair, combining a commodity-based currency (NZD) with a safe-haven currency (JPY), often delivers clean and reliable technical movements, especially on higher timeframes. Under current market conditions, NZDJPY has attracted the attention of many swing and mid-term traders.
📊 Technical Analysis (4H)
🔸 After a period of consolidation and base formation, price has successfully shifted into a bullish structure and is currently holding above key static and dynamic support levels.
🔸 The ascending trendline (Dynamic Support) has reacted well and remains valid.
🔸 The highlighted support zone can act as a healthy pullback area.
🔸 Above current price, we have a major resistance level. A clean breakout and stabilization above this zone could open the door for a strong bullish continuation 🚀
📌 Possible Scenarios:
1️⃣ Scenario One (More Likely):
Price may enter a mid-term ranging phase between support and resistance, build momentum, and then continue its upward move after a confirmed breakout.
2️⃣ Scenario Two:
If the current support holds and bullish momentum strengthens, a direct continuation to the upside from this area is also possible.
🔼 Overall, the bullish bias remains dominant as long as key support levels are respected.
⚠️ Disclaimer:
This analysis reflects a personal and educational viewpoint only and does not constitute financial or investment advice. Risk management and capital protection are the sole responsibility of each trader.
📊 What’s your view? (Poll)
❓ How do you see NZDJPY moving next?
🔘 Range first, then bullish breakout
🔘 Immediate bullish continuation from current levels
🔘 Bearish scenario seems more likely
👇 Share your thoughts in the comments.
Wishing you successful and profitable trades 🌱💚
🏷️ Tags (TradingView):
#NZDJPY #Forex #PriceAction #TechnicalAnalysis
#SupportResistance #TrendLine #SwingTrading
#MidTerm #Bullish #TradingView

Gold is about to undergo a reversal!!On the H4 timeframe, XAUUSD is trading inside a corrective range following a strong bullish expansion, showing signs of distribution at the highs while seeking demand at lower discount levels.
Price action is driven by multi-layer liquidity sweeps and unmitigated Fair Value Gaps (FVGs).
➡ Weekly Bias:
SELL at premium zones with Buy-Side Liquidity
BUY via reactions at discount zones and primary BUY at deep discount
➡ Primary Scenario: Liquidity sweep → H1/M15 CHoCH → displacement toward the trade direction
📉 MARKET STRUCTURE & LIQUIDITY (H4)
H4 structure: distribution at highs → controlled corrective pullback
No confirmed HTF bullish continuation yet → zone-based trading is preferred
Liquidity Map
Buy-Side Liquidity (BSL):
Above 4377–4380
Sell-Side Liquidity (SSL):
Below 4283
Below 4232
Below 4177
➡ All entries are positioned directly around major liquidity pools, respecting H4 Smart Money logic.
🔑 KEY ZONES (DIRECTLY LINKED TO ENTRIES)
🔴 4380–4377 | SELL GOLD – H4 Premium Distribution
Why this is a high-probability SELL zone:
Clear premium relative to H4 structure
Located just below/around major BSL, ideal for buy-stop sweeps
Confluence of premium FVG and HTF distribution
➡ Ideal area to form a H4 Lower High and initiate a corrective move lower.
💚 4286–4283 | BUY SCALP – Upper Discount Reaction
Why this zone works for BUY scalps:
First discount area within the H4 range
Confluence of intraday demand and pullback FVG
Positioned just above weak SSL, often swept before bouncing
➡ Suitable for reaction BUYs, not for long holding.
💚 4241–4238 | BUY SCALP – Mid-Discount Liquidity Grab
Why this zone is attractive:
Deeper sell-side liquidity sweep level
Confluence of H4 FVG and mid-term demand
Frequently produces a clear H1/M15 CHoCH
➡ BUY after downside liquidity is taken and structure is reclaimed.
💎 4180–4177 | BUY GOLD – H4 Deep Discount
This is the strongest BUY zone of the week.
Key reasons:
Deep discount within the H4 structure
Positioned just above major SSL of the entire bullish leg
Strong confluence of HTF Demand Block and H4 FVG
➡ Ideal for primary BUY positions with high R:R and strong reversal potential.
⚙️ TRADE SETUPS (CLEAR & EXECUTABLE)
✔ SELL GOLD – MAIN SELL
Entry: 4380–4377
Stop Loss: 4386
Take Profit: 4325 → 4285
Logic: BSL sweep → H4 distribution → bearish displacement
✔ BUY SCALP 1
Entry: 4286–4283
Stop Loss: 4377
Take Profit: 4320 → 4345
Logic: Minor SSL sweep → demand reaction → technical bounce
✔ BUY SCALP 2
Entry: 4241–4238
Stop Loss: 4232
Take Profit: 4280 → 4320
Logic: SSL sweep → H1/M15 CHoCH → mid-term bullish displacement
✔ BUY GOLD – MAIN BUY
Entry: 4180–4177
Stop Loss: 4172
Take Profit: 4235 → 4300 → 4370
Logic: Major SSL sweep → HTF demand activation → strong bullish displacement
🧠 WEEKLY NOTES
❌ Avoid mid-range trading without a liquidity sweep
✅ Prioritize H1 or M15 CHoCH confirmation
London and New York sessions may create multi-layer false breaks before the real move
If 4172 breaks decisively, invalidate BUY bias and wait for a new H4 structure
🏁 SUMMARY
4380–4377: SELL GOLD (H4 premium)
4286–4283: BUY SCALP (upper discount reaction)
4241–4238: BUY SCALP (deeper liquidity grab)
4180–4177: BUY GOLD (strongest setup of the week)
➡ Wait for liquidity to be taken — enter with confirmation — maximize R:R.

BTCUSDT – A Bullish Scenario Is Gradually Taking ShapeAfter a phase of correction and consolidation , Bitcoin is beginning to show signs of renewed stability to the upside , especially when viewed within the context of current macro news and technical structure.
On the fundamental side, expectations that the Fed will maintain a more dovish stance , along with declining yields, are creating a favorable environment for risk assets. Capital flows are returning to crypto cautiously but selectively, allowing BTC to hold a solid price base after the recent pullback.
From a technical perspective, BTCUSDT is currently:
Holding firmly above the key support at 87,400, aligning with a demand zone and the base of the latest rebound
Gradually breaking free from the descending trendline pressure, signaling that selling pressure is clearly weakening
Ichimoku indicators show price returning to equilibrium, setting the stage for a controlled recovery move
The current structure supports a higher-low formation, which is the foundation for a continuation of the uptrend
Preferred scenario:
As long as BTC holds above 87,400, there is a high probability of a recovery toward the 91,500 zone — an area of concentrated liquidity and near-term resistance. The current minor pullbacks should be viewed as buy-the-dip opportunities within the trend, rather than signals of a trend reversal.

What is Harmonic XABCD Pattern and How to Identify It Easily
In the today's article, we will discuss the absolute basics of harmonic trading: I will explain to you what is harmonic ABCD pattern and how to recognize it, using fibonacci ratios.
The foundation of harmonic trading is impulse leg.
Impulse leg is a strong, directional bullish or bearish movement.
Harmonic traders perceive a price chart like a combination of impulse legs.
Here are the impulse legs on AUDUSD on a daily time frame. All these impulses are significant bullish or bearish movements.
In harmonic pattern trading, the impulse leg will also be called the XA leg.
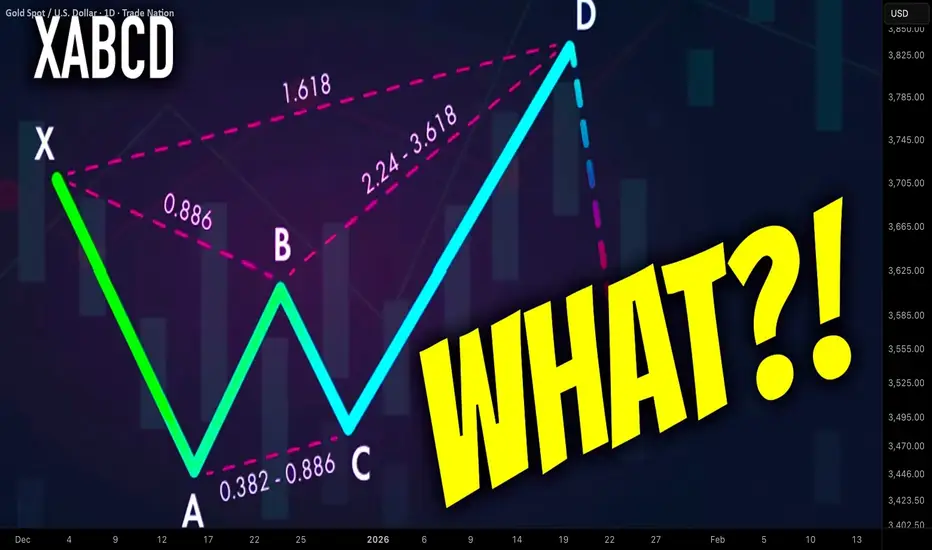
XABCD pattern is based on 4 consequent price movements.
XA leg will be a fundamental component of each harmonic XABCD pattern and the first price movement within the pattern.
The direction of the XA leg will determine the bias of the pattern:
Bullish XA will be a foundation of a bullish harmonic pattern,
while, a bearish XA leg will be a foundation for a bearish harmonic pattern.
Above, the examples of a bullish and bearish impulse legs.
After identification of XA leg, a harmonic trader should analyse a consequent price action.
AB leg will be the next movement after a completion of XA leg.
BC leg will be the movement after a completion of AB leg.
CD leg will be the movement after a completion of BC leg.
CD leg will be a completion point of a harmonic pattern.
In a bullish harmonic pattern, a bullish movement will be anticipated from D point.
Above is a structure of a bearish harmonic XABCD pattern.
There are a lot of different types of harmonic XABCD patterns: bullish/bearish Gartley, Bat, Cypher, etc...
The type of the pattern will depend on the fibonacci ratios of B, C, D points of the pattern.
B, C, D points should have very specific ratios to make a pattern harmonic.
First, a harmonic trader should measure the fibonacci retracement level of B point in XA leg.
In the example below, B point is lying between 618 and 786 retracements of XA leg.
Then, if a C point is lying beyond the range of the XA impulse, one should measure its fibonacci extension level.
If a C is lying within XA, its retracement level should be measured.
Below, we can see that C point of the pattern is lying between 618 and 786 retracements of AB.
Depending on the type of the pattern, a D point will either be based on a certain fibonacci retracement of XA leg or extension of AB leg.
In our example, the criteria for a bullish harmonic Gartley pattern are met.
The completion point of the pattern - D point will be based on 786 retracement of XA leg.
From that retracement level, a bullish movement will be anticipated.
Your task as a harmonic trader is to learn the specific rations of each harmonic pattern. With experience, you will learn to identify impulse legs and trade them profitable.
❤️Please, support my work with like, thank you!❤️
I am part of Trade Nation's Influencer program and receive a monthly fee for using their TradingView charts in my analysis.
TikTok Becomes a US Company, Stock Market Favors It!
The news of TikTok's US joint venture boosted the stock market. With over two billion users having already downloaded the once-unknown Chinese short-video sharing app, this impressive number may well save the app from a ban in the US. According to a CNBC report on Friday, TikTok is already banned in Canada and was temporarily banned in the US due to national security concerns. Now, it will continue its US operations through a joint venture with Oracle and other companies.
The app is practically a staple for Generation Z and has popularized viral social media trends such as dance challenges, lip-syncing, and role-playing skits. But its parent company, ByteDance, is a Chinese company and must comply with Beijing's infamous 2017 National Intelligence Law, which forces Chinese companies to assist the government in safeguarding national security. Article 7 of the law states, "All organizations and citizens shall, in accordance with the law, support, assist, and cooperate with national intelligence work, and shall keep confidential any secrets of national intelligence work that they become aware of." This 1984-esque language alarmed the US and Canada, both of which have banned ByteDance from operating in their countries. But Trump, a businessman, managed to delay the US ban and brokered an agreement that ultimately led to the formation of the US joint venture, which included Texas tech giant Oracle, California private equity firm Silver Lake, Abu Dhabi investment firm MGX, and several other investors.
The new investment partner will own 50% of what is now called TikTok USDS Joint Venture LLC. Oracle surged on the news, fueling Friday's stock market rally, with both its stock and Bitcoin rising. The stock's rise may have influenced the subsequent rise in BTC prices, although this connection may be purely coincidental.
FAQ ⚡ Why did TikTok's stock rise after the news?
TikTok's stock rose after the announcement of the US joint venture, easing regulatory concerns and boosting risk sentiment.
What changes have occurred to TikTok's status in the US?
TikTok will continue to operate in the US through the new joint venture, involving Oracle and other US investors.
Why is TikTok at risk of being banned?
US officials cited national security concerns related to China's intelligence law, which regulates ByteDance.
Did the TikTok deal directly drive the stock market rise?
It's not a direct impact, but the rise in stocks may have improved overall market sentiment and drawn into the Bitcoin market.

USDJPY Still Hot – 157.00 Is CallingHello traders,
USDJPY is currently showing a short-term bullish bias , as the narrative of a weak JPY despite the BOJ’s rate hike has not yet shifted overall market sentiment. Although the BOJ raised rates to 0.75%, the yen remains soft, indicating that much of the move was already priced in, and markets are still skeptical about the pace of further tightening.
At the same time, the USD continues to hold relative strength across the currency basket, providing a solid foundation for USDJPY to stay supported.
From a technical perspective, price action reflects a “slow but steady” uptrend : higher lows are being formed, and the 155.50 area is acting as a key support and pivot zone . The consolidation around 155.5–156.0 suggests accumulation, and as long as this base holds, the probability favors a move higher to retest the upper resistance.
The preferred scenario is to look for BUY opportunities on pullbacks : if price holds above 155.50 and shows a rebound, the near-term target is 157.00. Only a clear H4 close below 155.50 would weaken the short-term bullish outlook and warrant a reassessment.
Thank you for listening, and wishing you successful trading ahead.

BTCUSD – Downside Pressure Remains in ControlAfter a period of strong volatility, Bitcoin is entering a phase of “catching its breath” as market sentiment shifts toward a defensive stance . Short-term capital has become more cautious, while macro factors and interest-rate expectations remain unclear, failing to trigger a fresh risk-on wave. As a result, BTC is struggling to sustain meaningful rebounds.
From a technical perspective, the outlook is tilted toward a bearish trend . Price has been repeatedly rejected at the descending trendline and is currently trading below the Ichimoku cloud, confirming that sellers remain in control of the primary trend. The 88,300 zone is acting as near-term resistance, where rebounds are likely to face profit-taking and renewed selling pressure.
On the downside, 84,300 stands out as a key support level. Given the current structure, upward moves are more likely to be technical pullbacks rather than genuine reversals. If price fails to break and hold above 88,300, BTC is likely to remain under pressure and retest the 84,300 zone, or even move lower should selling momentum accelerate.
In summary, the short-term bias remains bearish. The more prudent approach is to patiently wait for pullbacks to align with the trend, rather than rushing to catch a falling knife. Bitcoin is at a critical juncture, and price reaction at key resistance levels will determine the market’s next move.

Bitcoin - The 30% correction is just starting!🥊Bitcoin ( CRYPTO:BTCUSD ) is just heading lower:
🔎Analysis summary:
Just a couple of weeks ago, Bitcoin perfectly retested the major all time high resistance. Since then, Bitcoin already created an expected correction of about -40%. But looking at the higher timeframe, Bitcoin can still drop another 30% from here until it retests support.
📝Levels to watch:
$60,000
SwingTraderPhil
SwingTrading.Simplified. | Investing.Simplified. | #LONGTERMVISION

LIGHT PERPETUAL TRADE BUY SETUP Long from $4.28LIGHT PERPETUAL TRADE
BUY SETUP
Long from $4.28
Currently $4.28
Targeting $4.56 or Above
(Trading plan IF LIGHT
go down to $4 will add more longs)
Follow the notes for updates
In the event of an early exit,
this analysis will be updated.
Its not a Financial advice

GBPJPY MONTHLY PERSPECTIVE.THE GBPJPY EXCHANGE RATE FOR THE CLOSE OF FRIDAY=210.985 yean for one British pounds.
the GBPJPY technical analysis and directional bias.
GB10Y= 4.535% FRIDAY CLOSE
BOE(BANK OF ENGLAND ) RATE=3.75% AND INFLATION AT 3.2% BOE TARGET IS 2% ,the next BOE rate meeting will be 5th February 2026.
HEAD OF BANK OF ENGLAND=Andrew Bailey is the Governor of the Bank of England and Chair of the Monetary Policy Committee, Financial Policy Committee and the Prudential Regulation Committee.
the current BOJ reflection on exchange rate across fx window.
the price action on monthly TF remains bearish. siting 1975 drop from 572 yean to one British pounds into 2011 117 yen to one British pounds sterling .
TECHNICAL AND FUNDAMENTAL DETAILS .
JP10Y= 2.018% up 2.91 on weekly close
BOJ RATE =Uncollateralized Overnight Call Rate(average) 0.477%
Interest Rate Applied to the Complementary Deposit Facility 0.75%
Basic Loan Rate 1.0%
Current Account Balances at the Bank of Japan 468,320billion yen
Overall Inflation (CPI): 2.9% (YoY)
Core Inflation (excl. fresh food): 3.0% (YoY)
Key Drivers & Context:
Food Prices: Slowed but still elevated, with rice prices easing, according to Trading Economics.
Utilities: Electricity costs accelerated, adding to price increases.
Policy: The BoJ is continuing its path of policy normalization (raising rates) to meet its 2% goal, a significant shift after years of ultra-loose policy.
Economic Growth: Weak GDP growth and a weak yen create a difficult environment for the BoJ.
HEAD OF BOJ( BANK OF JAPAN
The Head (Governor) of the Bank of Japan (BOJ) is Kazuo Ueda, who has served in this role since April 2023, leading the central bank's monetary policy, including recent moves to raise interest rates to combat inflation and normalize policy.
Took Office: April 9, 2023.
Background: An economist and professor emeritus at the University of Tokyo, he succeeded Haruhiko Kuroda.
Recent Actions: Under his leadership, the BOJ recently raised its benchmark interest rate to 0.75%, the highest in three decades, to tackle persistent inflation in Japan. .
THE COMBINATION OF INTEREST RATE AND BOND YIELD DIFFERENTIAL OF GBPJPY.
INTEREST RATE DIFFERENTIAL= 3%
BONDYIELD DIFFERENTIAL= 2.517%
CARRY TRADE ADVANTAGE= FAVOUR GPY LONG.
DIRECTIONAL BIAS= GO LONG WITH A PROBABILTY OF UN-INFORMED SELL POSITION DUE TO LONG TEREM MONTHLY PERSPECTIVE AND DIRECTIONAL BIAS.
TECHNICAL POSITION FOR SELL BASED ON MARKET STRUCTURE=
SUPPLY ROOF ON MONTHLY -215-213.964
SUPPLY ROOF =227.8-228.1
SUPPLY ROOF 259.825-257.1
DEMAND FLOOR =196.5.
GOODLUCK

USDJPY Breakeven Trade Recap 20.12.25In this recap I break down my USDJPY long position I took last week as a flip and failure of structure, initially looking for the short than then presented a great long opportunity when that structure failed.
Full explanation as to why I executed on this position and also why I managed aggressively once price moved back into profit.
Any questions you have just drop them below 👇

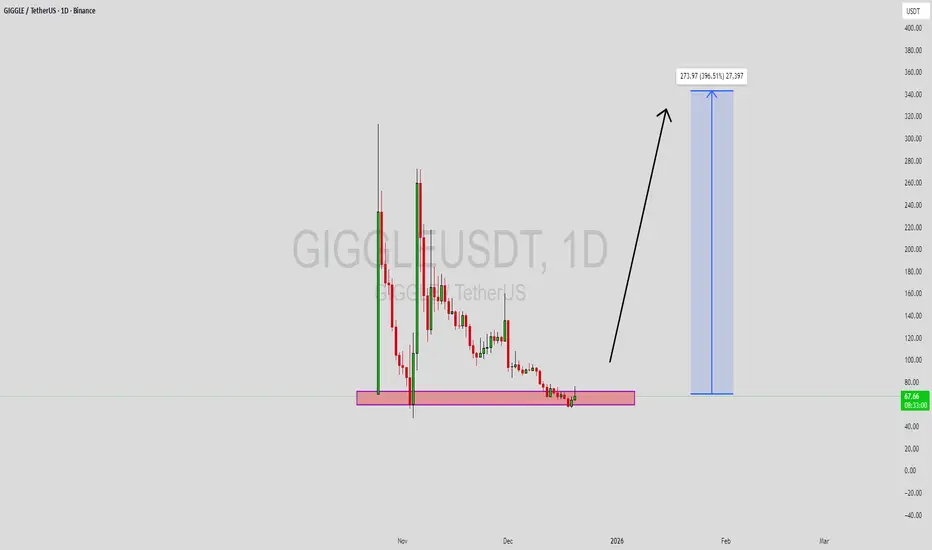
GIGGLEUSDT Forming Bullish MomentumGIGGLEUSDT is forming a clear bullish momentum pattern, a classic bullish reversal signal that often indicates an upcoming breakout. The price has been consolidating within a narrowing range, suggesting that selling pressure is weakening while buyers are beginning to regain control. With consistent volume confirming accumulation at lower levels, the setup hints at a potential bullish breakout soon. The projected move could lead to an impressive gain of around 290% to 300% once the price breaks above the wedge resistance.
This falling wedge pattern is typically seen at the end of downtrends or corrective phases, and it represents a potential shift in market sentiment from bearish to bullish. Traders closely watching GIGGLEUSDT are noting the strengthening momentum as it nears a breakout zone. The good trading volume adds confidence to this pattern, showing that market participants are positioning early in anticipation of a reversal.
Investors’ growing interest in GIGGLEUSDT reflects rising confidence in the project’s long-term fundamentals and current technical strength. If the breakout confirms with sustained volume, this could mark the start of a fresh bullish leg. Traders might find this a valuable setup for medium-term gains, especially as the wedge pattern completes and buying momentum accelerates.
✅ Show your support by hitting the like button and
✅ Leaving a comment below! (What is your opinion about this Coin?)
Your feedback and engagement keep me inspired to share more insightful market analysis with you!
BAT Analysis (4H)From the point we marked as the start, BAT appears to have entered a bullish diametric pattern.
It now seems to be in wave F, which is a bearish wave.
We have identified two entry points for BAT, where positions can be opened using a DCA approach.
The targets have been marked on the chart.
A daily candle close below the invalidation level will invalidate this analysis.
For risk management, please don't forget stop loss and capital management
When we reach the first target, save some profit and then change the stop to entry
Comment if you have any questions
Thank You

EURUSD Weekly Watchlist | Range Break or Fake?EUR has been moving in a bullish trendline for a long time and then formed a clear consolidation range. Price has reacted well to both the top and bottom of this range, showing a well-defined structure.
On Friday, the last candle closed relatively strong, and now we need to see whether this range breaks at the start of the new week — and if it does, whether the breakout is genuine or a fake breakout.
Overall, our bias on EUR remains bullish, and we are looking for long opportunities, unless we see clear signs of a trend reversal on the euro.
