Copper-hungry wild Bears Attack for the Third timeIn this video, we aim to forecast the copper trend for this year using Fibonacci tools and harmonic patterns.
Aggressive bears entered the market twice in 2025, and we expect a sharper decline in the new year, with prices potentially dropping by at least 30%.
Harmonic Patterns

BTC Looks Heavy...Happy New Year, Folks!
I hope you have a good time... so, BTC... looks heavy by my mind. Following to the swings structure it shows inability to return back to 94K area. First it was not able to proceed higher, showing too deep retracement. Now it stands flat under 90K.
On daily chart, with bullish MACD direction it starts reminding a bearish dynamic pressure, suggesting downside breakout. Besides, on weekly chart, consolidation is taking the shape of the pennant, which is also bearish.
Situation could change if BTC somehow will break above 91-92K area. In this case bearish pressure pattern will be cancelled. But right now, it seems that chances on re-testing of 80K lows look better. We do not consider any new longs by far.

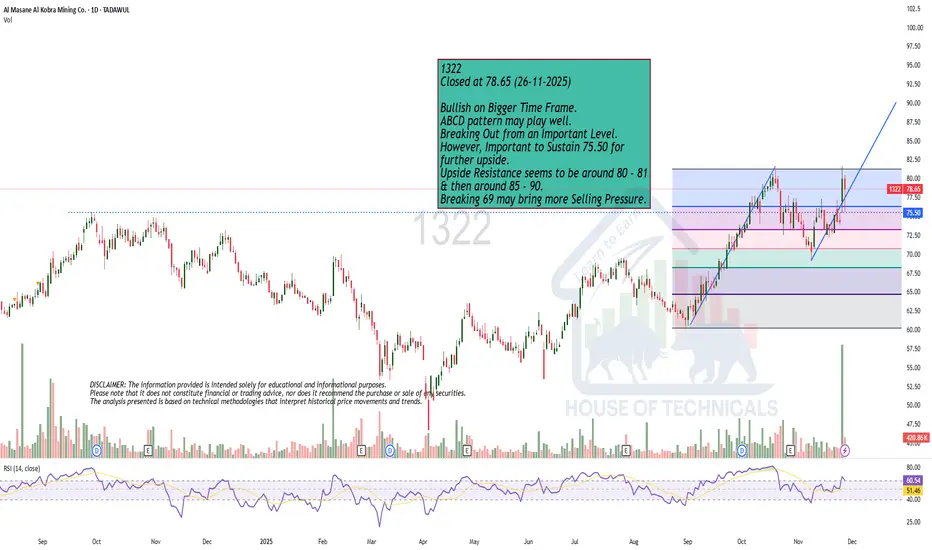
Bullish on Bigger Time Frame.1322
Closed at 78.65 (26-11-2025)
Bullish on Bigger Time Frame.
ABCD pattern may play well.
Breaking Out from an Important Level.
However, Important to Sustain 75.50 for
further upside.
Upside Resistance seems to be around 80 - 81
& then around 85 - 90.
Breaking 69 may bring more Selling Pressure.
$TRUMP Long?It seems that every time the 47th President’s coin drops by 70–90%, a pump follows after the initial large decline. This observation is based purely on chart patterns. However, since Trump is the current president, he might take actions that could potentially boost his coin. This argument is supported by the fact that yesterday DJT announced that it would distribute digital coins to its shareholders. Therefore, Trump could realistically create a catalyst that triggers a pump, as he is the President of the United States and has significant influence.
That said, this trade is extremely risky. The coin has no real utility, and its price movement is driven almost entirely by market sentiment, meaning it could continue falling far beyond the −70% to −90% levels.
Disclaimer:
This analysis is for informational and educational purposes only and does not constitute financial advice, investment recommendation, or an offer to buy or sell any securities. Stock prices, valuations, and performance metrics are subject to change and may be outdated. Always conduct your own due diligence and consult with a licensed financial advisor before making investment decisions. The information presented may contain inaccuracies and should not be solely relied upon for financial decisions. I am not personally liable for your own losses; this is not financial advice.

Bearish reversal off pullback resistance?Swissie (USD/CHF) is rising towards the pivot, which is a pullback resistance that aligns with the 38.2% Fibonacci retracement and could reverse to the 1st support.
Pivot: 0.7945
1st Support: 0.7891
1st Resistance: 0.7979
Disclaimer:
The opinions given above constitute general market commentary and do not constitute the opinion or advice of IC Markets or any form of personal or investment advice.
Any opinions, news, research, analyses, prices, other information, or links to third-party sites contained on this website are provided on an "as-is" basis, are intended to be informative only, and are not advice, a recommendation, research, a record of our trading prices, an offer of, or solicitation for, a transaction in any financial instrument and thus should not be treated as such. The information provided does not involve any specific investment objectives, financial situation, or needs of any specific person who may receive it. Please be aware that past performance is not a reliable indicator of future performance and/or results. Past performance or forward-looking scenarios based upon the reasonable beliefs of the third-party provider are not a guarantee of future performance. Actual results may differ materially from those anticipated in forward-looking or past performance statements. IC Markets makes no representation or warranty and assumes no liability as to the accuracy or completeness of the information provided, nor any loss arising from any investment based on a recommendation, forecast, or any information supplied by any third party

Welcome to 2026Hope we have a profitable year together, learn from last year’s lessons, use them in the new year, and grow step by step side by side. 🚀📊
#Pouyanfa #2026

Future of the Global Currency System1. Evolution from a Dollar-Centric System
Since the end of World War II, the US dollar has been the backbone of the global financial system, acting as the primary reserve currency, medium for international trade, and unit of account for commodities such as oil and gold. In the future, this dominance may gradually dilute rather than collapse abruptly. Factors such as rising US debt, persistent fiscal deficits, and the strategic use of sanctions have encouraged other nations to seek alternatives. This has led to a slow but steady diversification of reserves into other currencies like the euro, Chinese yuan, and gold, reducing overreliance on a single monetary authority.
2. Rise of Multipolar Currency Architecture
The future global currency system is likely to be multipolar rather than dominated by one single currency. Regional trade blocs may increasingly rely on their own currencies for settlements, reducing exposure to exchange rate risk and geopolitical pressure. For example, Asia, the Middle East, and parts of Africa may develop regional currency arrangements or settlement mechanisms that bypass traditional Western-dominated financial networks. This shift will not eliminate major currencies but will rebalance influence across multiple financial centers.
3. Central Bank Digital Currencies (CBDCs)
One of the most significant developments shaping the future of global currency is the rise of Central Bank Digital Currencies. CBDCs represent a digital form of sovereign money issued and regulated by central banks. Unlike cryptocurrencies, CBDCs are backed by governments and integrated into the existing financial system. Their adoption could revolutionize cross-border payments by making transactions faster, cheaper, and more transparent. In the long term, interoperability between CBDCs could create a new global settlement layer that reduces dependency on correspondent banking systems.
4. Impact of Blockchain and Distributed Ledger Technology
Blockchain technology is redefining trust in monetary systems. By enabling transparent, immutable, and decentralized record-keeping, it reduces the need for intermediaries. In the future, global currencies may leverage blockchain to enhance settlement efficiency, reduce fraud, and improve auditability. Even if governments do not fully decentralize currency issuance, the underlying technology will influence how financial infrastructure operates at both domestic and international levels.
5. Role of Cryptocurrencies and Stablecoins
While volatile cryptocurrencies may not replace fiat currencies entirely, they will play a complementary role in the future global currency ecosystem. Stablecoins—digital tokens pegged to fiat currencies or baskets of assets—are already being used for cross-border transfers and decentralized finance. In the future, regulated stablecoins could act as bridges between traditional finance and digital economies, particularly in regions with underdeveloped banking systems or high inflation.
6. De-dollarization and Strategic Currency Use
De-dollarization is expected to continue gradually, driven by geopolitical considerations rather than purely economic ones. Countries seeking monetary sovereignty will increasingly trade in local currencies and establish bilateral swap agreements. This trend will reshape global liquidity flows and reduce the dominance of existing financial chokepoints. However, de-dollarization will likely be selective and pragmatic, not ideological, ensuring stability while diversifying currency exposure.
7. Inflation, Debt, and Monetary Policy Challenges
Future global currencies will be shaped by how governments manage inflation and debt. High sovereign debt levels across developed economies may force central banks to adopt unconventional monetary policies for longer periods. This environment could erode public confidence in fiat currencies, accelerating interest in alternative stores of value such as digital assets, commodities, or hybrid monetary instruments that blend stability with innovation.
8. Financial Inclusion and Emerging Markets
A key opportunity in the future global currency system lies in financial inclusion. Digital currencies and mobile payment platforms can bring billions of unbanked individuals into the formal financial system. Emerging markets may leapfrog traditional banking models by adopting digital-first currency frameworks, enabling direct access to global trade and finance without relying on outdated infrastructure.
9. Geopolitics and Monetary Power
Currency has always been a tool of geopolitical influence, and this will intensify in the future. Control over payment systems, reserve currencies, and financial messaging networks will remain strategic assets. However, as alternatives emerge, the ability of any single nation to exert unilateral financial power may weaken, leading to a more balanced but complex global monetary order.
10. The Long-Term Vision
The future global currency system will not be defined by a single innovation or event but by a convergence of trends. It will likely be hybrid in nature—combining fiat currencies, digital sovereign money, private digital assets, and regional settlement systems. Trust, transparency, and adaptability will become the core pillars of monetary value, replacing the rigid hierarchies of the past.
Conclusion
In conclusion, the future of global currency is moving toward a more diversified, digital, and interconnected system. While traditional currencies will remain relevant, their role will evolve alongside technological progress and geopolitical shifts. The coming era will demand greater coordination, innovation, and resilience from policymakers, institutions, and market participants. Ultimately, the success of the future global currency system will depend on its ability to balance stability with flexibility, sovereignty with cooperation, and innovation with trust.

Global Currency Reset: Concept, Drivers, and ImplicationsThe idea of a Global Currency Reset (GCR) refers to a broad restructuring or realignment of the world’s monetary and currency systems. It is not a single event with a universally agreed definition, but rather a conceptual framework used to describe major changes in exchange rates, reserve currencies, monetary policies, and global financial architecture. Throughout history, global currency systems have undergone resets—sometimes gradually and sometimes abruptly—driven by economic crises, geopolitical shifts, technological change, and evolving trade relationships. In the modern context, discussions around a global currency reset have intensified due to rising debt levels, inflationary pressures, digital currencies, and the changing balance of global economic power.
Historical Background of Currency Resets
Historically, currency resets have often followed periods of severe economic imbalance. One of the most prominent examples was the Bretton Woods system established after World War II, which pegged major currencies to the US dollar, and the dollar itself to gold. This system effectively reset the global monetary order, stabilizing exchange rates and facilitating post-war reconstruction. However, when the United States suspended gold convertibility in 1971, the world transitioned to a fiat currency system, marking another significant reset.
Other examples include hyperinflation-driven currency reforms in countries like Germany (1923), Zimbabwe (2009), and Venezuela (multiple times), as well as the formation of the Eurozone, where multiple national currencies were replaced by a single shared currency. These episodes illustrate that currency resets are not theoretical—they are recurring responses to systemic stress.
Key Drivers Behind a Global Currency Reset
Several structural forces are often cited as drivers that could lead to a global currency reset in the modern era:
Excessive Global Debt
Governments, corporations, and households worldwide are carrying historically high levels of debt. When debt becomes unsustainable, currencies may be devalued, restructured, or replaced as a way to reduce real debt burdens.
Inflation and Monetary Expansion
Large-scale money printing, especially after financial crises and pandemics, has increased concerns about currency debasement. Persistent inflation can erode trust in fiat currencies, increasing calls for monetary reform.
Shift in Global Economic Power
The dominance of the US dollar has been a cornerstone of the global financial system. However, the rise of emerging economies, particularly China and India, has fueled discussions about a more multipolar currency system.
Geopolitical Tensions and Sanctions
Economic sanctions and trade conflicts have encouraged some nations to reduce dependence on the dollar and develop alternative payment systems, accelerating fragmentation in the global currency framework.
Technological Innovation
The emergence of blockchain technology, cryptocurrencies, and central bank digital currencies (CBDCs) is reshaping how money is issued, transferred, and stored, potentially laying the groundwork for a reset.
Role of the US Dollar and Reserve Currencies
At the heart of global currency reset discussions lies the role of the US dollar as the world’s primary reserve currency. The dollar dominates international trade, foreign exchange reserves, and global debt markets. While this dominance provides stability and liquidity, it also creates vulnerabilities. US monetary policy decisions have global consequences, sometimes leading to capital flows, currency volatility, and financial instability in emerging markets.
A global currency reset does not necessarily imply the collapse of the dollar, but it could involve a rebalancing—with greater roles for other currencies such as the euro, Chinese yuan, or even a basket-based system similar to the IMF’s Special Drawing Rights (SDRs).
Digital Currencies and the Reset Narrative
One of the most transformative elements in modern currency discussions is the rise of digital currencies. Central banks around the world are exploring or piloting CBDCs to improve payment efficiency, enhance financial inclusion, and maintain monetary sovereignty in the face of private cryptocurrencies.
CBDCs could act as a soft reset by changing how money circulates without abandoning existing currencies. On the other hand, decentralized cryptocurrencies like Bitcoin are often viewed by proponents as alternatives to fiat systems, especially in countries facing currency instability. While unlikely to replace national currencies entirely, they influence how people perceive and trust traditional money systems.
Potential Forms of a Global Currency Reset
A global currency reset does not have to be a dramatic overnight event. It can take multiple forms:
Gradual Devaluation and Realignment: Exchange rates adjust over time to reflect economic realities.
Introduction of New Monetary Frameworks: Greater reliance on currency baskets or regional monetary arrangements.
Digital Transformation: Widespread adoption of CBDCs and reduced reliance on physical cash.
Debt Restructuring and Inflation Management: Using controlled inflation or policy reforms to manage excessive debt.
In extreme scenarios, resets can involve currency redenomination or replacement, but such outcomes are typically localized rather than truly global.
Implications for Global Trade and Markets
A currency reset would have profound effects on international trade, capital markets, and investment strategies. Exporters and importers would face changing competitiveness due to currency realignments. Financial markets could experience volatility as investors reprice assets and reassess risk.
For emerging markets, a reset could provide relief from dollar-denominated debt pressures, but it could also introduce uncertainty if capital flows become unstable. Developed economies may face challenges in maintaining financial dominance and policy independence.
Impact on Individuals and Businesses
For individuals, the effects of a currency reset are often felt through inflation, changes in purchasing power, interest rates, and asset prices. Savings held in cash may lose value during inflationary resets, while real assets such as equities, real estate, and commodities may act as hedges.
Businesses must adapt to changing exchange rates, supply chain adjustments, and new regulatory frameworks. Companies engaged in international trade or finance are particularly sensitive to currency realignments.
Myths and Misconceptions
The term “global currency reset” is sometimes associated with conspiracy theories promising sudden wealth redistribution or instant revaluation of certain currencies. In reality, monetary resets are complex, policy-driven processes aimed at restoring stability, not creating overnight riches. Understanding the economic fundamentals behind currency changes is essential to separating credible analysis from speculation.
Conclusion
A Global Currency Reset is best understood as an evolving process rather than a single dramatic event. It reflects the continuous adaptation of the global monetary system to economic imbalances, technological change, and geopolitical realities. While the current system faces significant challenges—ranging from debt and inflation to digital disruption—a reset, whether gradual or structural, aims to restore confidence, stability, and efficiency in global finance.
For policymakers, investors, and individuals alike, the key lies in awareness and adaptability. History shows that currencies change, systems evolve, and financial resilience comes not from predicting exact outcomes, but from understanding the forces that drive transformation in the global monetary order.
XAUUSD at Key Resistance | Breakdown Watch🔥 Great job to all TradingView followers and traders!
🎄 Happy New Year to everyone — wishing you a year full of clarity, discipline, peace, and profitable trades ✨📉
📌 Fundamentals | Global Peace & Gold 🌍🕊️
From a fundamental perspective, any reduction in geopolitical tensions and movement toward global peace can reduce demand for safe-haven assets like Gold (XAUUSD).
As risk sentiment improves, capital often rotates out of gold, increasing the probability of corrections or bearish moves in price.
⚠️ Fake Move at the High
Recent price action shows a fake breakout above the key resistance zone,
where liquidity was taken above previous highs, followed by a sharp rejection — a classic sign of buyer exhaustion and smart money distribution.
📊 Technical Analysis | XAUUSD – 4H Timeframe
🔹 Price has reacted strongly after the fake move
🔹 Price is still trading above the rising dynamic support
🔹 The upper resistance zone continues to act as a strong supply area
📉 Primary Scenario (Bearish):
As long as price remains below the marked resistance zone,
the market holds a bearish corrective / continuation potential.
❗️ If the dynamic support trendline is broken with confirmation,
we can expect price to move toward
👉 lower support levels, clearly marked on the chart.
📍 These zones may act as potential downside targets in the bearish scenario.
⚠️ Key Note
For now, price is still holding above dynamic support,
so a confirmed break is required to fully validate the bearish scenario.
❗️ Disclaimer
❗️ This analysis reflects personal opinion only and is not financial advice
❗️ Always apply proper risk management and trade based on your own trading plan
📊 What’s your view?
🔘 Bearish continuation after support break 📉
🔘 Support holds and bullish recovery ⏳
👇 Share your thoughts in the comments — looking forward to your perspective!
🏷️ Tags
#XAUUSD #Gold #TechnicalAnalysis #PriceAction
#FakeBreakout #SupportResistance
#TradingView #SmartMoney #Forex
✨📉
Trade smart and stay consistent!

America’s Financial Influence: Shaping the Global Economic OrderAmerica’s financial influence is one of the most powerful forces shaping the modern global economy. From the dominance of the US dollar to the reach of Wall Street, the United States plays a central role in determining capital flows, investment trends, monetary conditions, and financial stability across the world. This influence is not the result of a single factor, but rather a combination of historical developments, economic strength, institutional depth, technological leadership, and geopolitical power. Together, these elements make the US financial system a cornerstone of the global economic architecture.
1. Historical Foundations of American Financial Power
The roots of America’s financial influence can be traced back to the aftermath of World War II. As Europe and much of Asia rebuilt their economies, the United States emerged as the world’s strongest industrial and financial power. The Bretton Woods system, established in 1944, placed the US dollar at the center of the global monetary system, pegged to gold and used as the primary reserve currency. Although the gold standard ended in the 1970s, the dollar retained its dominant role, cementing America’s long-term financial leadership.
This historical advantage allowed US financial institutions, markets, and regulations to become global benchmarks. Over time, investors, governments, and corporations began to view American markets as the safest and most liquid places to store and deploy capital.
2. The Dominance of the US Dollar
At the heart of America’s financial influence lies the US dollar. It is the world’s primary reserve currency, the most widely used medium for international trade, and the main unit of account for commodities such as oil, gold, and agricultural products. Central banks across the globe hold a significant portion of their foreign exchange reserves in dollars, reinforcing its importance.
Dollar dominance gives the United States unique advantages. It allows the US government to borrow at lower costs, run large fiscal deficits, and respond aggressively to economic crises. It also gives American policymakers significant leverage over the global financial system, as access to dollar liquidity often determines the stability of other economies, especially emerging markets.
3. Wall Street and Global Capital Markets
Wall Street is the nerve center of global finance. US equity markets, particularly the New York Stock Exchange (NYSE) and NASDAQ, are the largest and most liquid in the world. They attract companies from every continent seeking capital, valuation, and global visibility. Many of the world’s largest multinational corporations choose to list their shares in the US because of investor depth, transparency, and strong legal frameworks.
US bond markets are equally influential. The market for US Treasury securities is considered the safest and most liquid in the world, serving as a benchmark for interest rates globally. Movements in US bond yields often influence borrowing costs for governments and corporations far beyond American borders.
4. The Role of the Federal Reserve
The US Federal Reserve is arguably the most powerful central bank in the world. Its monetary policy decisions—such as changes in interest rates, quantitative easing, or liquidity support—have global consequences. When the Fed tightens policy, capital often flows out of emerging markets back into the US, putting pressure on foreign currencies and financial systems. Conversely, when the Fed eases policy, global liquidity expands, boosting risk assets worldwide.
During global crises, such as the 2008 financial crisis and the COVID-19 pandemic, the Federal Reserve acted as a global lender of last resort by providing dollar swap lines to other central banks. This reinforced the idea that global financial stability often depends on US monetary leadership.
5. American Financial Institutions and Corporations
Large American banks, asset managers, and financial institutions play a crucial role in global finance. Firms such as JPMorgan Chase, Goldman Sachs, BlackRock, and Morgan Stanley manage trillions of dollars in assets and influence investment decisions across countries and sectors. Their research, risk models, and capital allocation strategies shape global market behavior.
In addition, US-based corporations dominate sectors like technology, finance, and consumer services. These companies generate revenues worldwide, repatriate profits through American financial channels, and deepen the global reliance on US capital markets.
6. Regulatory and Legal Influence
The US financial system is underpinned by strong legal institutions, property rights, and regulatory frameworks. American accounting standards, disclosure requirements, and corporate governance practices often serve as global norms. International investors trust US markets because of their transparency and enforcement mechanisms.
Moreover, US regulations can have extraterritorial effects. Financial institutions around the world often comply with US rules to maintain access to dollar markets and American clients. This regulatory reach extends America’s financial influence far beyond its borders.
7. Sanctions and Geopolitical Power
America’s control over key financial infrastructure gives it significant geopolitical leverage. The US can impose financial sanctions that restrict access to dollar payments, banking networks, and capital markets. Such measures can have severe economic consequences for targeted countries, companies, or individuals.
While sanctions are a political tool, they highlight how deeply embedded the US financial system is in global trade and finance. Even countries that seek to reduce dependence on the dollar often find it difficult to do so in practice.
8. Technology, Innovation, and Financial Leadership
The United States is also a leader in financial innovation. From fintech and digital payments to venture capital and startup ecosystems, America sets trends that are quickly adopted worldwide. Silicon Valley and other innovation hubs attract global talent and capital, reinforcing US leadership in emerging financial technologies.
American dominance in technology also strengthens its financial influence, as global platforms, payment systems, and investment tools are often developed and funded through US markets.
9. Challenges to American Financial Influence
Despite its strength, America’s financial dominance faces challenges. Rising public debt, political polarization, and periodic financial crises raise questions about long-term sustainability. Other economies, particularly China and the European Union, are working to strengthen their own financial systems and reduce reliance on the dollar.
Efforts to develop alternative payment systems, regional trade currencies, and digital currencies signal a gradual diversification of global finance. However, replacing America’s financial role entirely remains difficult due to the scale, trust, and liquidity of US markets.
10. Conclusion
America’s financial influence is the result of decades of economic leadership, institutional strength, and global integration. The dominance of the US dollar, the power of Wall Street, the reach of the Federal Reserve, and the global role of American corporations collectively shape how money moves around the world. While challenges and competitors are emerging, the United States remains the central pillar of the global financial system. Understanding America’s financial influence is essential for grasping how global markets function, how crises spread, and how economic power is exercised in the modern world.

Reserve Currency DominancePower, Stability, and the Architecture of Global Finance
Reserve currency dominance refers to the privileged position enjoyed by a national currency that is widely held by central banks and governments as part of their foreign exchange reserves and used extensively in international trade, finance, and investment. Throughout modern economic history, reserve currencies have played a decisive role in shaping global financial systems, influencing geopolitical power, and determining the flow of capital across borders. The dominance of a reserve currency is not merely a monetary phenomenon; it is a reflection of economic strength, institutional credibility, political stability, and global trust.
Understanding Reserve Currencies
A reserve currency is one that foreign central banks and monetary authorities hold in significant quantities as part of their official reserves. These reserves are used to stabilize domestic currencies, facilitate international trade payments, service external debt, and intervene in foreign exchange markets when required. While many currencies are traded globally, only a few achieve reserve currency status because this requires deep, liquid financial markets and sustained confidence in the issuing country.
Historically, reserve currency dominance has shifted over time. The Dutch guilder in the 17th century and the British pound sterling in the 19th and early 20th centuries were once dominant reserve currencies. Since the mid-20th century, the US dollar has occupied this position, becoming the cornerstone of the global financial system.
Drivers of Reserve Currency Dominance
The dominance of a reserve currency is driven by several interconnected factors. First is economic size and trade integration. Countries with large economies and extensive trade networks naturally see their currencies used more widely. The United States, for instance, accounts for a significant share of global GDP and international trade, reinforcing the global role of the dollar.
Second is financial market depth and liquidity. Reserve currencies must be supported by large, transparent, and highly liquid capital markets. Investors and central banks prefer currencies that can be deployed in large volumes without causing market disruptions. US Treasury markets, considered among the safest and most liquid in the world, play a critical role in sustaining dollar dominance.
Third is macroeconomic and political stability. Confidence is central to reserve currency status. Low inflation, predictable monetary policy, strong legal frameworks, and political stability reassure global investors that the value of the currency will be preserved over time. Even during periods of crisis, the dollar has often strengthened due to its perceived safe-haven status.
Fourth is network effects. Once a currency becomes widely used, its dominance reinforces itself. Trade invoicing, commodity pricing (such as oil), international lending, and global payment systems tend to converge on the same currency, making it costly and inefficient to switch to alternatives.
Benefits of Reserve Currency Dominance
For the issuing country, reserve currency dominance offers significant advantages. One of the most notable is exorbitant privilege—the ability to borrow internationally in one’s own currency at lower interest rates. The United States can run persistent current account deficits because global demand for dollars and dollar-denominated assets remains strong.
Another benefit is greater financial flexibility. Reserve currency countries can respond more effectively to economic shocks, as demand for their currency tends to remain resilient even during crises. This allows for more aggressive fiscal and monetary interventions without immediate balance-of-payments constraints.
Reserve currency dominance also enhances geopolitical influence. Control over the dominant currency and associated financial infrastructure enables the issuing country to exert influence through sanctions, access to global payment systems, and international financial institutions. This has become a powerful tool of economic statecraft in the modern era.
Costs and Risks of Dominance
Despite its advantages, reserve currency dominance also entails costs. Persistent capital inflows can lead to currency overvaluation, harming export competitiveness and domestic manufacturing—a phenomenon often discussed in the context of the “Dutch disease.”
Additionally, the issuing country may face pressure to supply global liquidity, especially during crises. This can result in expanding debt levels and long-term fiscal challenges. Over time, excessive reliance on reserve currency privileges may weaken economic discipline.
From a global perspective, reserve currency dominance can contribute to systemic imbalances. Heavy dependence on a single currency exposes the world to shocks originating from the issuing country’s domestic policies. Changes in US monetary policy, for example, can trigger capital flow volatility and currency crises in emerging markets.
Challenges to Existing Dominance
In recent years, the dominance of the US dollar has faced increasing scrutiny. The rise of multipolar economic power, especially China, has prompted discussions about a more diversified reserve system. The euro has established itself as the second most important reserve currency, while the Chinese renminbi has been gradually internationalized through trade settlement agreements and financial market reforms.
Technological innovation also poses a challenge. Digital currencies, including central bank digital currencies (CBDCs), have the potential to alter cross-border payment systems and reduce reliance on traditional reserve currencies. However, technology alone cannot replace the deep trust and institutional strength required for true reserve currency dominance.
Geopolitical fragmentation and the use of financial sanctions have further motivated some countries to reduce their exposure to the dominant reserve currency. While this trend toward diversification is real, it remains gradual and limited by the lack of viable, fully trusted alternatives.
The Future of Reserve Currency Dominance
The future of reserve currency dominance is likely to be characterized by evolution rather than abrupt change. While the US dollar remains deeply entrenched, its share of global reserves may continue to slowly decline as central banks diversify into other currencies and assets such as gold.
A more multipolar reserve system could emerge, where several major currencies coexist, each serving regional or functional roles. However, achieving true parity with the dollar would require decades of consistent economic performance, institutional credibility, and open financial markets—conditions that are difficult to replicate.
Conclusion
Reserve currency dominance lies at the heart of the global financial order. It reflects not just monetary strength, but economic scale, institutional trust, and geopolitical influence. While dominance brings significant benefits to the issuing country, it also creates vulnerabilities and global imbalances. As the world economy becomes more multipolar and technologically advanced, the structure of reserve currencies may gradually evolve. Nevertheless, the core principles underpinning reserve currency dominance—trust, stability, and liquidity—will remain unchanged, continuing to shape global finance for decades to come.

Central Bank Digital Currencies (CBDCs)Transforming the Future of Money
Central Bank Digital Currencies (CBDCs) represent one of the most significant innovations in modern monetary systems. As digital payments become increasingly dominant and private cryptocurrencies challenge traditional finance, central banks around the world are exploring CBDCs as a sovereign, digital form of national currency. A CBDC is essentially a digital version of a country’s fiat money, issued and regulated by the central bank, and backed by the full faith and credit of the government. Unlike cryptocurrencies such as Bitcoin or Ethereum, CBDCs are centralized, legally recognized, and designed to complement or enhance existing monetary systems rather than replace them.
Understanding the Concept of CBDCs
At their core, CBDCs are digital liabilities of a central bank, just like physical cash. However, instead of existing in paper or coin form, they are stored and transferred electronically. CBDCs can be designed for retail use (accessible to the general public) or wholesale use (restricted to financial institutions for interbank settlements). Retail CBDCs aim to function like digital cash, allowing individuals and businesses to make payments directly using central bank money. Wholesale CBDCs, on the other hand, focus on improving the efficiency and security of large-value transactions between banks and financial institutions.
The motivation behind CBDCs arises from the rapid decline in cash usage in many economies, the rise of private digital payment platforms, and concerns about financial stability, monetary sovereignty, and financial inclusion. Central banks want to ensure that public money remains relevant in a digital economy.
Key Objectives of CBDCs
One of the primary objectives of CBDCs is to enhance payment system efficiency. Traditional payment systems often involve multiple intermediaries, leading to higher costs, delays, and settlement risks. CBDCs can enable near-instant, low-cost transactions, both domestically and potentially across borders.
Another important objective is financial inclusion. In many countries, especially developing economies, a significant portion of the population remains unbanked or underbanked. CBDCs can provide access to digital payments and basic financial services through simple digital wallets, even without a traditional bank account.
CBDCs also help central banks maintain monetary sovereignty. As private cryptocurrencies and stablecoins grow in popularity, there is a risk that national currencies could lose relevance. CBDCs ensure that the central bank continues to play a central role in the monetary system, preserving control over money supply and monetary policy transmission.
Types of CBDC Models
CBDCs can be designed using different operational models. In a direct model, the central bank issues CBDCs and manages all retail accounts and transactions. While this provides maximum control, it can be operationally complex and burdensome for the central bank.
In an indirect or intermediated model, commercial banks and payment service providers act as intermediaries between the central bank and users. The central bank issues the CBDC, but private institutions handle customer onboarding, wallets, and compliance. This model leverages existing financial infrastructure and is widely favored.
A hybrid model combines elements of both, where the central bank maintains a core ledger while intermediaries manage customer-facing services. Each model has implications for privacy, scalability, and financial stability.
Impact on Monetary Policy and Banking
CBDCs have the potential to significantly influence monetary policy transmission. Since CBDCs are direct claims on the central bank, interest-bearing CBDCs could allow central banks to transmit policy rates more directly to households and businesses. This could enhance the effectiveness of monetary policy, especially during economic downturns.
However, CBDCs also raise concerns for the traditional banking system. If individuals shift large portions of their deposits from commercial banks to CBDC wallets, banks could face funding pressures, potentially reducing their ability to lend. To mitigate this risk, central banks may impose limits on CBDC holdings or design them as non-interest-bearing instruments.
Privacy, Security, and Technological Considerations
Privacy is a critical issue in the design of CBDCs. While cash transactions offer a high degree of anonymity, digital payments are inherently traceable. Central banks must balance the need for user privacy with requirements for anti-money laundering (AML) and combating the financing of terrorism (CFT). Most CBDC designs aim for “controlled anonymity,” where small transactions remain private, while larger transactions are subject to regulatory scrutiny.
From a technological perspective, CBDCs can be built using centralized databases or distributed ledger technology (DLT), such as blockchain. While blockchain offers transparency and resilience, it may face scalability challenges. Centralized systems, on the other hand, can handle high transaction volumes but may present single points of failure. Cybersecurity is paramount, as CBDCs would be critical national infrastructure.
Global Developments and Case Studies
Globally, CBDC development is accelerating. China’s Digital Yuan (e-CNY) is one of the most advanced large-scale CBDC projects, with extensive pilot programs across multiple cities. The European Central Bank is exploring a Digital Euro, while the United States is conducting research into a potential Digital Dollar. In India, the Reserve Bank of India (RBI) has launched pilot programs for both retail and wholesale CBDCs, aiming to enhance payment efficiency and reduce reliance on cash.
Each country’s approach reflects its unique economic structure, regulatory environment, and policy priorities, highlighting that there is no one-size-fits-all CBDC model.
Challenges and Risks of CBDCs
Despite their potential benefits, CBDCs face several challenges. Operational complexity, cybersecurity risks, and high implementation costs are major concerns. There are also legal and regulatory challenges, including changes to existing laws governing currency and payments.
Cross-border CBDC usage introduces additional complexities related to exchange rates, capital controls, and international coordination. Without global standards, interoperability between different national CBDCs could be limited.
The Future of CBDCs
Looking ahead, CBDCs are likely to coexist with cash, bank deposits, and private digital payment systems rather than fully replacing them. As technology evolves and pilot programs mature, central banks will refine CBDC designs to balance innovation with stability.
In conclusion, Central Bank Digital Currencies represent a transformative step in the evolution of money. By combining the trust of central banks with the efficiency of digital technology, CBDCs have the potential to reshape payment systems, enhance financial inclusion, and strengthen monetary sovereignty. However, their success will depend on careful design, robust regulation, and public trust, making CBDCs one of the most important financial developments of the 21st century.

Unlocking Currency DerivativesStrategies, Instruments, and Risk Management in the Global FX Market
Currency derivatives are powerful financial instruments that allow traders, investors, and corporations to manage foreign exchange (FX) risk, speculate on currency movements, and enhance portfolio efficiency. As global trade, capital flows, and cross-border investments continue to expand, understanding and effectively using currency derivatives has become essential. Unlocking currency derivatives means not only knowing what these instruments are, but also mastering how, why, and when to use them.
Below is a detailed, structured explanation of currency derivatives, their types, uses, strategies, risks, and relevance in modern financial markets.
1. Understanding Currency Derivatives
Currency derivatives are financial contracts whose value is derived from an underlying currency pair (e.g., USD/INR, EUR/USD).
They allow participants to lock in future exchange rates or profit from changes in currency prices.
These instruments are widely used in international trade, investment hedging, and speculative trading.
Currency derivatives trade both on exchanges (standardized contracts) and over-the-counter (OTC) markets (customized contracts).
2. Why Currency Derivatives Matter
Exchange rates are influenced by interest rates, inflation, geopolitics, trade balances, and central bank policies.
Sudden currency fluctuations can significantly impact profits, costs, and asset values.
Currency derivatives help manage uncertainty by transferring risk from those who want to avoid it to those willing to take it.
They provide transparency, liquidity, and price discovery in global FX markets.
3. Major Types of Currency Derivatives
Currency Forwards
Customized OTC contracts to buy or sell a currency at a predetermined rate on a future date.
Widely used by corporates to hedge import/export exposure.
Currency Futures
Exchange-traded, standardized versions of forwards.
Offer transparency, daily mark-to-market settlement, and lower counterparty risk.
Currency Options
Give the buyer the right, but not the obligation, to buy or sell a currency at a specific rate before or on expiry.
Useful for asymmetric risk protection.
Currency Swaps
Agreements to exchange principal and interest payments in different currencies.
Commonly used by banks, governments, and large institutions.
4. Participants in the Currency Derivatives Market
Hedgers
Corporations, exporters, importers, and investors protecting against adverse currency movements.
Speculators
Traders seeking to profit from anticipated currency fluctuations.
Arbitrageurs
Participants exploiting price inefficiencies across markets.
Institutional Players
Banks, hedge funds, asset managers, and central banks providing liquidity and depth.
5. Hedging with Currency Derivatives
Currency derivatives allow businesses to stabilize cash flows and protect profit margins.
Importers hedge against currency appreciation, while exporters hedge against depreciation.
Options provide flexible hedging by allowing participation in favorable moves while limiting downside risk.
Effective hedging improves financial planning, budgeting, and investor confidence.
6. Speculative Trading Strategies
Directional Trading
Taking long or short positions based on macroeconomic or technical analysis.
Carry Trade
Borrowing in a low-interest currency and investing in a high-interest currency.
Volatility Trading
Using options strategies such as straddles and strangles to profit from large price movements.
Range Trading
Benefiting from stable currency movements using option selling strategies.
7. Role of Interest Rates and Central Banks
Interest rate differentials are a major driver of currency prices.
Central bank actions, such as rate hikes, quantitative easing, and forward guidance, directly impact FX markets.
Currency derivatives allow traders to position themselves ahead of policy announcements.
Understanding monetary policy cycles is critical to unlocking consistent returns.
8. Risk Management in Currency Derivatives
Currency derivatives involve leverage, which can magnify gains and losses.
Key risks include market risk, liquidity risk, counterparty risk, and regulatory risk.
Stop-loss strategies, position sizing, and diversification are essential risk controls.
Margin requirements and mark-to-market settlements demand disciplined capital management.
9. Regulatory Framework and Market Integrity
Exchange-traded currency derivatives are regulated to ensure transparency and reduce systemic risk.
OTC markets have evolved with central clearing and reporting requirements.
In countries like India, regulators such as SEBI and RBI oversee currency derivative markets.
Compliance enhances investor protection and market stability.
10. Currency Derivatives in Portfolio Diversification
Currency exposure can be both a risk and an opportunity.
Currency derivatives help investors diversify beyond equities and commodities.
They provide low correlation benefits during global market stress.
Professional portfolios often use currency overlays to optimize returns.
11. Technology and the Evolution of FX Derivatives
Electronic trading platforms have increased accessibility and execution speed.
Algorithmic and high-frequency trading play a growing role in FX derivatives.
Advanced analytics, AI models, and real-time data improve decision-making.
Retail participation has increased due to lower entry barriers.
12. Challenges and Common Mistakes
Overleveraging due to low margin requirements.
Trading without understanding macroeconomic drivers.
Ignoring implied volatility and time decay in options.
Lack of a clear risk management framework.
13. Strategic Mindset for Mastery
Successful currency derivative trading requires patience, discipline, and continuous learning.
Combining macroeconomic insights with technical analysis enhances accuracy.
Keeping a trading journal helps refine strategies.
Long-term consistency matters more than short-term profits.
14. Future Outlook of Currency Derivatives
Globalization and cross-border investments will continue to drive demand.
Emerging market currencies will see increased derivative participation.
Regulatory clarity and technological innovation will expand market depth.
Currency derivatives will remain a cornerstone of global financial risk management.
Conclusion
Unlocking currency derivatives is about transforming complexity into opportunity. These instruments empower market participants to hedge risk, speculate intelligently, and navigate global financial uncertainty with confidence. When used with proper knowledge, discipline, and risk control, currency derivatives become not just tools of protection, but engines of strategic growth in the modern financial ecosystem.

BTC | 4HCRYPTOCAP:BTC — 4H Zoom-In | Bottoming Structure
Respecting the broader BTC Monthly outlook, price has been supported by a highly validated convergent Q-Structure at the apex ➤ $80,619 . Given that this level remains unchallenged, the ongoing consolidation phase since November 21 can reasonably be interpreted as a bottoming formation.
All wave structures identified on this timeframe—including a Leading Diagonal as Minor Wave 1, a deep retracement ending in an Expanding Diagonal ⓒ, and the current consolidation in a Double Three (Flat | Zigzag | Triangle)—while respecting the interactive function of the illustrated Q-Structures—have collectively formed an integrated structure indicating the development of a significant bottom, marking the extreme point of Primary Wave ⓸ within the impulsive Wave III sequence of BTC’s second Cycle.
🔖 This potential reversal has been projected since Nov. 15 during the BTC decline.
🔖 This outlook is derived from insights within my Quantum Models framework.

GER30 H4 | Bullish Momentum To Extend FurtherBased on the H4 chart analysis, we could see the price fall to our buy entry at 24,474.21, which is a pullback support that 23.6% Fibonacci retracement.
Our stop loss is set at 24,195.24, which is a pullback support that aligns with the 61.8% Fibonacci retracement.
Our take profit is set at 24,786.98, which is a swing high resistance that is slightly below the 161.8% Fibonacci extension.
High Risk Investment Warning
Stratos Markets Limited (

BuyWhen resistance breaks and turns into support,
and price comes back to that area,
we BUY the retest.

US2000 H4 | Falling Towards Key SupportThe price is falling towards our buy entry level at 2,479.37, which is an overlap support that aligns with the 38.2% Fibonacci retracement.
Our Stop loss is set at 2,449.15, which aligns with the 50% Fibonacci retracement.
Our take profit is set at 2,538.48, which is a pullback resistance.
High Risk Investment Warning
Stratos Markets Limited (

How Overconfidence Destroys Profitable TradersHow Overconfidence Destroys Profitable Traders
Understanding Overconfidence in Trading
Welcome everyone to another article.
One of the most dangerous stages a trader can walk into is not fear… but overconfidence. (EGO)
Overconfidence in trading is essentially ego.
However, there is still an important difference:
- Confidence is a real belief built on proof, statistics, and discipline.
- Overconfidence is an inflated belief in your ability beyond the proof. This is driven by ego.
Many traders do not fail because they do not know enough.
They fail because at some point, they believe they know enough or know “everything.”
What Overconfidence appears as in Trading:
A trader builds a system. ( yay! )
They go on a clean winning streak maybe 10, 12, even 15 profitable trades in a row.
At this point, the trader begins to think and assume:
“ I’ve cracked the code. ”
- Risk gets increased .
- Position sizes get bigger .
- Rules start to bend .
Confidence continues grow until it crosses a dangerous path where belief is no longer supported by data, statistics and proof.
Reality eventually steps in.
You will never again feel as confident as you did during your first major winning streak when it looked like the market finally made sense and success was “ figured out. ”
That feeling is exactly what traps traders.
Overconfidence WILL break Risk Management
Overconfidence destroys a trader by slowly dismantling their risk management, their system, their discipline, their psychology and their consistency.
It rarely happens all at once.
First:
- “ I’ll just risk a little more this time. ”
- “ This setup looks perfect. ”
- “ I’m on a winning streak. ”
Over time, the trader begins to:
• Ignore position sizing rules ( Too many LOTS or contracts )
• Move stop losses (Increases risk)
• Add to losing trades ( Does not accept the original loss )
• Trade larger to “maximize opportunity” (Stick to what you can afford to lose )
The trader thinks and believes the system will continue to work, because it worked before.
But markets do not reward belief, they reward discipline. (I have mentioned this many times in my previous posts.)
Once risk management breaks, even a profitable system becomes dangerous and can lead to zero profits, or even down to negatives.
Overconfidence Blocks Positive criticism and continuous Learning
There is no such thing and there will never be a 100% perfecto trading system/strategy.
Losses are part of the game.
Overconfident traders struggle when reality does not meet their expectations.
Instead of adapting to the market by adjusting their strategy they:
- Resist feedback (Or consider any feedback as hate/negative criticism)
- Ignore changing market conditions (Consolidation, flat lining, barcoding etc)
- Refuse to admit the system is underperforming (Bad performance & results)
- Believe the problem can’t be them (“It’s not the system, it’s the computer!”)
But Why…?
Well because… their mind keeps rewinding the dopamine high from when everything worked perfectly and the win rate was 99%
They only remember the wins, and “ GREEN ” $$$ %%% not the probability.
The exact moment a trader believes they “can’t be wrong,” learning comes to a halt.
And in trading, when learning stops, losses accelerate, revenge trading increase, risk management collapses, and consistency becomes scrambled.
Overconfidence changes Traders into > Gamblers
Overconfidence does not just cause losses it can also change behavior.
Frustration from unexpected losses turns into:
- Anger
- Impatience
- Forced trades
- Revenge trading
Rules get ignored.
Emotions take control.
The trader may still look like a trader, but they are acting like a gambler.
The most dangerous part?
They still believe they are right…
Example: How Overconfidence Destroyed a Profitable Trader
Let’s look at Bobby.
Bobby was a profitable trader. A very successful one in his 4th year of trading.
He discovered what he believed was a 99% win-rate system.
The first month was incredible.
The second month was just as good. Cash flowing in, heaps of green.
By the third month, losses started to appear.
Instead of falling back, taking a breather and reassessing , Bobby doubled down.
Continuing to trade the same system despite clear signs of underperformance.
He was no longer focusing on perfect executions and setups, he was chasing the high.
Losses turned into frustration .
Frustration turned into anger .
Anger turned into impatience .
Soon Bobby was:
• Forcing trades
• Revenge trading
• Ignoring risk management
Bobby refused to take responsibility.
“It was my internet.”
“My computer lagged.”
“My family distraccted me.”
The excuses piled up, but the account kept shrinking.
Bobby did not fail because of the system.
Bobby failed because ego stopped him from adapting to the market and adjusting his system.
Markets Will Always Humble Ego
Markets will humble traders in ways they never expect.
No matter how experienced you are, there is always something else to learn.
Trading is not a destination, it is a constant process of adaptation towards the market. Traders who believe they “know everything” will always be reminded by the market that They. Do. Not.
Overconfidence doesn’t end trading careers immediately.
But it slowly erodes them trade by trade turning it into mental torture.
Final Thoughts
Confidence is necessary to trade.. But Ego is fatal!
The very moment a trader believes they have cracked the code is often the moment their decline begins.
Stay humble.
Respect risk.
Let statistics, not emotion, guide your decisions.
Because in trading, the market doesn’t punish ignorance it punishes ego.

Chapter IV: Own Yourself The shop felt different that morning. Not quieter ... just still. Like the air knew something was about to change before anyone said a word.
The Apprentice stood at the doorway with a small backpack slung over his shoulder. His hands were steady, but his breath wasn’t. He looked around the shop the workbench where he’d first fumbled a wrench, the corner where he’d stared at charts until his eyes blurred, the mirror that had once shown him more truth than he wanted to see.
The Mentor stepped out from behind the bench, wiping grease from his palms.
“So,” he said softly, “you’re heading out.”
The Apprentice nodded. “I think it’s time.”
The Mechanic leaned against the tool chest, arms crossed. “You sure you’re ready? Out there, nobody’s gonna explain things twice.”
The Apprentice smirked. “You barely explained them once.”
The Mechanic grinned. “Fair.”
The Mentor approached, his expression somewhere between pride and worry.
“You’ve learned the tools that matter the ones that don’t rust. Mirrors, reflections, candlesticks, maps. But there’s one lesson you can’t learn here.”
The Apprentice waited.
“Owning yourself.”
The Mentor tapped his chest. “That’s the part you have to figure out on your own.”
The Apprentice frowned. “What does that mean?”
The Mechanic answered first.
“It means when you mess up — and you will — you don’t blame the tools, the market, the shop, or the teacher. You take responsibility. You fix it. You grow.”
The Mentor added, “And when you succeed, you don’t pretend it was luck. You own that too.”
The Apprentice looked down at his hands... the same hands that once trembled holding a wrench, the same hands that had hovered nervously over a chart. Now they felt capable.
“Where do I go?” he asked.
The Mentor smiled. “Anywhere. The map isn’t the chart. The map is you.”
The Mechanic reached into a drawer and tossed him a small, worn socket — the one the Apprentice had dropped on his first day.
“A reminder,” he said. “Mistakes are part of the job. What you do after them is what counts.”
The Apprentice caught it, feeling the weight of metal and memory.
He stepped toward the door, then paused.
“Will I see you again?”
The Mentor shrugged. “Maybe. Maybe not. But you’ll hear us. Every time you hesitate, every time you doubt, every time you’re about to do something reckless... we’ll be there.”
The Mechanic smirked. “Especially the reckless part.”
The Apprentice laughed, then turned and walked out into the sunlight.
The door closed behind him with a soft click.
For a long moment, the shop was still.
Then the Mentor exhaled.
“He’ll be alright.”
The Mechanic nodded. “He’s got the tools.”
And somewhere down the road, the Apprentice walked toward a future he didn’t fully understand... carrying the lessons of the shop, the weight of the socket, and the quiet confidence of someone finally ready to own himself.


UK100 H4 | Bullish BreakoutThe price is falling towards our buy entry level at 9,923.57, which is an overlap support.
Our stop loss is set at 9,832.64, which is an overlap support.
Our take profit is set at 10,059.96, which aligns with the 61.8% Fibonacci projection.
High Risk Investment Warning
Stratos Markets Limited (

JPN225 H4 | Bullish Bounce OffThe price has bounced off our buy entry level at 50,261.74, which is an overlap support.
Our stop loss is set at 49,846.21, which is an overlap support.
Our take profit is set at 51,425.25, which is a pullback resistance.
High Risk Investment Warning
Stratos Markets Limited (

Could we see a reversal from here?KIWI (NZD/USD) is reacting off the pivot, which has been identified as an overlap support that aligns with the 38.2% Fibonacci retracement and could bounce to the 1st resistance, which is also an overlap resistance.
Pivot: 0.5744
1st Support: 0.5713
1st Resistance: 0.5792
Disclaimer:
The opinions given above constitute general market commentary and do not constitute the opinion or advice of IC Markets or any form of personal or investment advice.
Any opinions, news, research, analyses, prices, other information, or links to third-party sites contained on this website are provided on an "as-is" basis, are intended to be informative only, and are not advice, a recommendation, research, a record of our trading prices, an offer of, or solicitation for, a transaction in any financial instrument and thus should not be treated as such. The information provided does not involve any specific investment objectives, financial situation, or needs of any specific person who may receive it. Please be aware that past performance is not a reliable indicator of future performance and/or results. Past performance or forward-looking scenarios based upon the reasonable beliefs of the third-party provider are not a guarantee of future performance. Actual results may differ materially from those anticipated in forward-looking or past performance statements. IC Markets makes no representation or warranty and assumes no liability as to the accuracy or completeness of the information provided, nor any loss arising from any investment based on a recommendation, forecast, or any information supplied by any third party
