Silver Is Bouncing — But the Bearish ChannelSilver (XAGUSD) on the H1 timeframe remains firmly inside a well-defined descending channel, confirming that the broader structure is still bearish. The recent rebound is corrective, not impulsive price is reacting from short-term demand but continues to print lower highs beneath channel resistance.
Price is currently trading below the EMA cluster, with the EMA acting as dynamic resistance. Each bullish attempt has been capped near the descending trendline + resistance zone, reinforcing the idea that sellers are still in control. There is no structural break, no higher high, and no acceptance above resistance key requirements for a trend reversal that are still missing.
As long as price stays inside this channel, the path of least resistance remains to the downside. A rejection from the current resistance area opens room for continuation toward the lower channel boundary, with downside targets aligned near the highlighted green levels. Bulls only regain control if price breaks and holds above the channel resistance with follow-through.
Bias: Bearish continuation
Strategy mindset: Sell rallies, not bottoms
Invalidation: Clean breakout and acceptance above channel resistance
Trade what the chart confirms not what you hope will happen.
Harmonic Patterns

Silver Is Rising But the Real Test Is the Resistance ZoneSilver is currently trading inside a well-defined ascending channel, showing a clean sequence of higher lows after the sharp sell-off earlier. This structure confirms a technical recovery, not random price movement. Buyers have been defending the channel’s lower boundary consistently, and price is now holding above the channel midline, which keeps the short-term bullish bias intact.
However, price is now approaching a key resistance zone around 82.5–84.5, which aligns with prior supply and a historical reaction area. This zone has capped price multiple times in the past, making it a decision point rather than a free path higher. The current slowdown and minor pullbacks near this area suggest that momentum is being tested, not confirmed yet.
Scenarios to watch:
Bullish continuation: A strong breakout and acceptance above the resistance zone would open the path toward the upper boundary of the ascending channel, with upside continuation toward the marked target zone.
Rejection / pullback: Failure to break and hold above resistance likely leads to a controlled pullback toward the mid-channel or lower channel support, which would still be healthy within the current structure.
Key takeaway:
Silver is constructive, but not in breakout mode yet. This is a classic “wait-for-confirmation” area. Trade what price proves at resistance not what you expect.
This content is for educational purposes only, not financial advice. Trading involves risk always do your own analysis and manage risk responsibly.

Gold Is Bouncing — But This Is Still a Descending ChannelGold (XAUUSD) on the H1 timeframe is recovering from the lower boundary of a clearly defined descending channel, but structurally this move remains corrective. Price respected the channel support and the broader support zone, triggering a technical bounce, however, the market is still trading inside the bearish channel, not breaking it.
The rebound is unfolding with higher lows internally, yet price continues to face layered resistance: the channel midline, prior supply, and the EMA cluster. This zone has already capped multiple bullish attempts in the past, making it a decision area, not confirmation. As long as price fails to reclaim and hold above the upper channel boundary, sellers retain higher-timeframe control.
From a trader’s perspective, this is a contextual rally, not a trend shift. A pullback followed by continuation toward channel resistance is acceptable, but bullish continuation only becomes valid after a clean breakout and acceptance above the descending channel. Until then, upside is limited, and rejection scenarios remain active.
Bias: Corrective bounce within a bearish channel
Key focus: Reaction at channel resistance
Invalidation: Acceptance above channel + EMA reclaim
Trade the structure let price confirm before committing bias.
This analysis is for educational and informational purposes only and does not constitute financial advice. Market conditions can change rapidly always wait for confirmation, manage risk properly, and trade according to your own strategy and risk tolerance.

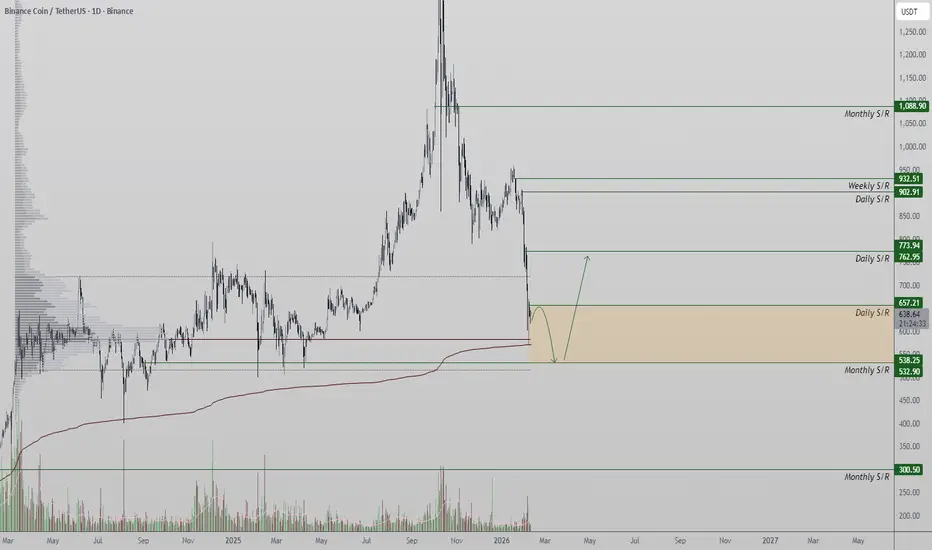
BNB Price, is $538 the macro low? Binance Coin price action has produced a technical bounce on the daily timeframe, reacting from VWAP support and the point of control of the broader trading range. While this reaction is structurally valid, it appears corrective in nature rather than the start of a sustained bullish reversal. The bounce has not been supported by strong bullish volume, suggesting limited follow-through potential.
From a resistance perspective, a new daily resistance has formed near the $657 level. This zone now acts as a key decision area for short-term price direction. As long as BNB remains capped below this resistance, downside risk remains elevated. Failure to reclaim and hold above $657 would keep sellers in control and favor continuation lower within the existing range structure.
If bearish pressure resumes, the next major downside target sits at the value area low of the larger trading range, located near $538. This level represents a high-probability area where price may attempt to rebalance and search for demand.
From a technical and price action perspective, the current bounce should be treated with caution. Without expanding bullish volume and acceptance above resistance, the move higher remains vulnerable to rejection, keeping the broader corrective trend intact and increasing the likelihood of a rotation toward lower support levels.

02-10 SPY FORECAST and PERSPECTIVE | Label | Price | Markings / Grouped Discoveries |
|-------|-------|--------------------------------|
|🔺 U5 | $700.64 | Top Resistance |
|🔺 U4 | $698.08 |
|🔺 U3 | $695.96 | ⚡ High GAMMA, big OI both sides
|🔺 U2 | $695.29 |
|🔺 U1 | $694.65 | *PM High $691.93, ORBH $691.65 grouped
|⭐ START | $693.95 | Gold accent, anchor. (Any nearby gamma, PM, ORB—grouped
|🔻 D1 | $693.27 | Support. PM Low $688.01, ORBL $688.35,
|🔻 D2 | $692.76 |
|🔻 D3 | $692.08 |
|💎 D4 | $691.40 |
|🔻 D5 | $688.03 | *PM Low $688.01, ORBL $688.35

Gold Isn’t Rushing Lower – What Is the Money Flow Telling Us?If we view the gold market as a flowing stream, XAUUSD is moving upward in a controlled and orderly manner —not aggressively, but with clear conviction. After the prior sharp shakeout, gold did not collapse ; instead, it quickly regained balance , signaling that underlying buying pressure remains intact and has not stepped aside.
Over yesterday and today, the news backdrop has continued to support precious metals . A cooling U.S. dollar and a shift back toward a defensive mindset have reinforced gold’s role as a natural safe haven. More importantly, no headline strong enough has emerged to force capital out of gold , allowing the primary trend to remain firmly in place.
From a technical standpoint, the recent pullbacks in XAUUSD are necessary pauses within a larger uptrend . Price has been consistently supported by the ascending trendline and the Ichimoku cloud , showing that buyers are ready to step in whenever the market cools . This behavior is building a progressively higher price base , rather than the kind of distribution typically seen near major tops.
As long as price holds above the 4,820 area, the most logical scenario remains continued upside. The upside objective around 5,400 is not an emotional projection , but a logical destination if the current structure remains unbroken. At this stage, following the trend and patiently buying pullbacks is a far safer and more effective approach than attempting to catch a top in a strong market.

TSLA- Importand pivot point!TSLA
.
Importand pivot point!
Quasiomodo pattern, logical volume and spread.
Key level and down channel roled as hard resistence.
Buy stop plan upon break!
.
US STOCKS- WALL STREET DREAM- LET'S THE MARKET SPEAK!


Figma (FIG): A Deep Dive into the Post-IPO OpportunityFigma (FIG): A Deep Dive into the Post-IPO Opportunity Amid AI-Driven Growth
Figma, the collaborative design software platform, emerged as one of the most anticipated IPOs of 2024, captivating the market with its vision to reinvent how digital products are built. Following its debut at $33 per share in July, the stock experienced a meteoric rise to a 52-week high of $142.92 in August, only to undergo a dramatic correction. Shares recently touched a low of $26.79, dipping below the IPO price and presenting a critical juncture for investors. This analysis explores whether the current valuation reflects a compelling buying opportunity for a company demonstrating robust fundamentals, or if significant risks still warrant caution.
The Core Investment Thesis: Strong Product-Led Growth in a Expanding Market
At its heart, Figma’s bullish case is built on its dominant position in the UI/UX design space and its successful transition from a disruptive startup to a scaled, growth-oriented public company.
Revenue Momentum: The company's financial performance remains strong. Q3 2025 revenue reached a record $274.2 million, representing impressive 38% year-over-year growth. This continues an unbroken streak of sequential quarterly growth since Q1 2024. Management's Q4 guidance of $292-$294 million (35% growth at the midpoint) reinforces confidence in sustained top-line expansion.
Superior Customer Metrics: Figma excels at both acquiring and expanding relationships with high-value clients. In Q3, it added over 1,000 new customers with Annual Recurring Revenue (ARR) of $10,000 or more. More importantly, its Net Dollar Retention (NDR) for this cohort was 131%, indicating that existing customers are significantly increasing their spend on the platform—a powerful testament to product stickiness and value delivery.
Fortress Balance Sheet: Figma exits Q3 with a formidable financial position, holding over $1.5 billion in cash, cash equivalents, and marketable securities against total liabilities of $684.7 million. Notably, a large portion of liabilities ($473.6 million) is deferred revenue, which represents cash already collected and will be recognized as future earnings, underscoring the strength of its subscription model.
Strategic Imperative: AI as a Collaborative Partner, Not a Replacement
A key differentiator for Figma is its thoughtful approach to generative AI, which is central to its growth strategy. Unlike tools that aim to automate designers out of the process, Figma is integrating AI as a "collaborator" to enhance human creativity and efficiency.
Strategic Acquisition: The October 2024 acquisition of AI design start-up Weavy (now Figma Weave) combines leading AI models with professional editing tools, aiming to streamline complex workflows.
Proprietary Tool Adoption: The company’s native AI feature, Figma Make, is seeing rapid adoption, with 30% of customers contributing $100,000+ in ARR using it weekly. This indicates that AI capabilities are driving engagement and value for its most important clients.
Future-Oriented Investment: As CFO Praveer Melwani stated, the company is "deepen investments... to build for the AI native workflows of the future." This positions Figma to lead the next evolution of design tools.
Navigating the Valuation & Profitability Conundrum
The primary concerns weighing on the stock are its path to consistent profitability and its valuation recalibration.
Understanding the Q3 Loss: The company reported a net loss of $1.1 billion in Q3, a figure that is largely attributable to one-time, IPO-related stock-based compensation expenses. This masks the underlying operating performance. The previous quarter (Q2) demonstrated profitability with net income of $28.2 million, proving the business model can generate earnings absent one-time charges.
Valuation Rationalization: In the absence of consistent GAAP profits, the Price-to-Sales (P/S) ratio is a relevant metric. Post-IPO euphoria drove the trailing P/S ratio above 60. This has now contracted sharply to a more reasonable approximately 15. This re-rating reflects both market skepticism and a more grounded assessment of growth sustainability, potentially creating a more attractive entry point for long-term investors.
Technical Perspective: Defining the Risk-Reward Framework
The stock's severe decline from its highs establishes clear technical levels that can help frame the investment risk.
Critical Support Zone: The share price is now testing a multi-tiered support area defined by the $12, $16, and $18 levels. A sustained hold above this zone, particularly following a positive catalyst like a return to profitability, would be a technically constructive sign.
Upside Targets: On a rebound, initial and secondary take-profit projections are set at $30 and $40, respectively. A move toward $40 would represent a significant recovery while still valuing the company well below its prior peak, aligning with a scenario of renewed growth confidence.
Conclusion: A High-Potential, High-Vigilance Opportunity
Figma presents a classic growth-investing dilemma: a company with undeniable operational strength, a leading product, and a massive market opportunity, yet facing the challenges of public market scrutiny and the need to translate growth into consistent profits.
The Bull Case Summary: Investors bullish on Figma argue that the current price discounts the exceptional quality of the business. They see:
A best-in-class SaaS platform with stellar retention metrics.
A prudent, forward-looking AI strategy that enhances its moat.
A valuation that has corrected from speculative levels to one that more reasonably prices its growth trajectory.
A strong balance sheet providing ample runway to invest through cycles.
Key Risks to Monitor: Bears would highlight the competitive threat from Adobe and others, the uncertainty around future profitability timelines, and the potential for growth rates to decelerate further as the company scales.
For investors with a higher risk tolerance and a long-term horizon, the post-IPO sell-off may have created an attractive entry point to own a category-defining software leader. The upcoming quarters will be critical, focusing on the company's ability to maintain its growth velocity, demonstrate a clear path to recurring profitability, and justify its strategic investments in AI. The convergence of strong fundamentals and a reset valuation makes Figma a stock worthy of close examination.

GOLD H1 | Pullback Resistance AheadBased on the H1 chart analysis, we could see the price rise to our sell entry level at 5,180.00, which is a pullback resistance that aligns with the 78.6% Fibonacci projection and also slightly below the 127.2% Fibonacci extension.
Our stop loss is set at 5,336..28, which is a pullback resistance that aligns with the 100% Fibonacci projection.
Our take profit is set at 4,889.78, which is a pullback support.
High Risk Investment Warning
Stratos Markets Limited fxcm.com Stratos Europe Ltd fxcm.com
CFDs are complex instruments and come with a high risk of losing money rapidly due to leverage. 69% of retail investor accounts lose money when trading CFDs with this provider. You should consider whether you understand how CFDs work and whether you can afford to take the high risk of losing your money.
Stratos Global LLC fxcm.com Losses can exceed deposits.
Please be advised that the information presented on TradingView is provided to FXCM (‘Company’, ‘we’) by a third-party provider (‘TFA Global Pte Ltd’). Please be reminded that you are solely responsible for the trading decisions on your account. Any information and/or content is intended entirely for research, educational and informational purposes only and does not constitute investment or consultation advice or investment strategy. The information is not tailored to the investment needs of any specific person and therefore does not involve a consideration of any of the investment objectives, financial situation or needs of any viewer that may receive it. Past performance is not a reliable indicator of future results. Actual results may differ materially from those anticipated in forward-looking or past performance statements. We assume no liability as to the accuracy or completeness of any of the information and/or content provided herein and the Company cannot be held responsible for any omission, mistake nor for any loss or damage including without limitation to any loss of profit which may arise from reliance on any information supplied by TFA Global Pte Ltd.
Stratos Trading Pty. Limited fxcm.com
Trading FX/CFDs carries significant risks. FXCM AU (AFSL 309763), please read the Financial Services Guide, Product Disclosure Statement, Target Market Determination and Terms of Business at fxcm.com

Expedia Q4 2025 EarningsExpedia Q4 2025 Earnings Preview: A Critical Test Amid Elevated Expectations
Expedia Group (EXPE) is poised to release its financial results for the quarter ended December 2025 on February 12th, offering a pivotal look at the online travel giant's performance during the crucial year-end travel period. The market is anticipating a report of robust year-over-year earnings growth, but recent estimate revisions and technical indicators suggest the report will be a nuanced catalyst. The primary question for investors is whether strong fundamentals can override shifting analyst sentiment and a complex chart pattern.
The Consensus View: Solid Growth Amid a Normalizing Travel Landscape
Wall Street's baseline expectations, as compiled by Zacks Investment Research, paint a picture of continued financial momentum:
Earnings Per Share (EPS): The consensus estimate stands at $3.37, which would represent a significant 41% increase compared to the same quarter last year.
Revenue: Analysts project revenue of $3.4 billion, implying a 6.9% year-over-year growth.
This anticipated growth reflects a travel industry that has moved beyond the pure "revenge travel" surge into a more stable, normalized expansion phase, where EXPE's scale and diversified brand portfolio (including Vrbo, Hotels.com, and its own B2B solutions) are expected to drive gains.
The Nuance: A Notable Shift in Analyst Sentiment
Beneath the headline growth figures lies a critical trend that investors must weigh: significant downward revisions to estimates.
Over the past 30 days, the consensus EPS estimate has been revised lower by 11.87%. This collective reassessment by covering analysts may indicate emerging concerns about consumer travel spending elasticity, competitive pressures, or operational costs as the quarter progressed.
This creates a dynamic where beating the lowered consensus may be easier, but the stock's reaction will hinge on whether results can meet or exceed the original, higher expectations held by the market just a month prior.
The Bullish Signal: Positive Earnings ESP and a History of Beats
Despite the downward revisions, a key quantitative model suggests potential for an upside surprise.
The Zacks Earnings ESP (Expected Surprise Prediction) for Expedia is currently +6.57%. This positive reading indicates that the "Most Accurate Estimate"—a more recent and refined version of the consensus—is higher than the published consensus figure.
Historical data shows that stocks with a positive Earnings ESP, particularly when combined with a favorable Zacks Rank, beat estimates nearly 70% of the time.
Expedia's recent track record supports this optimism: it surpassed EPS estimates in three of the last four quarters, including a +4.99% surprise last quarter.
Technical Perspective: Defining Key Support and Resistance
The stock's price action sets crucial levels that will frame the post-earnings move.
Support Zone: Based on key Fibonacci retracement levels, the stock has a layered support zone between approximately $196 and $237. Specifically:
The 0.618 Fibonacci level at ~$196.42 represents a deeper, stronger support.
The 0.5 level at ~$216.93 and the 0.382 level at ~$237.43 provide interim support tiers. A hold above this zone would be viewed as technically healthy.
Price Target & Resistance: The stated bullish price target is $280. For this target to become actionable, the stock must first reclaim and sustain momentum above its recent highs, using a positive earnings report as a potential springboard.
Bottom Line: Factors Beyond the EPS Number
While the earnings beat or miss will trigger the initial reaction, savvy investors will focus on several other factors during the earnings call that will determine the sustainability of any stock move:
Gross Booking Value (GBV) & Growth Metrics: Top-line booking growth is a more fundamental indicator of demand than revenue alone.
Vrbo's Performance: The recovery and market share trajectory of its vacation rental segment relative to Airbnb.
Margin Dynamics: Guidance on profitability amidst investments in technology, marketing, and its "One Key" loyalty program unification.
2026 Outlook: Management's commentary on forward-looking travel demand, corporate travel trends (via Egencia), and any impact from macroeconomic uncertainties.
Conclusion: Expedia enters its earnings release as a story of conflicting signals: strong headline growth expectations juxtaposed with notably lowered estimates, a quantitative model forecasting a beat, and a stock price trading within a defined technical range. A result that meets the lowered EPS consensus but shows strength in underlying bookings and confident guidance could validate the bullish $280 target by demonstrating durable earnings power. Conversely, a miss or weak outlook could see the stock test the lower bounds of its Fibonacci support zone. The report will ultimately serve as a key test of whether Expedia's operational execution can triumph over a cautious shift in market sentiment.

UKOIL H1 | Bullish Momentum BuildingBased on the H1 chart analysis, we could see the price fall to our buy entry level at 68.29, which is a pullback support that aligns with the 50% Fibonacci retracement.
Our stop loss is set at 67.28, which is a pullback support.
Our take profit is set at 69.90, which is a swing high resistance.
High Risk Investment Warning
Stratos Markets Limited fxcm.com Stratos Europe Ltd fxcm.com
CFDs are complex instruments and come with a high risk of losing money rapidly due to leverage. 69% of retail investor accounts lose money when trading CFDs with this provider. You should consider whether you understand how CFDs work and whether you can afford to take the high risk of losing your money.
Stratos Global LLC fxcm.com Losses can exceed deposits.
Please be advised that the information presented on TradingView is provided to FXCM (‘Company’, ‘we’) by a third-party provider (‘TFA Global Pte Ltd’). Please be reminded that you are solely responsible for the trading decisions on your account. Any information and/or content is intended entirely for research, educational and informational purposes only and does not constitute investment or consultation advice or investment strategy. The information is not tailored to the investment needs of any specific person and therefore does not involve a consideration of any of the investment objectives, financial situation or needs of any viewer that may receive it. Past performance is not a reliable indicator of future results. Actual results may differ materially from those anticipated in forward-looking or past performance statements. We assume no liability as to the accuracy or completeness of any of the information and/or content provided herein and the Company cannot be held responsible for any omission, mistake nor for any loss or damage including without limitation to any loss of profit which may arise from reliance on any information supplied by TFA Global Pte Ltd.
Stratos Trading Pty. Limited fxcm.com
Trading FX/CFDs carries significant risks. FXCM AU (AFSL 309763), please read the Financial Services Guide, Product Disclosure Statement, Target Market Determination and Terms of Business at fxcm.com

NAS100 H4 | Bullish RiseThe price is falling towards our buy entry level at 25,126.66, which is an overlap support.
Our stop loss is set at 24,342.56, which is a swing low support.
Our take profit is set at 25,843.81, which is a pullback resistance.
High Risk Investment Warning
Stratos Markets Limited fxcm.com Stratos Europe Ltd fxcm.com
CFDs are complex instruments and come with a high risk of losing money rapidly due to leverage. 69% of retail investor accounts lose money when trading CFDs with this provider. You should consider whether you understand how CFDs work and whether you can afford to take the high risk of losing your money.
Stratos Global LLC fxcm.com Losses can exceed deposits.
Please be advised that the information presented on TradingView is provided to FXCM (‘Company’, ‘we’) by a third-party provider (‘TFA Global Pte Ltd’). Please be reminded that you are solely responsible for the trading decisions on your account. Any information and/or content is intended entirely for research, educational and informational purposes only and does not constitute investment or consultation advice or investment strategy. The information is not tailored to the investment needs of any specific person and therefore does not involve a consideration of any of the investment objectives, financial situation or needs of any viewer that may receive it. Past performance is not a reliable indicator of future results. Actual results may differ materially from those anticipated in forward-looking or past performance statements. We assume no liability as to the accuracy or completeness of any of the information and/or content provided herein and the Company cannot be held responsible for any omission, mistake nor for any loss or damage including without limitation to any loss of profit which may arise from reliance on any information supplied by TFA Global Pte Ltd.
Stratos Trading Pty. Limited fxcm.com
Trading FX/CFDs carries significant risks. FXCM AU (AFSL 309763), please read the Financial Services Guide, Product Disclosure Statement, Target Market Determination and Terms of Business at fxcm.com

The updated sp 500 Be ready first stop 6520The chat posted are My view of the EW structure and its formation and to where I see us in a very short time > I am 75 % long Very deep in the money PUTS I can allow a print of 7005 to 7031 But I having doubts as We are in the cycle peak . Best of trades WAVETIMER

USDJPY H4 | Bullish Bounce Off The price is falling towards our buy entry level at 154.61, which is an overlap support that is slightly below the 50% Fibonacci retracement.
Our stop loss is set at 153.56, which is a pullback support that aligns with the 78.6% Fibonacci retracement.
Our take profit is set at 157.58, which is an overlap resistance.
High Risk Investment Warning
Stratos Markets Limited fxcm.com Stratos Europe Ltd fxcm.com
CFDs are complex instruments and come with a high risk of losing money rapidly due to leverage. 69% of retail investor accounts lose money when trading CFDs with this provider. You should consider whether you understand how CFDs work and whether you can afford to take the high risk of losing your money.
Stratos Global LLC fxcm.com Losses can exceed deposits.
Please be advised that the information presented on TradingView is provided to FXCM (‘Company’, ‘we’) by a third-party provider (‘TFA Global Pte Ltd’). Please be reminded that you are solely responsible for the trading decisions on your account. Any information and/or content is intended entirely for research, educational and informational purposes only and does not constitute investment or consultation advice or investment strategy. The information is not tailored to the investment needs of any specific person and therefore does not involve a consideration of any of the investment objectives, financial situation or needs of any viewer that may receive it. Past performance is not a reliable indicator of future results. Actual results may differ materially from those anticipated in forward-looking or past performance statements. We assume no liability as to the accuracy or completeness of any of the information and/or content provided herein and the Company cannot be held responsible for any omission, mistake nor for any loss or damage including without limitation to any loss of profit which may arise from reliance on any information supplied by TFA Global Pte Ltd.
Stratos Trading Pty. Limited fxcm.com
Trading FX/CFDs carries significant risks. FXCM AU (AFSL 309763), please read the Financial Services Guide, Product Disclosure Statement, Target Market Determination and Terms of Business at fxcm.com

Silver XAGUSD directional bias for todaySilver top layer ascending trendline is giving 140.321-141.87 ,if buyers come to that zone look for sell on 15min.
the probability that silver price will retest the current all time high in the zone of 121k-120k-119k is 80%,if price comes to this zone look for sell on 15min and 3min chart.
the trade impetus will be on the double confluence where a horizontal trendline meets ascending trendline breakout on 4hr chart. If you apply the break and retest rule you are right on technical but could be wrong on market sentiment and fundamental shift.
key supply roof will be on 103.761-105.044
key supply roof will be 92.375-91.5739
key supply roof will be 84.0378-86.642
note that since the time frame is 4hr break and close is a buy floor with confirmation on 15min and 3min.
what is silver xagusd ??
Silver is a chemical element with the symbol Ag and atomic number 47. It's a soft, white, lustrous transition metal prized for its exceptional electrical and thermal conductivity.
Physical Properties
Silver boasts the highest electrical conductivity, thermal conductivity, and reflectivity among metals, making it highly malleable and ductile. It forms a face-centered cubic crystal structure and appears in nature as native silver or in minerals like argentite.
Occurrence and Production
Found in Earth's crust at low concentrations, silver occurs as a free element, alloyed with gold, or in ores; most is mined as a byproduct of copper, gold, lead, and zinc refining in countries like Peru, Mexico, and Canada. Recycling from electronics and jewelry also contributes significantly.
Key Uses
Silver's properties drive its applications in jewelry, coins, electronics (e.g., circuits and contacts), mirrors, and as an antimicrobial agent. It's alloyed for durability in solders, bearings, and tableware.
Banks are increasingly accumulating silver as a strategic asset amid rising prices and market dynamics. Central banks and major institutions like JP Morgan are leading this trend due to diversification needs and supply constraints.
Central Bank Motivations
Emerging market central banks, such as those in Russia, India, and others, are buying silver to diversify reserves, reduce dollar dependency, and hedge against sanctions or financial restrictions. This marks a shift after decades of negligible silver holdings, treating it as both a monetary and industrial asset.
Commercial Bank Strategies
JP Morgan has amassed massive physical silver stockpiles (estimates up to 750 million ounces) at low prices through long-term accumulation programs since 2018, profiting from price suppression via shorts while positioning for supply shortages. This exploits deficits from industrial demand in solar, EVs, AI, and nuclear energy.
Market Drivers
Persistent silver supply deficits, de-dollarization, Chinese buying/export restrictions, and safe-haven demand amid dollar weakness fuel accumulation, with prices surging past 115$/oz in early 2026. Banks anticipate structural tightness, potentially rewiring silver's valuation from commodity to reserve asset.
silver xagusd relationship with US10Y DOLLAR index
Silver (XAGUSD) exhibits strong inverse relationships with both the US 10-Year Treasury yield (US10Y) and the Dollar Index (DXY). Falling yields and a weaker dollar typically boost silver prices as a non-yielding safe-haven asset.
XAGUSD Versus US10Y Yield
Silver prices move inversely to US10Y yields due to opportunity cost: higher yields make interest-bearing assets like bonds more attractive than non-yielding silver. Correlation coefficients often exceed -0.85, with silver rallying during yield declines (e.g., Fed easing expectations).
XAGUSD Versus DXY
XAGUSD and DXY share an inverse correlation, as a stronger dollar raises silver's price for non-US buyers by curbing demand. Weaker DXY (e.g., from rate cuts) enhances affordability and silver's appeal amid inflation or de-dollarization.
Interconnections
US10Y and DXY often align positively—rising yields support dollar strength via higher rates—but both pressure silver downward. Real yields (nominal minus inflation) amplify this; falling real yields since 2025 have propelled silver surges
#silver #xagusd

Falling towards overlap support?US Dollar Index (DXY) is falling towards the pivot, which has been identified as an overlap support that aligns with the 61.8% Fibonacci retracement.
Pivot: 96.43
1st Support: 96.05
1st Resistance: 97.23
Disclaimer:
The opinions given above constitute general market commentary and do not constitute the opinion or advice of IC Markets or any form of personal or investment advice.
Any opinions, news, research, analyses, prices, other information, or links to third-party sites contained on this website are provided on an "as-is" basis, are intended to be informative only, and are not advice, a recommendation, research, a record of our trading prices, an offer of, or solicitation for, a transaction in any financial instrument and thus should not be treated as such. The information provided does not involve any specific investment objectives, financial situation, or needs of any specific person who may receive it. Please be aware that past performance is not a reliable indicator of future performance and/or results. Past performance or forward-looking scenarios based upon the reasonable beliefs of the third-party provider are not a guarantee of future performance. Actual results may differ materially from those anticipated in forward-looking or past performance statements. IC Markets makes no representation or warranty and assumes no liability as to the accuracy or completeness of the information provided, nor any loss arising from any investment based on a recommendation, forecast, or any information supplied by any third party

Bearish reversal off key resistance?Gold (XAU/USD) is reacting off the pivot, which is an overlap resistance that aligns with the 61.8% Fibonacci retracement and could drop to the 1st support.
Pivot: 5,090.85
1st Support: 4,687.93
1st Resistance: 5,445.03
Disclaimer:
The opinions given above constitute general market commentary and do not constitute the opinion or advice of IC Markets or any form of personal or investment advice.
Any opinions, news, research, analyses, prices, other information, or links to third-party sites contained on this website are provided on an "as-is" basis, are intended to be informative only, and are not advice, a recommendation, research, a record of our trading prices, an offer of, or solicitation for, a transaction in any financial instrument and thus should not be treated as such. The information provided does not involve any specific investment objectives, financial situation, or needs of any specific person who may receive it. Please be aware that past performance is not a reliable indicator of future performance and/or results. Past performance or forward-looking scenarios based upon the reasonable beliefs of the third-party provider are not a guarantee of future performance. Actual results may differ materially from those anticipated in forward-looking or past performance statements. IC Markets makes no representation or warranty and assumes no liability as to the accuracy or completeness of the information provided, nor any loss arising from any investment based on a recommendation, forecast, or any information supplied by any third party.

XAUUSD | Perfect day! what does tomorrow bring? Whats going on Gold Gang ... a great day was had on the gold chart today catching gold buys up before the breakout using the 5m timeframe. Its important to use the smaller time frames to reduce that drawdown as these moves are insane! SNIPER ENTRIES ONLY lolol
Last nights analysis played out with the break and retest above the high but came late in the day, which is common in todays market. Myself and the TG group got the buy early afternoon and rode it up for a nice profit.
If we can get a close on the 1h or 4h above 5085 then its pretty clear up to the sell zone. if we reject here and start making LL and LH .. id switch to bearish and look at sells for the rest of the week.
Buys at 4897 still valid too. I will get a precise entry around the time. follow the TG
Thanks for your likes and boosts on the last post. I havent posted on here for a year so im happy to be back. Spread the word!
Tommy

IONQ Trend Alert: Institutional Puts Target Multi-Month SupportIONQ QuantSignals V4 Weekly 2026-02-09
Signal: PUTS
Alpha Score: 72 (Quant Synthesis)
Conviction: Moderate
🔹 Core Thesis
Extreme institutional Put positioning (2.1 P/C Ratio) and Katy AI’s bearish vector toward $32.35 override oversold technicals.
Suggests a final weekly flush to test multi-month support.
🔹 Tactical Observation
Trading well below 50-day ($47.08) & 200-day ($47.26) MAs.
RSI: 25.7 → oversold, potential bounce, but low buyer volume.
Weekly VWAP: $34.62 → bearish directional magnet.
Put/Call Ratio: 2.1 → heavy institutional downside positioning.
Put Open Interest (37,961) vs Call OI (18,079) → “whale bets” on weekly close below $35.
🔹 Strategy
Buy PUTS
Instrument: $35.0 PUT
Expiry: Feb 13, 2026
Entry Zone: $1.34 – $1.45 (premium price)
Target 1: $1.80 (+25%) → scale 50%
Target 2: $2.30 (+60%+) → hold remainder
Stop Loss: $1.05 (-25%) → move to breakeven at $1.40 after scaling Target 1
Moderate risk due to potential technical bounce from oversold conditions.

DDOG Earnings: Polymarket Override Signals Bullish BreakoutDDOG QuantSignals V4 Earning 2026-02-09
⚡ QS V4 ELITE: DDOG (Earnings)
Time Horizon: Binary Event / Short-term (Exit at next market open)
Risk Grade: 🚨 EXTREME (Binary Event)
🔹 Core Thesis
Despite technical weakness and Katy AI's cautious bearishness, 88% Polymarket "Beat" probability suggests institutional expectations are high for an EPS surprise.
Likely triggers a momentum squeeze above the 50-day MA.
Katy AI Bias: Bearish | Probability: 61% | Projected Move: -1.66%
Polymarket Override: Bullish due to extreme beat expectations.
🔹 Tactical Observation
RSI: Not specified (likely oversold/weak technically)
MACD & technicals show caution, but fundamental expectations dominate.
Options flow suggests a high-probability short-term bullish event.
Market pricing anticipates a $15.48 move, nearly double the historical average of $8.45.
🔹 Strategy (Options)
Bull Call Spread (Vertical Debit Spread)
Buy: $115 Call
Sell: $125 Call
Expiry: 2026-02-13
Entry Price: $4.20 debit
Max Potential: $5.80 (+38%)
Max Risk: $4.20 (Premium Paid)
R:R: 1:1.38
Execution Notes:
Exit 100% at market open on 2026-02-10.
Do not hold through post-earnings volatility crush.
🔹 Risk / Thesis Error
If DDOG beats EPS but guides lower on revenue or AI progress → stock may follow Katy AI’s bearish vector (~$105).
Binary event risk is EXTREME.
Strategy mitigates risk with defined spreads and strict exit protocol.

OSCR Earnings Alert — Market Pricing in a Sell-the-News ReactionOSCR QuantSignals V4 Earning 2026-02-09
Signal: BEARISH
Alpha Score: 62 (Quant Synthesis)
Expected Move: ±$2.02 (~15.9%)
IV Rank: 88% → Elevated volatility
Alignment: Discordant
Core Thesis:
Despite strong top-line growth, OSCR is undergoing a severe technical breakdown.
Katy AI’s bearish vector suggests the market may already be pricing in a disappointment — setting up a potential “sell-the-news” reaction if expectations fail to impress.
🧠 Intelligence Snapshot
Earnings Bias: Bearish
Probability: 59%
Projected Move: -1.34%
Key Signals
RSI: 16.1 → Extremely oversold (short-covering risk exists)
MACD: Firmly bearish
Trading well below 50D ($15.67) and 200D ($16.43)
Large $14 Call Wall acting as overhead resistance
Institutional tone suggests lowered whisper expectations
👉 When a stock stays weak into earnings, it often signals distribution rather than opportunity.
