BTR PRO Delivers Again – +50 Points INTRADAY! 27 Jan 2026🔥 BTR PRO DELIVERS AGAIN – +50 POINTS INTRADAY! 🔥
📅 Date: 27 Jan 2026
Stock: BSE LTD
Indicator: BTR PRO Price Action (SL + Targets)
✅ BUY ENTRY: 2705
🎯 T1 HIT
🎯 T2 HIT
🎯 T3 HIT
📈 INTRADAY EXIT: 2755
💰 PROFIT: +50 POINTS CLEAN MOVE
No noise.
No emotions.
Pure Price Action + Rule-Based Targets.
📌 Intraday traders booked full 50 points
📌 Swing targets worked perfectly
👉 Follow BTR PRO
👉 Trade with structure, not hope
#BTRPRO #50Points #IntradayTrading #BSELTD #PriceAction #TradingView #NoEmotionTrading #ConsistencyWins 💪📊
Harmonic Patterns

$BNB (1H) LAST BUYING ZONE IN PLAY!!!BINANCE:BNBUSDT is trading around $879 and is currently pulling back into a strong demand and entry zone at $873. As long as the price holds above $870, the bullish setup remains valid.
Looking ahead, the $874.47 - $871.71 zone remains the key psychological and structural Demand zone. A clean acceptance above this range is required to open the path toward $888. The bullish setup is invalidated on a sustained breakdown below $870.
On the upside, $880 is the first target where some resistance is expected. If buyers push through with good momentum, the next upside level to watch is $888, which aligns with the previous high and the selling zone.

LCIWait for at least one of these on 2H or 1H:
Bearish engulfing at 290–295
RSI divergence
Volume spike on red candle
Breakdown below 286

GOLD XAUUSD GOLD 5100 -5120 ZONE IS GIVING US REJECTION WHICH IF IS BROKEN THEN 5200-5178 WILL BE MY WATCH ZONE
5050-5045 MY NEXT DEMAND FLOOR .
FOLLOW THE STRUCTURE
KEY DEMAND FLOOR 4965-4960
KEY DEMAND FLOOR 4847-4840.
OR FOLLOW THE STRUCTURE.
STRUCTURE NEVER LIES.
Geopolitical Tensions
US President Donald Trump's insistence on acquiring Greenland, including threats of force and tariffs on opposing European nations, has sparked US-Europe friction. French President Macron's rebukes and potential suspension of US-EU trade deals have weakened the dollar, boosting gold's appeal to foreign buyers.
Economic Factors
A softer US dollar makes gold cheaper globally, while expectations of steady Federal Reserve rates—despite labor improvements—favor non-yielding assets like gold. Central banks in China and India continue aggressive gold buying, adding structural support.
Future Outlook
Prices may climb toward $5200 zone if tensions persist and the dollar stays weak, though stronger US data could cap gains.
WHAT IS GOLD ???
Gold (Au) is a chemical element and dense, malleable transition metal prized for its lustrous yellow hue, exceptional conductivity, and resistance to corrosion.
History as Store of Value
Gold has served as a store of value for over 6,000 years, from ancient Egyptian tombs (c. 4000 BCE) symbolizing immortality to Lydian coins (600 BCE) enabling standardized trade across empires like Rome (aureus) and Byzantium (solidus, stable 700+ years). The 19th-century gold standard anchored global currencies until 20th-century abandonments, yet gold retains purchasing power
Tier 1 Status Clarification
Gold classifies as a Tier 1 asset under Basel III banking rules , with 0% risk weighting for physical bullion, equivalent to cash for capital reserves, enhancing bank balance sheets amid fiat volatility. This elevates it from prior Tier 3 status, affirming its role as "money again.
HOW DOES THE DOLLAR INDEX AFFECT THE PRICE ACTION AND DIRECTIONAL BIAS ??
The US Dollar Index (DXY) exhibits a strong inverse relationship with global gold prices, where a stronger dollar typically depresses gold values and a weaker dollar boosts them.
Core Mechanism
Gold trades in US dollars worldwide, so dollar strength raises gold's cost for non-US buyers, curbing demand and lowering prices. A weaker dollar reduces this barrier, making gold cheaper and spurring purchases from international investors.
Correlation Strength
Historical data shows a negative correlation coefficient of -0.40 to -0.80, meaning 40-80% of gold's movements often align inversely with DXY changes. Interest rate differentials amplify this: Fed hikes strengthen the dollar and hurt non-yielding gold, while cuts weaken it and favor gold.
Influencing Factors
Geopolitical risks or inflation can override the link temporarily, but dollar dynamics remain the primary driver in most cycles. For instance, recent dollar weakness from de-dollarization trends has fueled gold rallies.
the brics nation are busing buying GOLD.this is the year of GOLD as the new money backed by physical GOLD ,this is why all BRICS CENTRAL BANKS are stocking the yellow bullion.
#GOLD #XAUUSD

Gold Selling Plan!Short-term gold selling plan
Sell: 5085 - 5095
TP: 4095 - 5005
SL: 5120
Be sure to set the stop-loss level. Also, be mindful of your financial security.

Will $SPX FLY??MEXC:SPXUSDT is currently trading around $0.377–$0.379, consolidating after a strong rebound from the Daily Demand zone. Price Will now take a pullback into a well-defined internal buying breaker block, suggesting a potential continuation to the upside if this level holds.
Key Levels: Daily Demand Zone: $0.3631 – $0.3541 (major higher-timeframe support)
Internal Buying Breaker Block: $0.3760 – $0.3730
Entry: $0.3748
Upside Targets: Target 1: $0.3850
Target 2: $0.3948
Invalidation / Stop Loss: $0.3698
Market Structure: A clear Break of Structure (BOS) followed by a bullish internal structure shift indicates that buyers have regained control after an extended bearish move.
Directional Bias Bullish, as long as price holds above $0.3730. A sustained hold above the breaker block increases the probability of continuation toward the marked targets.

Bitcoin Targeting 84.450 - watching for point D CompletionOn the Bitcoin daily chart, i am observing a very intersting harmonic pattern that is gaining more technical significance every day. Everything points to a developing GARTLEY FORMATION, where point B is already clearly visible, and following the BC bounce, the market is currently heading towards completing the entire structure. My key decision-makin area is the around 84.450 level, which is where point D of the formation sits. I have identified this zone based on significant reference points, such as the lower shadows from early December and the lows from December 18th. I'm now waiting for this setup to fully complete and I intend to trade it once the price precisely reaches that designated level.

TheGrove | USDJPY Buy | Idea Trading AnalysisUSDJPY is moving in an ascending channel.. Price is trading inside a bullish ascending channel after a strong break of structure.
Previous resistance has flipped into demand, confirming bullish continuation.
We expect a decline in the channel after testing the current level which suggests that the price will continue to rise..
Hello Traders, here is the full analysis.
I think we can soon see more fall from this range! GOOD LUCK! Great BUY opportunity USDJPY
I still did my best and this is the most likely count for me at the moment.
-------------------
Traders, if you liked this idea or if you have your own opinion about it, write in the comments. I will be glad 🤝

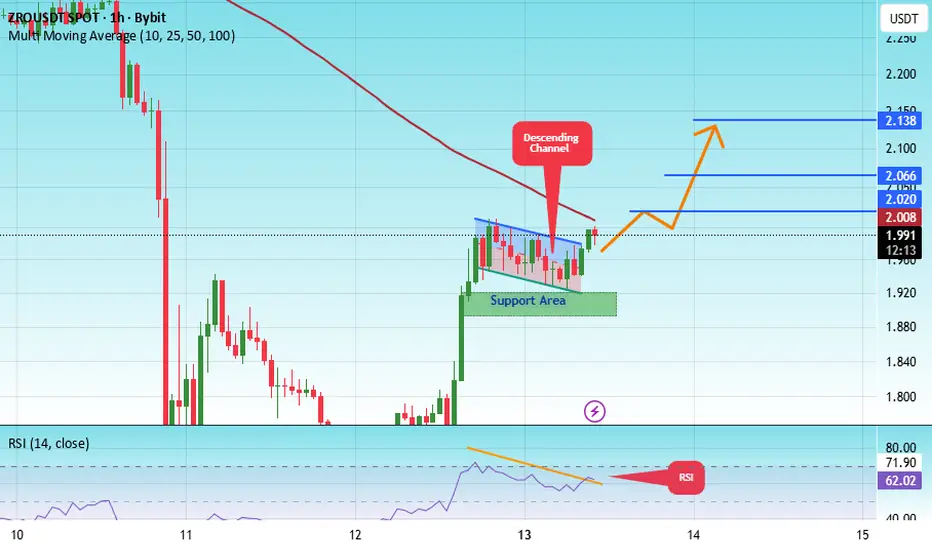
#ZRO/USDT Reversal Potential Breakout & Fibonacci Retest in Fo#ZRO
The price is moving within a descending channel on the 1-hour frame, adhering well to it, and is heading for a strong breakout and retest.
We have a bearish trend on the RSI indicator that is about to be broken and retested, which supports the upward breakout.
There is a major support area in green at 1.90, representing a strong support point.
We are heading for consolidation above the 100 moving average.
Entry price: 1.99
First target: 2.00
Second target: 2.06
Third target: 2.13
Don't forget a simple matter: capital management.
When you reach the first target, save some money and then change your stop-loss order to an entry order.
For inquiries, please leave a comment.
Thank you.
TheGrove | GBPUSD BUY | Idea Trading AnalysisGBPUSD is moving in an UP and broke Support line
The chart broke through the dynamic Support line and we expect a decline in the channel after testing the current level which suggests that the price will continue to rise
We expect a decline in the channel after testing the current level
Hello Traders, here is the full analysis.
I think we can soon see more fall from this range! GOOD LUCK! Great BUY opportunity GBPUSD
I still did my best and this is the most likely count for me at the moment.
-------------------
Traders, if you liked this idea or if you have your own opinion about it, write in the comments. I will be glad ⚜️
GOLD BUY TO NEW HIGHS!!!!!!!!XAUUSD have been on a bullish moves and price is making higher highs today am looking for a buy from this poi and holding till price create new highs again.....

XAUUSD weekly (26.01 - 30.01)Market Formation:
Gold continues to hit new all-time highs day after day, with daily moves of 2-5% becoming standard intraday action. The uptrend since the end of December has already added 20% to the asset's price and shows no signs of slowing down yet.
Projected Scenario:
The main direction remains towards renewing historical highs. After a strong move and holding above 5000, the asset has formed a new consolidation range of 5030-5100, within which volume accumulation is likely to occur.
News Background:
The main driver of growth remains the geopolitical situation, which continues to heat up:
Middle East: Tehran has officially announced the start of uranium enrichment to weapons-grade levels and deployed military boats to the Strait of Hormuz, threatening to cut off 20% of global oil supplies in response to new Western sanctions.
Greenland Crisis: The European Union categorically rejected the US ultimatum. In response, Washington announced a naval blockade of disputed territories in the Arctic, effectively freezing transatlantic relations.
Economic Calendar:
Wednesday, January 28: Fed Interest Rate Decision (FOMC). "Dovish" rhetoric is expected.
Friday, January 30: Core Personal Consumption Expenditures (Core PCE) Price Index.

GOLD XAUUSD GOLD XAUUSD CURRENT PRICE 5085$
GOLD REJECTING 5100-5096 ZONE
KEY DEMAND 5000-4997 ZONE
FOLLOW THE STRUCTURE,STRUCTURE NEVER LIES.
KEY DEMAND FLOOR 4965-4960
KEY DEMAND FLOOR 4847-4840.
OR FOLLOW THE STRUCTURE.
STRUCTURE NEVER LIES
Geopolitical Tensions
US President Donald Trump's insistence on acquiring Greenland, including threats of force and tariffs on opposing European nations, has sparked US-Europe friction. French President Macron's rebukes and potential suspension of US-EU trade deals have weakened the dollar, boosting gold's appeal to foreign buyers.
Economic Factors
A softer US dollar makes gold cheaper globally, while expectations of steady Federal Reserve rates—despite labor improvements—favor non-yielding assets like gold. Central banks in China and India continue aggressive gold buying, adding structural support.
Future Outlook
Prices may climb towards 5200 zone if tensions persist and the dollar stays weak, though stronger US data could cap gains.watchdollar rise on demand .
the dollar index is holding daily support at 97.935$ and during newyork today buy candle kept yesterday demand floor and we are seeing GOLD price into systematic correction from 4890-4880 zone .if they insist on daily buy floor then we will be watching 4900 which is a pathway to 5000-524k and more advanced buying based on the trendangle strategy.
WHAT IS GOLD ???
Gold (Au) is a chemical element and dense, malleable transition metal prized for its lustrous yellow hue, exceptional conductivity, and resistance to corrosion.
History as Store of Value
Gold has served as a store of value for over 6,000 years, from ancient Egyptian tombs (c. 4000 BCE) symbolizing immortality to Lydian coins (600 BCE) enabling standardized trade across empires like Rome (aureus) and Byzantium (solidus, stable 700+ years). The 19th-century gold standard anchored global currencies until 20th-century abandonments, yet gold retains purchasing power
Tier 1 Status Clarification
Gold classifies as a Tier 1 asset under Basel III banking rules , with 0% risk weighting for physical bullion, equivalent to cash for capital reserves, enhancing bank balance sheets amid fiat volatility. This elevates it from prior Tier 3 status, affirming its role as "money again.
HOW DOES THE DOLLAR INDEX AFFECT THE PRICE ACTION AND DIRECTIONAL BIAS ??
The US Dollar Index (DXY) exhibits a strong inverse relationship with global gold prices, where a stronger dollar typically depresses gold values and a weaker dollar boosts them.
Core Mechanism
Gold trades in US dollars worldwide, so dollar strength raises gold's cost for non-US buyers, curbing demand and lowering prices. A weaker dollar reduces this barrier, making gold cheaper and spurring purchases from international investors.
Correlation Strength
Historical data shows a negative correlation coefficient of -0.40 to -0.80, meaning 40-80% of gold's movements often align inversely with DXY changes. Interest rate differentials amplify this: Fed hikes strengthen the dollar and hurt non-yielding gold, while cuts weaken it and favor gold.
Influencing Factors
Geopolitical risks or inflation can override the link temporarily, but dollar dynamics remain the primary driver in most cycles. For instance, recent dollar weakness from de-dollarization trends has fueled gold rallies.
the brics nation are busing buying GOLD.this is the year of GOLD as the new money backed by physical GOLD ,this is why all BRICS CENTRAL BANKS are stocking the yellow bullion.
#GOLD #XAUUSD

27.01.26 Daily ForecastPairs on Watch -
FX:GBPJPY
FX:GBPNZD
FX:EURNZD
A short overview of the instruments I am looking at for today, multi-timeframe analysis down to what I will be looking at for an entry. Enjoy!


AGQ projects to $405 SILVER 2X ETFYet to breakout from this W pattern.
What Is the W Pattern?
The W Pattern is a bullish harmonic pattern found on most stock charts at some point in time. Think of the letter “W” and imagine what this pattern might look like. It is characteristic of a bounce and retest of a key support area, commonly referred to as a double-bottom formation.
When this pattern forms on a chart, it usually indicates a trend reversal. Between the two bottoms, there is a level of resistance about halfway between the two tops. As a result, this is key, as it indicates a retest of the bottom support before rising higher into the newly formed uptrend.
Now you see it.
What do you think of this chart pattern and price targets?

USOIL M30 | Bullish Bounce Off Pullback SupportMomentum: Bullish
Price is currently above the ichimoku cloud.
Buy entry: 61.202
- Pullback support
- 61.8% Fib retracement
Stop Loss: 60.900
- Swing low support
Take Profit: 61.660
- Swing high resistance
High Risk Investment Warning
Stratos Markets Limited (fxcm.com/uk), Stratos Europe Ltd (fxcm.com/eu):
CFDs are complex instruments and come with a high risk of losing money rapidly due to leverage. 69% of retail investor accounts lose money when trading CFDs with this provider. You should consider whether you understand how CFDs work and whether you can afford to take the high risk of losing your money.
Stratos Global LLC (fxcm.com/en): Losses can exceed deposits.
Please be advised that the information presented on TradingView is provided to FXCM (‘Company’, ‘we’) by a third-party provider (‘TFA Global Pte Ltd’). Please be reminded that you are solely responsible for the trading decisions on your account. Any information and/or content is intended entirely for research, educational and informational purposes only and does not constitute investment or consultation advice or investment strategy. The information is not tailored to the investment needs of any specific person and therefore does not involve a consideration of any of the investment objectives, financial situation or needs of any viewer that may receive it. Past performance is not a reliable indicator of future results. Actual results may differ materially from those anticipated in forward-looking or past performance statements. We assume no liability as to the accuracy or completeness of any of the information and/or content provided herein and the Company cannot be held responsible for any omission, mistake nor for any loss or damage including without limitation to any loss of profit which may arise from reliance on any information supplied by TFA Global Pte Ltd.
Stratos Trading Pty. Limited (fxcm.com/au):
Trading FX/CFDs carries significant risks. FXCM AU (AFSL 309763), please read the Financial Services Guide, Product Disclosure Statement, Target Market Determination and Terms of Business at fxcm.com/au

Stop!Loss|Market View: EURUSD🙌 Stop!Loss team welcomes you❗️
In this post, we're going to talk about the near-term outlook for the EURUSD currency pair☝️
Potential trade setup:
🔔Entry level: 1.19043
💰TP: 1.19701
⛔️SL: 1.18587
"Market View" - a brief analysis of trading instruments, covering the most important aspects of the FOREX market.
👇 In the comments 👇 you can type the trading instrument you'd like to analyze, and we'll talk about it in our next posts.
💬 Description: The US dollar remains under pressure early this week, and this trend is likely to continue until at least mid-week. Against this backdrop, euro buyers are effectively pushing toward resistance at 1.18960, which will likely lead to an upward breakout toward 1.19 and 1.2. A buy entry is being considered through a breakout.
Thanks for your support 🚀
Profits for all ✅

BTCUSD H1 | Bearish Reaction Off Pullback ResistanceMomentum: Bearish
Price is currently below the ichimoku cloud.
Sell entry: 88,609.51
- Pullback resistance
- 50% Fib retracement
- 100% Fib projection
Stop Loss: 90,503.73
- Swing high resistance
Take Profit: 86,366.00
- Swing low support
High Risk Investment Warning
Stratos Markets Limited (fxcm.com/uk), Stratos Europe Ltd (fxcm.com/eu):
CFDs are complex instruments and come with a high risk of losing money rapidly due to leverage. 69% of retail investor accounts lose money when trading CFDs with this provider. You should consider whether you understand how CFDs work and whether you can afford to take the high risk of losing your money.
Stratos Global LLC (fxcm.com/en): Losses can exceed deposits.
Please be advised that the information presented on TradingView is provided to FXCM (‘Company’, ‘we’) by a third-party provider (‘TFA Global Pte Ltd’). Please be reminded that you are solely responsible for the trading decisions on your account. Any information and/or content is intended entirely for research, educational and informational purposes only and does not constitute investment or consultation advice or investment strategy. The information is not tailored to the investment needs of any specific person and therefore does not involve a consideration of any of the investment objectives, financial situation or needs of any viewer that may receive it. Past performance is not a reliable indicator of future results. Actual results may differ materially from those anticipated in forward-looking or past performance statements. We assume no liability as to the accuracy or completeness of any of the information and/or content provided herein and the Company cannot be held responsible for any omission, mistake nor for any loss or damage including without limitation to any loss of profit which may arise from reliance on any information supplied by TFA Global Pte Ltd.
Stratos Trading Pty. Limited (fxcm.com/au):
Trading FX/CFDs carries significant risks. FXCM AU (AFSL 309763), please read the Financial Services Guide, Product Disclosure Statement, Target Market Determination and Terms of Business at fxcm.com/au

ETHUSD H1 | Bearish Reaction Off Pullback ResistanceMomentum: Bearish
Price is currently below the ichimoku cloud.
Sell entry: 2,908.13
- Pullback resistance
- 50% Fib retracement
- 100% Fib projection
Stop Loss: 2,986.58
- Swing high resistance
Take Profit: 2,800.01
- Swing low support
High Risk Investment Warning
Stratos Markets Limited (fxcm.com/uk), Stratos Europe Ltd (fxcm.com/eu):
CFDs are complex instruments and come with a high risk of losing money rapidly due to leverage. 69% of retail investor accounts lose money when trading CFDs with this provider. You should consider whether you understand how CFDs work and whether you can afford to take the high risk of losing your money.
Stratos Global LLC (fxcm.com/en): Losses can exceed deposits.
Please be advised that the information presented on TradingView is provided to FXCM (‘Company’, ‘we’) by a third-party provider (‘TFA Global Pte Ltd’). Please be reminded that you are solely responsible for the trading decisions on your account. Any information and/or content is intended entirely for research, educational and informational purposes only and does not constitute investment or consultation advice or investment strategy. The information is not tailored to the investment needs of any specific person and therefore does not involve a consideration of any of the investment objectives, financial situation or needs of any viewer that may receive it. Past performance is not a reliable indicator of future results. Actual results may differ materially from those anticipated in forward-looking or past performance statements. We assume no liability as to the accuracy or completeness of any of the information and/or content provided herein and the Company cannot be held responsible for any omission, mistake nor for any loss or damage including without limitation to any loss of profit which may arise from reliance on any information supplied by TFA Global Pte Ltd.
Stratos Trading Pty. Limited (fxcm.com/au):
Trading FX/CFDs carries significant risks. FXCM AU (AFSL 309763), please read the Financial Services Guide, Product Disclosure Statement, Target Market Determination and Terms of Business at fxcm.com/au

EURCHF H4 | Bearish Reaction Off Pullback ResistanceMomentum: Bearish
Price is currently below the ichimoku cloud.
Sell entry: 0.92530
- Pullback resistance
- 61.8% Fib retracement
- Fair value gap
Stop Loss: 0.92986
- Overlap resistance
Take Profit: 0.91913
- Swing low support
High Risk Investment Warning
Stratos Markets Limited (fxcm.com/uk), Stratos Europe Ltd (fxcm.com/eu):
CFDs are complex instruments and come with a high risk of losing money rapidly due to leverage. 69% of retail investor accounts lose money when trading CFDs with this provider. You should consider whether you understand how CFDs work and whether you can afford to take the high risk of losing your money.
Stratos Global LLC (fxcm.com/en): Losses can exceed deposits.
Please be advised that the information presented on TradingView is provided to FXCM (‘Company’, ‘we’) by a third-party provider (‘TFA Global Pte Ltd’). Please be reminded that you are solely responsible for the trading decisions on your account. Any information and/or content is intended entirely for research, educational and informational purposes only and does not constitute investment or consultation advice or investment strategy. The information is not tailored to the investment needs of any specific person and therefore does not involve a consideration of any of the investment objectives, financial situation or needs of any viewer that may receive it. Past performance is not a reliable indicator of future results. Actual results may differ materially from those anticipated in forward-looking or past performance statements. We assume no liability as to the accuracy or completeness of any of the information and/or content provided herein and the Company cannot be held responsible for any omission, mistake nor for any loss or damage including without limitation to any loss of profit which may arise from reliance on any information supplied by TFA Global Pte Ltd.
Stratos Trading Pty. Limited (fxcm.com/au):
Trading FX/CFDs carries significant risks. FXCM AU (AFSL 309763), please read the Financial Services Guide, Product Disclosure Statement, Target Market Determination and Terms of Business at fxcm.com/au

Gold expect mixed and volatile trading close to the formation taGold continues to trend higher, making consecutive record-breaking peaks while holding within a bullish channel formation.
Trendline resistance is currently located at $5,190.
We will complete an AB=CD formation at $5,122.
Yesterday's dip to the downside resulted in the gap open from Sunday at $4,987 being closed
Support is located at 4775
Conclusion: although there is no clear indication of a change of trend, with the formation target in proximity, there's ample scope for consolidation. Expect mixed and volatile trading

AUD/USD leaves a gap-open at 0.6896; gaps tend to be closed We need to move over to a medium-term chart to see what is going on.
The last move higher from the 0.6663 swing low was aggressive. This is a common trait in the 3rd wave of a bullish Elliott Wave count.
We have a gap open from Sunday at 0.6896. Gaps tend to be closed.
Further support is not seen until 0.6788.
We have a 261.8% extension level located at 0.7051.
Conclusion: we will likely see a gap closure before the Fed interest rate decision. I can see no technical reason for a change in the bullish trend. It should also be noted that this chart suggests further risk on attitude toward stocks
