$Eth Follow-UpAn update of a chart posted weeks ago. Members get detailed breakdown on Multi-time Frames charts. They also get Bitcoin breakdowns not just directional bias.
Harmonic Patterns

EURUSD Staging a massive correction.The EURUSD pair has been rejected on the 2025 Resistance Zone, while at the same time its 1D RSI got rejected on its Lower Highs trend-line.
This is technically a preparation for a massive long-term bearish reversal but even on the shorter term, such rejections have declined by at least -3.46%. This targets directly Support 2 at 1.14000.
---
** Please LIKE 👍, FOLLOW ✅, SHARE 🙌 and COMMENT ✍ if you enjoy this idea! Also share your ideas and charts in the comments section below! This is best way to keep it relevant, support us, keep the content here free and allow the idea to reach as many people as possible. **
---
💸💸💸💸💸💸
👇 👇 👇 👇 👇 👇

BTCUSDT SELLWe sell in this area and when it reaches 50%, we free-rex and close half of the transaction and hold the other half until the transaction bottoms.

Buy Trend Clean Retest From Demand Zone EURUSD | 30M 📈
Price is holding at strong demand zone 1.1750–1.1770, showing bullish continuation potential.
Buy around 1.1755–1.1745 → Targets: 1.1785 / 1.1807
Bias remains bullish above demand, manage risk properly.

XAUUSD Structure Shift After Resistance RejectionXAUUSD displayed a well-defined bullish structure earlier, supported by a rising trendline and consistent higher highs. Price advanced smoothly until it reached the 4550 resistance zone, an area that has historically attracted strong sell-side interest. Multiple rejections near this level indicated exhaustion in buying momentum and increasing seller participation.
The market tone changed once price failed to sustain above the trendline. A decisive break below dynamic support confirmed a short-term structure shift, followed by an impulsive bearish move. The strength and speed of this decline suggest active distribution rather than a shallow pullback, highlighting that sellers briefly gained control.
After the sharp sell-off, price reached a key support zone, where bearish momentum slowed and candles began to compress. This behaviour reflects temporary balance as the market absorbs previous volatility. Such pauses often appear after aggressive moves and act as decision zones for the next phase.
From a broader perspective, this area now defines market intent. Holding above support may allow price to stabilise and attempt a corrective recovery, while failure to hold would keep downside pressure intact. Overall, XAUUSD has transitioned from trend continuation into a rebalancing phase, making patience and confirmation essential before the next directional move unfolds.

ZENUSDT UPDATE#ZEN
UPDATE
DGB Technical Setup
Pattern: Falling Wedge Pattern
Current Price: 9.05$
Target Price: 16.60$
Target % Gain: 80.74%
Technical Analysis: GIGGLE is breaking out of a falling wedge pattern on the 1D chart, indicating bullish potential. The price has recently surged above the resistance trendline, supported by an increase in volume. The setup is validated as the price approaches the key resistance areas.
Time Frame: 1D
Risk Management Tip: Always use proper risk management.


POWRUSDT UPDATE#POWR
UPDATE
POWR Technical Setup
Pattern: Falling Wedge Pattern
Current Price: 0.0859$
Target Price: 0.1500$
Target % Gain: 80.74%
Technical Analysis :POWR is breaking out of a falling wedge pattern on the 1D chart, indicating bullish potential. The price has recently surged above the resistance trendline, supported by an increase in volume. The setup is validated as the price approaches the key resistance areas.
Time Frame: 1D
Risk Management Tip: Always use proper risk management.

S&P500 rejection can cause a very bearish start to 2026.The S&P500 index (SPX) hit last Friday its Higher Highs trend-line and got rejected, so far not aggressively.
The 1D RSI rejection though on a Lower Highs trend-line that goes as back as the September 22 High, illustrates a massive Bearish Divergence (Lower Highs against price's Higher Highs), has the potential to accelerate the decline first to the 1D MA100 (red trend-line) and then the lower Support Zone.
As long as the Higher Highs trend-line holds, we expect the index to target 6510 (top of Support Zone) at least within January 2026.
---
** Please LIKE 👍, FOLLOW ✅, SHARE 🙌 and COMMENT ✍ if you enjoy this idea! Also share your ideas and charts in the comments section below! This is best way to keep it relevant, support us, keep the content here free and allow the idea to reach as many people as possible. **
---
💸💸💸💸💸💸
👇 👇 👇 👇 👇 👇

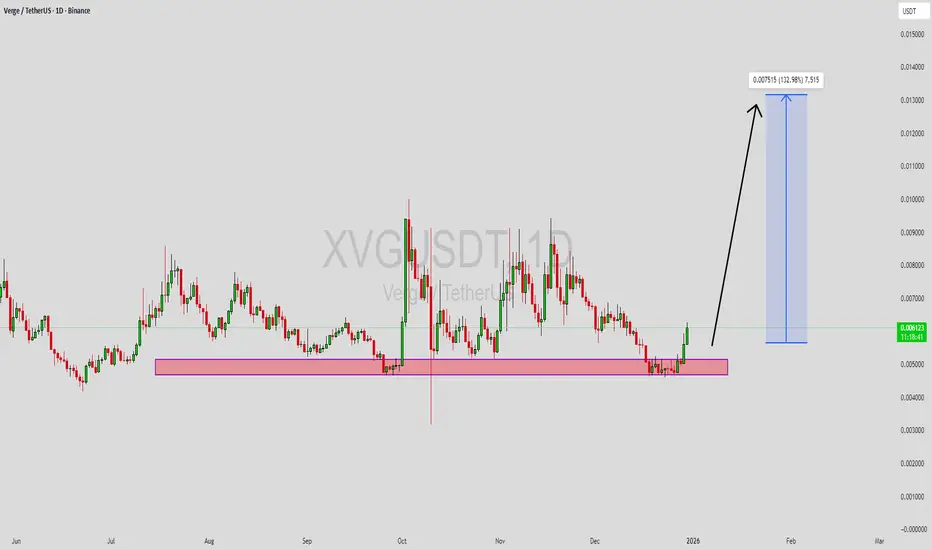
XVGUSDT Forming Bullish MomentumXVGUSDT is forming a clear bullish momentum pattern, a classic bullish reversal signal that often indicates an upcoming breakout. The price has been consolidating within a narrowing range, suggesting that selling pressure is weakening while buyers are beginning to regain control. With consistent volume confirming accumulation at lower levels, the setup hints at a potential bullish breakout soon. The projected move could lead to an impressive gain of around 90% to 100% once the price breaks above the wedge resistance.
This falling wedge pattern is typically seen at the end of downtrends or corrective phases, and it represents a potential shift in market sentiment from bearish to bullish. Traders closely watching XVGUSDT are noting the strengthening momentum as it nears a breakout zone. The good trading volume adds confidence to this pattern, showing that market participants are positioning early in anticipation of a reversal.
Investors’ growing interest in XVGUSDT reflects rising confidence in the project’s long-term fundamentals and current technical strength. If the breakout confirms with sustained volume, this could mark the start of a fresh bullish leg. Traders might find this a valuable setup for medium-term gains, especially as the wedge pattern completes and buying momentum accelerates.
✅ Show your support by hitting the like button and
✅ Leaving a comment below! (What is your opinion about this Coin?)
Your feedback and engagement keep me inspired to share more insightful market analysis with you!
STRAXUSDT Forming Falling WedgeSTRAXUSDT is forming a clear falling wedge pattern, a classic bullish reversal signal that often indicates an upcoming breakout. The price has been consolidating within a narrowing range, suggesting that selling pressure is weakening while buyers are beginning to regain control. With consistent volume confirming accumulation at lower levels, the setup hints at a potential bullish breakout soon. The projected move could lead to an impressive gain of around 140% to 150% once the price breaks above the wedge resistance.
This falling wedge pattern is typically seen at the end of downtrends or corrective phases, and it represents a potential shift in market sentiment from bearish to bullish. Traders closely watching STRAXUSDT are noting the strengthening momentum as it nears a breakout zone. The good trading volume adds confidence to this pattern, showing that market participants are positioning early in anticipation of a reversal.
Investors’ growing interest in STRAXUSDT reflects rising confidence in the project’s long-term fundamentals and current technical strength. If the breakout confirms with sustained volume, this could mark the start of a fresh bullish leg. Traders might find this a valuable setup for medium-term gains, especially as the wedge pattern completes and buying momentum accelerates.
✅ Show your support by hitting the like button and
✅ Leaving a comment below! (What is your opinion about this Coin?)
Your feedback and engagement keep me inspired to share more insightful market analysis with you!

EDUUSDT UPDATE#EDU
UPDATE
DGB Technical Setup
Pattern: Falling Wedge Pattern
Current Price: 0.1494
Target Price: 0.2235
Target % Gain: 50.30%
Technical Analysis: EDU is trading inside a falling wedge pattern on the 1D chart, which is a bullish reversal structure. Price is currently hovering near the wedge resistance, and a confirmed breakout above the descending trendline could trigger a strong upside move toward the highlighted target zone. Momentum is gradually improving, supporting the bullish scenario.
Time Frame: 1D
Risk Management Tip: Always use proper risk management.

Gold rebounds but could fall further at any time.Gold rebounds but could fall further at any time.
As shown in the chart: Today's Gold Analysis
Key Point 1: Don't mistake a rebound for a strong upward trend!
Key Point 2: Gold prices could fall further at any time!
Current Support: 4320-4330
Current Trend Support: 4300-4305
Current Resistance: 4380-4390
Current Trend Pressure: 4405-4420
Current Strategy:
SELL: 4380-4390
SL: 4405
TP: 4330--4320---4305---4300-
Join my channel, and I will guide you through real-time gold price movements.
Free sharing of high-quality signals.

Gold Trade Plan 30/12/2025Dear Traders,
Gold is still holding the **4300 area**, which represents the **lower boundary of the ascending trendline**. I expect that after a correction toward around **4340**, we could see a **corrective upward move**.
Happy New Year 2026 !
Regards,
Alireza!

EUR/USDEUR/USD looks absolute ripe for ripping, lower TFs look like a classic wyckoff accumulation.
DYOR, this is NOT financial advice

USDJPY H1 AnalysisUSDJPY H1 Analysis – Range High Distribution and Potential Bearish Rotation
USDJPY is currently trading near the upper boundary of a well-defined H1 range, where price has repeatedly failed to achieve sustained bullish continuation. The current structure suggests distribution at range highs, with downside liquidity becoming increasingly attractive.
Market Structure & Price Action
On the H1 timeframe, USDJPY previously printed a strong bullish impulse, followed by range consolidation. Price is now compressing below a clear resistance zone, with multiple failed breakout attempts and overlapping candles.
This behavior typically signals buyer absorption and weakening upside momentum, rather than healthy trend continuation. The lack of impulsive follow-through above resistance suggests smart money is likely positioning for a corrective move.
Key Support & Resistance Levels
Major Resistance: 0.006425 – 0.006440
Range high and supply zone where price has consistently been rejected.
Intraday Resistance: 0.006415 – 0.006420
Short-term reaction zone inside the range.
Immediate Support: 0.006395 – 0.006400
First downside liquidity pocket.
Key Support / Target: 0.006375 – 0.006385
Range low and higher-probability draw on liquidity.
Fibonacci & Technical Confluence
The current price action sits within the premium zone (above 61.8%) of the previous bullish leg, a typical area for profit-taking and short positioning.
EMA structure is flattening, indicating loss of trend strength, while RSI remains capped without bullish expansion, reinforcing the idea that upside momentum is limited.
Trading Scenarios
Scenario 1 – Bearish Rotation from Range High (Preferred)
Look for rejection or bearish confirmation near 0.006420 – 0.006440
Targets:
0.006400
0.006385
Extension toward range low if momentum increases
Scenario 2 – Bullish Break and Hold
A clean break and sustained hold above 0.006440
Would invalidate the bearish bias and open upside continuation
Conclusion
USDJPY is currently trading at a high-risk premium zone near range resistance, with price action favoring a mean-reversion move back into balance. Until a clear breakout occurs, the intraday bias remains cautiously bearish, with downside liquidity as the primary magnet.
If this analysis aligns with your view, consider saving it for reference and following to stay updated with structured intraday market insights.

The Calm Before the Break: EUR/USDEUR/USD on the 1H chart is trading in a well-defined range environment, with price currently around 1.1775 and repeatedly rotating between a support band near 1.1760–1.1765 and a resistance band near 1.1800–1.1810. The structure is not trending cleanly; instead, it is showing mean-reversion behavior—buyers step in aggressively on dips into support, while sellers defend the upper supply zone, producing the repeated “up-down” swings visible on the chart. Technically, this is reinforced by the moving averages compressing around price: the EMA 34 (~1.1775) and EMA 89 (~1.1773) are almost flat and overlapping, a classic signature of consolidation rather than directional expansion.
From a macro perspective, this type of tight range is typical when the market is waiting for clarity on rate expectations and yield differentials. EUR/USD tends to move higher when U.S. yields soften or the USD weakens, and it tends to stall or pull back when U.S. yields reprice upward or risk sentiment deteriorates. As long as traders are uncertain about the next policy steps from the Fed vs. ECB, price often remains trapped inside these liquidity bands, with both sides fading extremes rather than committing to trend continuation. The practical takeaway is simple: 1.1760–1.1765 is the “line in the sand” for bulls, while 1.1800–1.1810 is the ceiling that must break for upside expansion. A clean hold and rebound off support keeps the range rotation intact and opens the path back toward the top of the box; a decisive break and acceptance below support would invalidate the bullish rotation and shift focus to lower demand zones.

XAUUSDHello Traders! 👋
What are your thoughts on Gold?
Gold is moving within a well-defined ascending channel.
After reaching the upper boundary of the channel, a bearish divergence has formed, which has triggered a price reaction and a corrective move.
This correction is expected to extend toward the lower boundary of the channel, which aligns with the previous high and acts as a strong support zone.
In this area, we anticipate a bullish reaction and a potential continuation of the upward trend.
At the support zone, we will be waiting for confirmation signals before entering any long positions.
Don’t forget to like and share your thoughts in the comments! ❤️

BITCOIN It's really game over if it does that..Not much analysis is needed to address today's topic. Bitcoin (BTCUSD) will close tomorrow not only the year (2025) but also the month (December). This is a critical closing as the 1M (monthly) candle is currently red and if it closes this way (i.e. roughly below $90300), BTC will complete three straight red months.
Why this s important? Because during its 2023 - 2025 Bull Cycle, it never had three bearish 1M candles in a row and that could be a definitive confirmation that the new Bear Cycle is already underway.
In fact it would be almost a perfect match with the first 3 months of the previous Bear Cycle, which were also 3 straight red ones (November 2021 - January 2022), also supported by the 1W MA100 (red trend-line). A lifeline of encouragement would be however that, following those first 3 red candles of the previous Bear Cycle, the market found support on the 1W MA100 and rebounded the next two months (but of course only to drop more aggressively in the later stages).
It has to be noted also at this point that 3 straight red months has historically been a strong feature of Bear Cycle activity. In fact only twice Bitcoin displayed 3 straight red months during Bull Cycles: April - June 2021 and July - September 2019.
So if December closes in red tomorrow, would that be GAME OVER for BTC? Feel free to let us know in the comments section below!
---
** Please LIKE 👍, FOLLOW ✅, SHARE 🙌 and COMMENT ✍ if you enjoy this idea! Also share your ideas and charts in the comments section below! This is best way to keep it relevant, support us, keep the content here free and allow the idea to reach as many people as possible. **
---
💸💸💸💸💸💸
👇 👇 👇 👇 👇 👇

EURUSD Bullish Continuation Pattern|Watch the Descending ChannelHello and greetings to all my dear TradingView followers 👋📊
Hope you’re all doing great 🌟
Before starting the analysis, I’d like to wish everyone a Happy New Year 🎉🎄. May the new year bring you consistency, discipline, and profitable trades.
🔔 Important Note:
Due to the New Year holidays and reduced market liquidity, make sure to reduce your position size and apply strict risk management ⚠️💰.
📌 EURUSD Analysis (Euro / US Dollar)
Based on the current chart structure, EURUSD has shown a strong bullish impulse and is now moving within a corrective descending channel, which clearly suggests a bullish correction within an uptrend.
📐 What we can see on the chart:
Price is trading inside a descending channel (Bullish Flag / Channel)
Higher lows are being respected compared to the previous move
The marked support zone is acting as a key demand area
Price behavior indicates the market is forming a bullish continuation pattern
🚀 Bullish Scenario (Primary Scenario):
A clean breakout above the descending channel with confirmation could trigger a strong continuation to the upside. After a healthy pullback, EURUSD has the potential to target higher levels 📈🔥.
👀 Therefore:
Keep a close eye on the channel breakout
Avoid aggressive entries inside the channel
Breakout + retest could offer a lower-risk opportunity
⚠️ Disclaimer
This analysis is for educational purposes only and reflects a personal opinion, not financial advice or a trade signal.
All trading decisions are your own responsibility. Always consider your risk management and personal trading plan 🧠📉.
Wishing you successful and profitable trading 💚
If you found this analysis helpful, don’t forget to like and follow 🙏✨
🏷️ Tags:
#EURUSD #Forex #PriceAction #TechnicalAnalysis #Bullish #TradingView #SupportResistance #Channel #RiskManagement #FX 📊💹

Global Currency ShiftsTransformations in the International Monetary Landscape
Introduction to Global Currency Shifts
Global currency shifts refer to long-term and short-term changes in the relative value, usage, dominance, and influence of national currencies in the global financial system.
These shifts are driven by economic growth patterns, trade balances, monetary policy decisions, geopolitical developments, technological innovation, and investor confidence.
In recent decades, the global economy has moved away from a single-currency-dominated system toward a more multipolar currency environment.
Historical Context of Currency Dominance
Historically, global currency leadership has shifted from the British pound during the colonial and gold-standard era to the US dollar after World War II.
The Bretton Woods system cemented the dollar’s role as the world’s reserve currency, backed initially by gold and later by US economic strength.
Over time, changing economic realities have challenged this dominance, leading to gradual diversification.
Role of the US Dollar in Global Shifts
The US dollar remains the most widely used reserve, trade invoicing, and settlement currency.
However, its share in global reserves has slowly declined as countries diversify holdings into other currencies.
Expansionary fiscal policies, rising debt levels, and frequent use of financial sanctions have influenced perceptions of dollar risk.
Emergence of Multipolar Currency System
A multipolar system involves multiple currencies sharing global influence instead of one dominant currency.
The euro, Chinese yuan, Japanese yen, and British pound now play important regional and functional roles.
This diversification reduces systemic risk but increases complexity in global trade and finance.
Rise of the Chinese Yuan (Renminbi)
China’s growing share of global trade has increased the international use of the yuan.
Bilateral trade agreements increasingly allow settlement in yuan instead of dollars.
Inclusion of the yuan in global reserve baskets marked a significant milestone, though capital controls still limit full convertibility.
Euro’s Role in Currency Shifts
The euro serves as the second most important reserve currency globally.
Its strength depends on economic integration, fiscal discipline, and political unity within the eurozone.
Periodic debt crises have slowed its rise but have not eliminated its global relevance.
Impact of De-dollarization Trends
De-dollarization refers to efforts by countries to reduce reliance on the US dollar in trade, reserves, and debt.
Motivations include reducing exposure to US monetary policy and geopolitical pressure.
While de-dollarization is gradual, it reflects a strategic shift rather than an abrupt replacement.
Currency Shifts and Global Trade Patterns
Trade invoicing increasingly reflects regional currency preferences.
Energy and commodity contracts, traditionally priced in dollars, are seeing experimentation with alternative currencies.
This reduces currency risk for exporters and importers within the same economic bloc.
Central Bank Policies and Interest Rate Differentials
Diverging interest rate policies strongly influence currency movements.
Higher interest rates attract capital inflows, strengthening currencies, while accommodative policies weaken them.
Policy divergence among major central banks contributes to volatility in exchange rates.
Inflation, Debt, and Currency Valuation
High inflation erodes purchasing power and undermines currency confidence.
Countries with rising public debt face pressure on their currencies if investors doubt repayment sustainability.
Sound fiscal and monetary discipline remains critical for currency stability.
Role of Emerging Market Currencies
Emerging market currencies are increasingly important in global trade and investment flows.
These currencies tend to be more volatile due to capital flow sensitivity and external shocks.
Strengthening domestic financial systems improves their long-term credibility.
Geopolitical Influences on Currency Shifts
Wars, sanctions, trade conflicts, and diplomatic alliances significantly affect currency preferences.
Countries under sanctions often seek alternative payment systems and reserve currencies.
Geopolitical fragmentation accelerates currency diversification.
Technological Advancements and Digital Currencies
Digital payment systems and blockchain technology are reshaping cross-border transactions.
Central bank digital currencies (CBDCs) may alter how currencies are used internationally.
Technology reduces transaction costs and weakens traditional currency monopolies.
Role of Capital Flows and Investment Sentiment
Global investors move capital based on growth prospects, stability, and returns.
Safe-haven currencies benefit during periods of uncertainty, while risk currencies suffer.
Shifts in sentiment can rapidly change exchange rate dynamics.
Commodity Prices and Currency Correlations
Commodity-exporting nations often see their currencies move in line with global commodity prices.
Rising commodity demand strengthens these currencies, while downturns weaken them.
This creates cyclical currency behavior linked to global growth.
Impact on Developing Economies
Currency shifts affect debt servicing costs, import prices, and inflation in developing countries.
Dollar strength often pressures emerging markets with dollar-denominated debt.
Diversification strategies help reduce vulnerability to external shocks.
Financial Stability and Systemic Risk
A more diversified currency system can reduce dependence on one economy.
However, it may also increase coordination challenges among central banks.
Global financial stability depends on cooperation and transparent policy frameworks.
Corporate and Business Implications
Multinational corporations must manage currency risk more actively.
Hedging strategies and multi-currency invoicing are increasingly important.
Currency shifts influence investment decisions and profit margins.
Long-Term Outlook for Global Currencies
No single currency is likely to completely replace the US dollar in the near future.
Gradual evolution toward shared dominance is the most probable scenario.
Stability, trust, and economic strength will determine future leaders.
Conclusion: Strategic Importance of Currency Shifts
Global currency shifts reflect deeper changes in economic power, politics, and technology.
Understanding these shifts is crucial for policymakers, investors, and businesses.
As the world economy becomes more interconnected yet fragmented, currency dynamics will remain a central force shaping global finance.
Currency Adventure AwaitsNavigating the Dynamic World of Global Currencies
Introduction
The phrase “Currency Adventure Awaits” captures the idea that the global currency landscape is no longer static or predictable. Instead, it is an evolving ecosystem shaped by economic cycles, geopolitical shifts, technological innovation, and investor behavior. For traders, investors, policymakers, and even businesses, understanding currencies has become an essential journey—full of opportunities, risks, and lessons. Below is a detailed, point-wise exploration of this currency adventure, explaining why it matters and how one can navigate it effectively.
1. Currencies as the Backbone of the Global Economy
Currencies facilitate international trade, investment, and capital flows.
Exchange rates influence import-export competitiveness, inflation, and growth.
Every global transaction—from oil trade to software services—relies on currency exchange.
Strong currencies reflect economic confidence, while weak currencies signal stress or imbalance.
2. Evolution from Fixed to Flexible Exchange Rates
Earlier systems like the Gold Standard and Bretton Woods fixed currency values.
Modern economies mostly follow floating or managed-float exchange rate regimes.
Exchange rates now respond to market forces such as demand, supply, and capital flows.
This shift increased volatility, making currency markets more dynamic and adventurous.
3. Role of Central Banks in the Currency Journey
Central banks control interest rates, liquidity, and monetary policy.
Rate hikes generally strengthen a currency; rate cuts can weaken it.
Central bank communication (forward guidance) strongly impacts currency expectations.
Institutions like the US Federal Reserve, ECB, RBI, and BOJ shape global currency trends.
4. Interest Rate Differentials and Carry Trades
Investors borrow in low-interest currencies and invest in high-interest ones.
This strategy, called the carry trade, drives large currency movements.
Sudden risk-off events can reverse carry trades, causing sharp volatility.
Understanding rate differentials is key to navigating currency opportunities.
5. Inflation and Purchasing Power
High inflation erodes a currency’s real value.
Countries with stable inflation tend to attract foreign capital.
Purchasing Power Parity (PPP) compares currencies based on cost of living.
Long-term currency trends often reflect inflation differentials across nations.
6. Currency Adventure in Emerging Markets
Emerging market currencies offer higher returns but carry higher risks.
Factors include political stability, current account balance, and foreign debt.
Sudden capital outflows can cause rapid depreciation.
Examples include INR, BRL, ZAR, and TRY reacting sharply to global events.
7. The Dominance of the US Dollar
The US dollar remains the world’s primary reserve currency.
Most global trade, commodities, and debt are dollar-denominated.
Dollar strength affects global liquidity and emerging markets.
However, overreliance on the dollar has sparked diversification efforts.
8. De-Dollarization and Currency Diversification
Countries are increasingly trading in local currencies.
Central banks are diversifying reserves into gold, euros, and yuan.
Regional currency arrangements are gaining attention.
While de-dollarization is gradual, it adds new dimensions to the currency adventure.
9. Impact of Geopolitics on Currencies
Wars, sanctions, and trade conflicts cause currency volatility.
Safe-haven currencies (USD, CHF, JPY) strengthen during crises.
Sanctions can isolate currencies from global systems.
Geopolitics has turned currencies into strategic tools, not just economic units.
10. Currency Wars and Competitive Devaluation
Countries may weaken currencies to boost exports.
Competitive devaluation can lead to retaliatory actions.
This creates instability in global trade and financial markets.
Managing currency competitiveness without triggering wars is a key challenge.
11. Role of Trade Balances and Capital Flows
Trade surplus nations often experience currency appreciation.
Trade deficit nations rely on foreign capital inflows.
Portfolio and FDI flows significantly impact exchange rates.
Sudden shifts in flows can cause sharp currency moves.
12. Technology Transforming the Currency Landscape
Electronic trading platforms increased speed and transparency.
Algorithmic and high-frequency trading amplify short-term volatility.
Retail participation in forex markets has grown globally.
Technology has made currency markets more accessible than ever.
13. Rise of Digital Currencies and CBDCs
Cryptocurrencies challenge traditional monetary systems.
Central Bank Digital Currencies (CBDCs) aim to modernize payments.
Digital currencies may alter cross-border settlements.
This innovation marks a new chapter in the currency adventure.
14. Forex Markets: The World’s Largest Financial Market
Forex markets trade over trillions of dollars daily.
They operate 24 hours across global time zones.
High liquidity offers opportunities but also risks.
Understanding technical and fundamental factors is essential.
15. Currency Volatility: Risk and Opportunity
Volatility creates profit opportunities for traders.
It also increases hedging costs for businesses.
Risk management tools like forwards, futures, and options are crucial.
Successful navigation depends on discipline and strategy.
16. Hedging and Currency Risk Management
Businesses hedge to protect cash flows from exchange rate swings.
Investors hedge to stabilize portfolio returns.
Hedging strategies vary based on time horizon and risk appetite.
Effective hedging is a core skill in the currency journey.
17. Psychological Factors in Currency Markets
Market sentiment often drives short-term movements.
Fear and greed influence currency trends.
News, rumors, and expectations can outweigh fundamentals temporarily.
Understanding behavior adds depth to currency analysis.
18. Currencies and Commodity Linkages
Commodity exporters’ currencies move with commodity prices.
Examples include AUD (metals), CAD (oil), and RUB (energy).
Commodity cycles directly impact exchange rates.
This link adds another layer to currency dynamics.
19. Learning and Adapting in the Currency Adventure
Currency markets constantly evolve with global changes.
Continuous learning is essential for participants.
Combining macroeconomics, policy analysis, and technical tools improves decisions.
Adaptability separates successful navigators from the rest.
20. Conclusion: The Journey Ahead
The global currency system is complex, interconnected, and dynamic.
Economic shifts, technology, and geopolitics ensure constant change.
For traders, investors, and policymakers, the currency adventure truly awaits.
Those who understand the forces at play can turn uncertainty into opportunity.

Dark Pools Exposed: The Hidden Side of Modern Financial MarketsOrigins and Purpose of Dark Pools
Dark pools emerged in the late 20th century as a response to a genuine market problem. Large institutional investors—such as mutual funds, pension funds, and insurance companies—often need to buy or sell millions of shares at a time. Executing such large orders on public exchanges can significantly move prices against them, a phenomenon known as market impact. For example, if the market sees a massive buy order, prices may rise before the order is fully executed, increasing costs for the buyer.
Dark pools were designed to solve this issue by allowing institutions to match large orders anonymously, minimizing price disruption and reducing transaction costs. In theory, this benefits the market by enabling smoother execution of large trades without unnecessary volatility.
How Dark Pools Actually Work
In practice, dark pools match buyers and sellers internally, often using prices derived from public exchanges (known as the “midpoint” of the best bid and offer). Trades are reported to the public tape only after execution, meaning the market learns about the transaction after the fact, not while it is happening.
There are different types of dark pools. Some are operated by large investment banks, others by independent firms, and some are run by exchanges themselves as off-exchange venues. Each type has its own rules regarding who can participate, how orders are matched, and what level of information is disclosed.
The Exposure: Why Dark Pools Are Under Scrutiny
“Dark pools exposed” reflects the increasing concern that these venues may no longer serve only their original purpose. Over time, dark pools have grown dramatically in size and influence. In some major markets, a significant percentage of daily trading volume now occurs off-exchange. This shift has raised several red flags.
One major issue is transparency. Because orders are hidden, the public market may not reflect the true supply and demand for a stock. This can distort price discovery, which is the process by which markets determine the fair value of securities. When too much trading happens in the dark, prices on public exchanges may become less reliable.
Another concern is fairness. Retail investors typically trade on lit exchanges, where they can see prices and volumes. Institutional players, on the other hand, often have access to dark pools, advanced algorithms, and preferential routing. This creates a two-tiered market, where sophisticated participants operate with more information and better execution options than everyday investors.
Dark Pools and High-Frequency Trading
One of the most controversial aspects of dark pools is their interaction with high-frequency trading (HFT). While dark pools were originally intended for long-term institutional investors, some have allowed HFT firms to participate. Critics argue that this undermines the very purpose of dark pools.
High-frequency traders use speed and algorithms to detect patterns, exploit tiny price differences, and react in microseconds. In some cases, HFT firms can infer the presence of large institutional orders in dark pools and trade ahead of them on public exchanges, a practice often referred to as “predatory trading.” This has led to accusations that certain dark pools effectively enable front-running, even if indirectly.
Regulatory Response and Investigations
As dark pools have grown, regulators around the world have begun to “expose” their inner workings through investigations, fines, and new rules. In the United States, the Securities and Exchange Commission (SEC) has fined several banks for misleading clients about how their dark pools operated, particularly regarding the presence of high-frequency traders. These cases revealed that some dark pools were not as neutral or protective as advertised.
In Europe, regulations such as MiFID II introduced caps on dark pool trading volumes and stricter reporting requirements. The goal was to push more trading back onto transparent, regulated exchanges and restore confidence in price discovery. Other markets, including India, have taken a more cautious approach, limiting or tightly regulating off-exchange trading to prevent excessive opacity.
Impact on Market Volatility and Stability
Another dimension of dark pools exposed is their impact on market stability. During periods of market stress, liquidity in dark pools can evaporate quickly, as participants withdraw to avoid risk. This can exacerbate volatility on public exchanges, where remaining orders may be thinner and more reactive.
Because dark pools rely on public markets for price references, any disruption in lit exchanges can ripple through the dark ecosystem. This interconnectedness means that while dark pools may seem separate, they are deeply embedded in the broader financial system.
Are Dark Pools Always Bad?
Despite the criticism, it is important to recognize that dark pools are not inherently malicious. When properly regulated and transparently operated, they can provide genuine benefits. Large institutions can execute trades efficiently, reducing costs that might otherwise be passed on to pensioners, mutual fund investors, and policyholders.
The problem arises when dark pools grow too large, operate with insufficient oversight, or prioritize profit over fairness. Lack of clear disclosure, conflicts of interest (especially in bank-owned pools), and unequal access can turn a useful market tool into a source of systemic risk and mistrust.
The Future: Toward Greater Transparency
The exposure of dark pools has sparked an ongoing debate about the future structure of financial markets. Some argue for stricter limits or even the elimination of dark pools, pushing all trading onto transparent exchanges. Others advocate for smarter regulation—enhancing disclosure, enforcing fair access rules, and ensuring that dark pools genuinely serve their stated purpose.
Technological advances, such as blockchain-based trading systems and real-time reporting tools, may also play a role in bridging the gap between efficiency and transparency. The challenge for regulators and market participants alike is to balance the need for liquidity and low trading costs with the fundamental principles of fairness and open price discovery.
Conclusion
“Dark Pools Exposed” is not just a phrase; it represents a broader reckoning within modern finance. As hidden trading venues continue to shape market outcomes, understanding their mechanics, benefits, and risks becomes essential for investors, regulators, and policymakers. Dark pools began as a solution to a real problem, but their evolution has raised critical questions about transparency, equality, and trust in financial markets. Exposing how they work—and where they can go wrong—is a crucial step toward building markets that are not only efficient, but also fair and resilient.
