KIWI H4 | Bearish Reversal SetupBased on the H4 chart, we can see that the price has rejected off our sell entry level at 0.5793, which is a pullback resistance that aligns with the 50% Fibonacci retracement.
Our stop loss is set at 0.5827, which is a pullback resistance that aligns with the 78.6% Fibonacci retracement.
Our take profit is set at 0.5745, which is an overlap support.
High Risk Investment Warning
Stratos Markets Limited (
Harmonic Patterns

My view on GBPUSDMy view on GBPUSD 👇
I like the higher-timeframe structure, but right now price is reacting inside demand after a pullback, so I’m more cautious here.
What I’m watching:
We’ve had a CHoCH into demand, so this area could act as a base
I’d expect some consolidation or a small sweep before any strong move
If price holds above 1.3420–1.3400 and shows bullish confirmation, I’m open to longs toward 1.3550–1.3600
If demand fails, then we could see a deeper pullback before continuation
Overall: bullish bias, but I’d prefer confirmation from demand, not chasing the move.

Bearish reevrsal off Fib confluenceSwissie (USD/CHF) is rising towards the pivot, which is an overlap resistance and could reverse to the 1st support, which is a pullback support.
Pivot: 0.7992
1st Support: 0.7934
1st Resistance: 0.8025
Disclaimer:
The opinions given above constitute general market commentary and do not constitute the opinion or advice of IC Markets or any form of personal or investment advice.
Any opinions, news, research, analyses, prices, other information, or links to third-party sites contained on this website are provided on an "as-is" basis, are intended to be informative only, and are not advice, a recommendation, research, a record of our trading prices, an offer of, or solicitation for, a transaction in any financial instrument and thus should not be treated as such. The information provided does not involve any specific investment objectives, financial situation, or needs of any specific person who may receive it. Please be aware that past performance is not a reliable indicator of future performance and/or results. Past performance or forward-looking scenarios based upon the reasonable beliefs of the third-party provider are not a guarantee of future performance. Actual results may differ materially from those anticipated in forward-looking or past performance statements. IC Markets makes no representation or warranty and assumes no liability as to the accuracy or completeness of the information provided, nor any loss arising from any investment based on a recommendation, forecast, or any information supplied by any third party

XAUUSD-Inside a Clear Ascending Channel — Waiting for DirectionGold is moving within a very clear ascending channel. So far in the new year, there hasn’t been a strong move that confirms a continuation of the trend. We can see that price managed to break above the channel’s midline once, but it turned out to be a fake breakout and quickly dropped back below it.
At this point, we need to wait and see whether price is heading toward the lower boundary of the channel or if it can regain strength and move toward the upper boundary.
If price reaches the bottom of the channel, it would present a very good opportunity to look for long positions. On the other hand, if price manages to break the upper boundary, we would need to use a wider stop-loss and aim for a move toward the $5,000 level. Otherwise, it makes more sense to operate on lower timeframes, targeting smaller moves with tighter stops to avoid unnecessary stop-outs.
#Pouyanfa 🔥📊

HIMS Nice Double Bottom, Looks To Be Moving UpwardWe have a nice double bottom formation and we are oversold on the weekly timeframe. This could take a while to play out but I have mapped out a target above. This could also be a nice long term hold. Not financial advice.
Hims & Hers Health (HIMS) presents a compelling bullish case as a high-growth telehealth disruptor expanding beyond GLP-1 weight loss into a broader "hormonal empire" with durable moats in personalized medicine.
Explosive Revenue Trajectory
HIMS has delivered triple-digit growth in recent years, with analysts projecting 62% revenue jump to $2.4B in 2025 and 18% to $2.8B in 2026, fueled by subscriber additions surpassing 2M and average revenue per user climbing through personalized offerings like Hers for women and UK/Canada expansions.
The core model—direct-to-consumer subscriptions for hair loss, ED, skincare, and now weight management—benefits from network effects and sticky retention, with margins expanding as fixed costs dilute over scale.
GLP-1 Tailwinds Persist Despite Noise
While Novo Nordisk tensions create near-term FUD, HIMS' compounded semaglutide volumes remain robust, and diversification into oral non-GLP meds, labs testing (heart, hormones), and acquisitions like YourBio positions it for multi-year category leadership amid obesity treatment demand.
Even conservative forecasts see EPS rising 27% to $0.60 in 2026, trading at ~58x forward earnings that could compress to 40x on execution, implying 50%+ upside to $45-50 consensus targets.
Asymmetric Setup at Depressed Levels
Shares have pulled back 30-40% from peaks amid insider sales and valuation debates, yet trade at a discount to intrinsic value (~$44 fair value per models) with Strong Buy ratings from Barclays ($48 PT) and undervaluation narratives gaining traction.
Long-term, HIMS builds defensible platforms in telehealth adjacencies (mental health, hormones), offering 3-5x potential if it captures 1-2% of its addressable market, fitting aggressive traders like you alongside MSTR/BYND positions.

XAUUSDXAUUSD
The price is testing the 4440 support level again. If it holds above this level before the US session, we believe we could see at least the 4480-4500 area!
However, be aware that if the price breaks below 4440, we could quickly see the 4400 area!
Waiting for a breakout at key levels.

KALYANKJIL Swing Trade Setup📊 Price Action & Trend Analysis
Analyzing market trends using price action, key support/resistance levels, and candlestick patterns to identify high-probability trade setups.
Always follow the trend and manage risk wisely!
Price Action Analysis Interprets Market Movements Using Patterns And Trends On Price Charts.
👉👉👉Follow us for Live Market Views/Trades/Analysis/News Updates.

Is This the Base for a Trend Reversal or Just a Temporary Pause?📊 MARKET STRUCTURE & PRICE ACTION OVERVIEW
Hello traders! Here’s a clean technical breakdown of EURUSD (1H) based on the current chart structure.
EURUSD has been trading within a broader bearish structure, marked by consistent lower highs and lower lows. After a sustained sell-side move, price reached a key reaction area and printed a sharp bullish impulse, signaling short-term buyer participation and the formation of a potential pivot low.
Following this rebound, the market failed to sustain bullish momentum and rolled back into a corrective pullback, respecting prior structure levels. This behavior reflects a market still under bearish pressure, but now transitioning into a critical evaluation phase near demand.
🟦 SUPPLY & DEMAND – KEY ZONES
Primary Demand (Support Zone):
The 1.1665–1.1670 area is a well-defined demand zone, where strong buying previously entered and halted the sell-off. This zone represents institutional interest and is the key level preventing further downside.
Intermediate Resistance:
The 1.1700 level acts as a short-term structure barrier. Price rejection here confirms that sellers are still defending lower highs.
Major Supply Zones:
Overhead supply remains layered at:
1.1745–1.1760 (previous consolidation and EMA alignment)
1.1780–1.1790 (higher-timeframe supply and distribution zone)
These zones define the path price must reclaim to confirm a broader bullish shift.
🎯 CURRENT MARKET POSITION
Currently, EURUSD is trading just above the primary demand zone, placing price at a high-importance decision area. This is where the market will determine whether recent selling pressure is exhaustion-driven or simply a pause before continuation.
The proximity to demand suggests risk is becoming asymmetric, with sellers needing a clean breakdown to regain momentum.
🧠 MY SCENARIO
As long as EURUSD holds above the 1.1665 demand zone, the current price action can be treated as a corrective base-building phase, with potential for a push back toward 1.1700, followed by a retest of the 1.1745–1.1760 supply zone. Acceptance above that area would be the first signal of a meaningful trend shift.
However, a decisive hourly close below 1.1665 would confirm bearish continuation, opening the door for further downside expansion beyond the current structure.
For now, price is testing demand, not breaking structure.
⚠️ RISK NOTE
This is a critical inflection point. Let price confirm direction at demand, avoid early bias, and always manage your risk.

USDJPY SHORT1. The market has shown strong resistance at a zone which is a 4h OB
2. Yesterday's daily high buyside liquidity has been swept implying that the market may go for the daily sellside liquidity of Monday or Tuesday
3. 15min CHOCH after the liquidity sweep as the Markey dropped aggressively by forming big bearish candles
4. Wait for a retracement to the premium zone and the 4H candle open will act as my entry 😉
ENTRY: 156.595
SL: 156.750 (13.5 pips)
TP: 156.110 (48.5 pips)
RR: 1:3.59

AUD/USD corrects lower from the Crab completion; 261.8% is seen Following on from yesterday's report, AUD/USD continued its move to the upside, reaching the Crab formation target of 0.6768.
We have seen a corrective move lower.
Although it is tempting to call a top, the AUD single currency basket suggests further buying pressure.
The 261.8% extension level is located at 0.6782. Support is not seen until 0.6688
Conclusion: the preferred stance is to sell into higher gains. AUD/CAD is also the preferred cross for trading AUD.

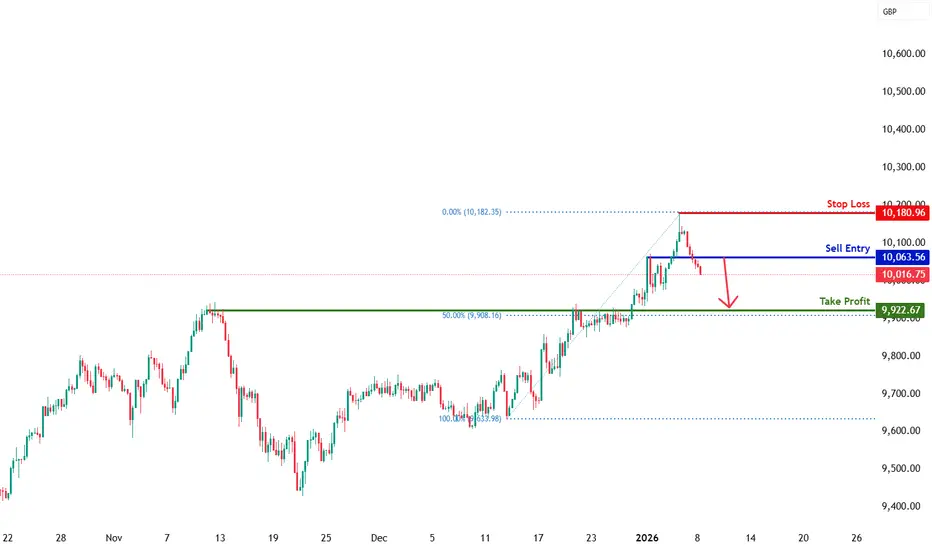
UK100 H4 | Bearish dropBased on the H4 chart analysis, we can see that the price has reacted off our sell entry level at 10,063.56, which is a pullback resistance.
Our stop loss is set at 10,180.96, which is a swing high resistance.
Our take profit is set at 9,922.67, which is a pullback support that aligns with the 50% Fibonacci retracement.
High Risk Investment Warning
Stratos Markets Limited (
Potential bullish rise?Loonie (USD/CAD) has bounced off the pivot and could rise to the overlap resistance.
Pivot: 1.3810
1st Support: 1.3748
1st Resistance: 1.3975
Disclaimer:
The opinions given above constitute general market commentary and do not constitute the opinion or advice of IC Markets or any form of personal or investment advice.
Any opinions, news, research, analyses, prices, other information, or links to third-party sites contained on this website are provided on an "as-is" basis, are intended to be informative only, and are not advice, a recommendation, research, a record of our trading prices, an offer of, or solicitation for, a transaction in any financial instrument and thus should not be treated as such. The information provided does not involve any specific investment objectives, financial situation, or needs of any specific person who may receive it. Please be aware that past performance is not a reliable indicator of future performance and/or results. Past performance or forward-looking scenarios based upon the reasonable beliefs of the third-party provider are not a guarantee of future performance. Actual results may differ materially from those anticipated in forward-looking or past performance statements. IC Markets makes no representation or warranty and assumes no liability as to the accuracy or completeness of the information provided, nor any loss arising from any investment based on a recommendation, forecast, or any information supplied by any third party

ICP/USDT at Make-or-Break Zone - Reversal or Further Sell-Off?ICP/USDT on the Weekly (1W) timeframe is still moving within a long-term downtrend structure after failing to hold above the $20 area. Price has now moved lower and is currently testing a very strong historical demand zone at $3.215 – $2.200 (yellow box).
This zone previously acted as a major accumulation base before the strong bullish impulse in early 2024. Price reaction in this area will be a key determinant for the medium- to long-term trend direction.
---
Structure & Chart Pattern
Primary Trend: Bearish (Lower High & Lower Low still valid)
Current Phase: Major Demand Zone Test / Accumulation Area
Market Structure:
Breakdown from the previous consolidation structure
Price has returned to the lowest historical support area
Volatility Spike:
Presence of an extreme long lower wick → strong rejection from lower prices & potential smart money buying
---
Key Levels
Major Demand Zone:
🟨 $3.215 – $2.200 (critical make-or-break zone)
Step-by-Step Resistance Levels:
$4.580
$6.850
$10.950
$14.550
Major Supply / Higher Timeframe Resistance:
$18.830 – $20.985
---
Bullish Scenario
The bullish scenario becomes valid if and only if:
Price holds above the $3.215 – $2.200 demand zone
A weekly higher low or bullish weekly close is formed
Followed by a break and close above $4.580
Bullish Targets (Step-by-Step):
1. $4.580 (structure retest)
2. $6.850 (mid resistance)
3. $10.950 (major breakout confirmation)
4. $14.550 – $18.830 (bullish continuation zone)
📌 Note:
As long as price holds above the demand zone, ICP has the potential to form a long-term accumulation base for a major reversal.
---
Bearish Scenario
The bearish scenario will play out if:
Price records a strong weekly close below $2.200
The major demand zone fails to hold
Bearish Implications:
Breakdown of historical support
Increased risk of extended panic selling
Price may enter lower price discovery
Bearish structure becomes stronger and fully validated
📌 $2.200 is the final psychological and technical boundary.
---
Conclusion
ICP is currently at a critical long-term decision point.
The $3.215 – $2.200 zone represents a major decision area:
Holding the zone → potential reversal & accumulation
Breaking the zone → extreme bearish continuation
Aggressive positioning is not recommended until a clear weekly close confirmation is observed.
---
#ICP #ICPUSDT #Altcoin #CryptoAnalysis #AltcoinAnalysis #WeeklyChart #MarketStructure
#DemandZone #SupportResistance #Downtrend #PotentialReversal
#SmartMoney

Bullish bounce off overlap support?Cable (GBP/USD) is falling towards the pivot, which has been identified as an overlap support and oculd bounce to the 1st resistance.
Pivot: 1.3422
1st Support: 1.3347
1st Resistance: 1.3530
Disclaimer:
The opinions given above constitute general market commentary and do not constitute the opinion or advice of IC Markets or any form of personal or investment advice.
Any opinions, news, research, analyses, prices, other information, or links to third-party sites contained on this website are provided on an "as-is" basis, are intended to be informative only, and are not advice, a recommendation, research, a record of our trading prices, an offer of, or solicitation for, a transaction in any financial instrument and thus should not be treated as such. The information provided does not involve any specific investment objectives, financial situation, or needs of any specific person who may receive it. Please be aware that past performance is not a reliable indicator of future performance and/or results. Past performance or forward-looking scenarios based upon the reasonable beliefs of the third-party provider are not a guarantee of future performance. Actual results may differ materially from those anticipated in forward-looking or past performance statements. IC Markets makes no representation or warranty and assumes no liability as to the accuracy or completeness of the information provided, nor any loss arising from any investment based on a recommendation, forecast, or any information supplied by any third party

WULF | DailyNASDAQ:WULF — Quantum Model projection
As illustrated on the daily chart, the Q-Structures indicate a potential Triangle formation within Intermediate Wave (4), which now appears structurally more mature—reinforcing the broader bullish outlook for the mining sector and indicating the potential for the full realization of all projected Intermediate-degree extensions.
🔖 This outlook is derived from insights within my Quantum Models framework.
🔖 Notably, all projected Intermediate-degree extensions across the mining sector align with my broader bullish outlook on CRYPTOCAP:BTC , specifically the ongoing Intermediate Wave (3) of the projected Primary Wave ⓹, unfolding within the impulsive Wave III Uptrend on the BTC’s second Cycle .

BTCUSD (4H) – Accumulation Completed | Liquidity → Expansion BTCUSD (4H) – Accumulation Completed | Liquidity → Expansion Phase
Bitcoin spent several weeks **distributing lower**, which forced late sellers into the market. Once sell-side liquidity was fully taken, price entered a **clear accumulation range** inside a **higher-timeframe demand zone (green area)**.
This is not random consolidation — it is **intentional price engineering**.
---
### 🔍 Market Structure Breakdown
* Strong bearish move → **sell-side liquidity taken**
* Price taps **HTF demand** and fails to continue lower
* Multiple rejections inside demand = **absorption**
* Range forms → weak hands get chopped out
* Recent impulsive candle = **bullish intent**
This behavior typically appears **before expansion**, not at tops.
---
### 🧠 Smart Money Concept at Play
Institutions don’t buy at highs.
They accumulate **when retail is scared** and price is ranging.
What we see here:
✔ Liquidity sweep
✔ Accumulation base
✔ Breakout with momentum
This is the classic **Accumulation → Expansion model**.
---
### 📈 Bias & Trade Plan
**Bias:** Bullish as long as price holds above demand.
**Entry idea:**
* Buy pullbacks into the upper part of the demand zone
* Or hold existing longs while structure remains intact
---
### 🎯 Targets (Liquidity Objectives)
* **100,000** – Psychological level (first magnet)
* **108,000 – 112,000** – Internal liquidity
* **111,000 – 116,000** – HTF supply / premium zone (main target)
Price moves from **discount → premium**. That’s the goal.
---
### 🛑 Invalidation
* A clean **4H close below the green demand zone**
This would invalidate the bullish structure.
---
### ⚠️ Risk Reminder
This is **not financial advice**.
Always manage risk and wait for confirmation.
📌 Follow **@FrankFx** for clean structure-based analysis, not hype.
---
If you want, I can:

HH HL.HUBC
Closed at 219 (07-11-2025)
HH HL.
Bullish on Bigger tf.
Slight dip can be a buying opportunity;
(210 - 215 probably).
Upside it may show 230 - 240 initially.
But should not break 200 now.

GBPJPYGBPJPY
- Symmetrical Triangle as an corrective pattern in Long Time Frame
- Break of Structure
- RSI - Divergence
- Completed " 1234 " Impulsive Waves
- Change of Characteristics

XAG/USD - Silver Vs USD - 1 h - Buy callOn 1 hr time frame, two harmonic patterns have been drawn. Shark and Cypher. Patterns are almost 90% complaint of standard values. Therefore, very high probability of achieving the target.
Price is just above EMA 200 and hence becomes very attractive for buying.
Trade values:
Buy : 72.25 (CMP)
SL: 69.85
TP-1 : 79.87
TP-2: 82.74

The Good, The Bad, and the Ugly. Silver.Silver, oh Silver.
My sweet, shiny stone. Since $24 or so, I've tried to preach the good word.
Where are we at now?
Ill start with my fundamental idealism and a short bear/bull case.
Year of the horse, lets keep it short-ish..
Bull
Silver has never seen her own bullrun.. until now(?).
We have new imposed restrictions via China on export.
We can sleep at night knowing silver is never going away.
We can sleep at night knowing they want to keep continue building data centers.
Silver is everything we wholeheartdly use, electronically.
Bear
We are going to see some sort of bearish diver, weve been hot too long
$70 support? we are currently ping-ponging in price, not an ideal entry point.
I've made a channel for our temporary upper and lower bounds.
Id suggest to watch for now, its a great time to take TP if youve been here.
Peace on Earth, happy new year.

EURUSD H4 | Potential Bearish Drop OffThe price has rejected our sell entry level at 1.1714, which is a pullback resistance that aligns with the 38.2% Fibonacci retracement.
Our stop loss is set at 1.1755, which is a pullback resistance that aligns with the 61.8% Fibonacci retracement.
Our take profit is set at 1.1643, which is a pullback support that aligns with the 50% Fibonacci retracement.
High Risk Investment Warning
Stratos Markets Limited (

GBPUSD H1 | Bullish Bounce The price is falling towards our buy entry level at 1.3466, which is a pullback support that aligns with the 61.8% Fibonacci retracement.
Our stop-loss is set at 1.3428, which is a pullback support level.
Our take-profit level is set at 1.3528, which is a pullback resistance.
High Risk Investment Warning
Stratos Markets Limited (

USDJPY H1 | Bullish Reversal The price has bounced off our buy entry level at 156.64, which is an overlap support.
Our stop loss is set at 156.18, which is a pullback suport.
Our take profit is set at 157.29, which is a pullback resistance.
High Risk Investment Warning
Stratos Markets Limited (
