The bearish Gartley still lives!This harmonic has so far played out amazingly well. The main trouble I had was not noticing the triple top made around 14250/14300. This then sent us down to complete the full 886 extension of the C. I've updated the chart and hidden the green fibs + GZ and added these white fibs with a green box. If the PA manages to break and close above the green box then it'll carry on to the D where I'll be taking profit and looking for a short entry to bring us down all the way to 11k. If the green box holds on the next attempt then the D will not come and we'll go to hell all the same.
Harmonictraders

JPYUSD ShortTime Frame: 4H
Symbol: JPYUSD
Entry: 0.007795
TP: 0.007550
SL: 0.007989
Bias: Short
The major trend is bearish and the micro trends are also bearish for this pair. We can expect a sell opportunity from the current price pattern.

GBPUSD ShortTime Frame: 4H
Symbol: GBPUSD
Entry: 1.27396
TP: 1.25053
SL: 1.28890
Bias: Short
For GBPUSD we are bearish in bias and we anticipate a short opportunity because of strong dollar. The strength of dollar is driving GBP down, so we have to look for a bearish opportunity from the current price context.

EURUSD ShortTime Frame: 4H
Symbol: EURUSD
Entry: 1.07482
TP: 1.05122
SL: 1.08818
Bias: Short
Our bias for EURUSD is short. We believe that the pair will go further down creating a better shorting opportunity. There is no quick turn around from the current situation. So let us look for a selling opportunity.

USDCHF LongTime Frame: 4H
Symbol: USDCHF
Entry: 0.95993
TP: 0.97993
SL: 0.94578
Bias: Long
The current price pattern of USDCHF is showing a bullish bias. The bias is strong and can continue ,so our stand is for taking a buy trade .

Long Bat Pattern GBPJPY 4HBat pattern formed slowly this week and got triggered in late last night.
Previous level of resistance likely to act as support before GBP moves higher.
Entry at: 165.062
Stop loss at: 164.202
Target 1 at: 166.193
Target 2 at: 167.052

DODOUSDT Harmonic patternsAttention *** Not a purchase offer ***
Could this pattern happen??
bearish shark pattern (0.886)
Not a purchase offer
Please let the technicians comment.
This post is for educational purposes only.

JPYUSD ShortTime Frame: 4H
Symbol: JPYUSD
Entry: 0.007822
TP: 0.007575
SL: 0.008006
Bias: Short
The pair is trending downward and it is showing a potential downward move. As our bias is bearish our expectation is to take a shorting Opportunity.

EURUSD ShortTime Frame: 4H
Symbol: EURUSD
Entry: 1.09165
TP: 1.06701
SL: 1.10901
Bias: Short
For this pair our bias is still bearish. Though there may be some short trend deviations. The major focus is on downside. So we pay special attention to shorting opportunities.

XAUUSD ShortTime Frame: 4H
Symbol: XAUUSD
Entry: 1946.424
TP: 1878.261
SL: 1998.358
Bias: Short
The current price pattern for this pair is suggestive of a sell pressure. We can expect a short position from the current price projection.

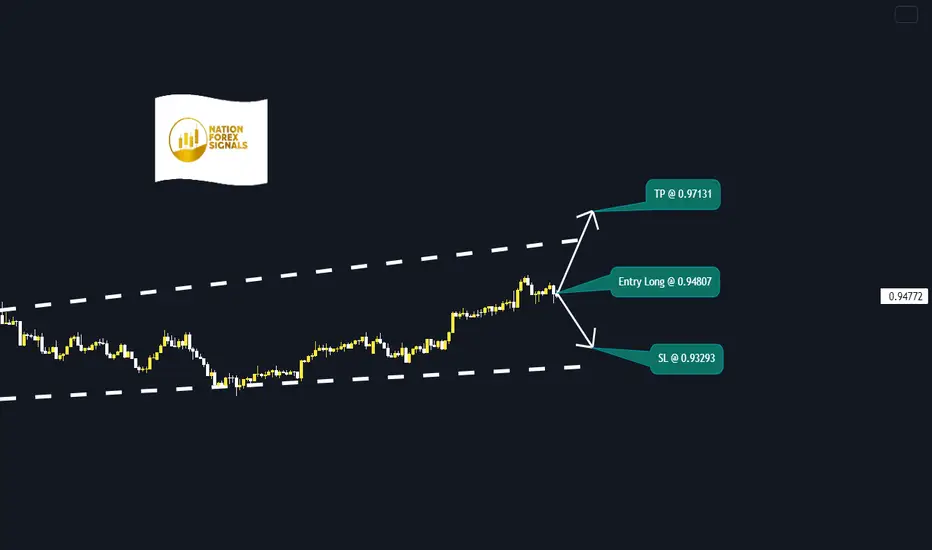
USDCHF LongTime Frame: 4H
Symbol: USDCHF
Entry: 0.94807
TP: 0.97131
SL: 0.93293
Bias: Long
Current bias for USDCHF is long though the long bias is not very strong today. However, our main focus is on the long side and we are looking for a bullish opportunity.
Re-Integration By Parts (near-term FB)This type of scenario/projection requires you to use your imagination a bit - align that with some solid math and some extrapolation and what we have is a very possible near-term scenario:
- Imagine FB never gapped last earnings, what would the price action look like. Is it possible it was forming the final part of its distribution phase that would have decreased in volatility s.t. it took the shape of a triangle pattern, and instead the earnings report accelerated the mark down? What we can do is extrapolate by cloning the current trendlines across the highs and lows post-gap down (blue lines) and populating where the range left off pre-gap. To properly complete the distribution phase might require a retest of the bottom range, and rejection before really tanking it/discounting it (by that I mean it will likely end up sub 170 (shaded red rectangle area) mid-term -- that would be a proper discounting before the next long-term bullish impulse wave can begin.
- Now, introduce some conventional techniques to see if there is a plausible path to test for rejection... recent (minor) bullish wolfe-wave 1-4 EPA @ ETA says yes, indeed, and by May 21st - nearly exactly when that pre-gap support line intersects the 1-4 EPA @ ETA!!
- Finally, is there a setup that would make such a near-term run actually bearish s.t. it would get rejected and complete markdown going into the summer? Indeed, Bearish Deep Crab Harmonic.
In summary:
~ Near-Term long to 258
~ Mid-term short back to 170ish IF rejected after near-term pop
~ Long-term Bullish but will have to re-analyze and update along the way.
There are more details to how/why I drew the path projection the way that I did, it is not random - pop pre-earning (i.e. before next week), small gap down post earnings next week, explosive bounce from that smaller gap to fill said gap and that momentum will take it to near-term target. If you're interested in how I determined this and you are familiar with stochastic analysis/Ito Calculus then we should talk. Otherwise just trust my word the math is gucci.
This would be kinda crazy if it all plays out lmao, but worth bringing up as a perspective on "meta" or whatever; not financial advice or whatnot.
Bless your souls,
The Alpinist

TECHM - Shark Pattern in PlaceThere is a formation of a shark pattern on the daily chart of the stock.
Currently stock is trading in the PRZ of the pattern.
We might see some pullback in the stock.
Short-term trade
Resistance: 1386- 1410
Support: 1290-1300


Point C hit, next up the big D!!Point C target hit plus back tested with the double bounce off the 618. The white fibs show potential places on the way up to D where we could expect a pull back. Same goes for the the green fibs. The D could extend as much as 1.618 which takes it to the white 1.168 fib, otherwise known as the golden ratio, around 16.2k. This bearish Gartley has so far played out perfectly and I see no reason why I shouldn't continue. I've adjusted the TF for the D to hit to the beginning of May because that's when the all important next FOMC meeting is.
I am long from C till D with SL on entry #riskmanagementiskey

JPYUSD ShortTime Frame: 4H
Symbol: JPYUSD
Entry: 0.007809
TP: 0.007525
SL: 0.008009
Bias: Short
The pair is trending short and will continue to do so until JPY gets some substantial strengths to fight back dollar. For the time being, there is no hope of return. So we are projecting a sell opportunity again.

USDCHF LongTime Frame: 4H
Symbol: USDCHF
Entry: 0.95010
TP: 1.97268
SL: 0.93270
Bias: Long
Our bias for this instrument is bullish. The strength of dollar is still in a remarkable position. The uptrend may continue for some more time.

SANDUSDT BULLISH SETUPThis asset has now reached to a point of reversal and can reach to following targets .

Big Bullish Bat for Bitcoin BruhMy whiskers are telling me that what goes down must go up....
...so I've been hiding in the bushes and waiting to see where the reaction will be.
We could technically reverse anywhere between the current price point and the 1.13 XA (alternate Bat), but I'm looking for something sooner than the 1.13 XA. Just in case, the 1.13 would be at $36,202.64.
The .886 XA, 2.618 AB extension and the 2.618 ABCD look like a good zone for a reversal.
The area seems to coexist with the purple (green) zones that have acted as support so far in this period of space-time.
What do you think will happen?
Owhooooo!

my low risk/high reward ta on atomsaw a harmonic pattern forming. its either a gartley or bat, my confidence in this trade is quite low because the price didn't hit my orderblock but a choch already formed so I might as well take it since its only a low risk (0.28%) but with a high reward :))))
PS
not a professional student please dyor.
stay safe :)))

JPYUSD ShortTime Frame: 4H
Symbol: JPYUSD
Entry: 0.007905
TP: 0.007651
SL: 0.008149
Bias: Short
The trend is downward and very clear. All moving average lines are aligned and signaling a short opportunity . Our bias is short and we are hopeful that this trend may continue next few weeks creating further rooms for selling opportunity.

EURUSD ShortTime Frame: 4H
Symbol: EURUSD
Entry: 1.08015
TP: 1.05644
SL: 1.09730
Bias: Short
For this instrument our bias is still short and like before the pair will drive itself further down in coming weeks. Our expectation from this pair is to take a shorting opportunity.

