HCLTECH

INDIAN IT INDEX & STOCKSHELLO ALL, GOOD EVENING,
VERY INTERESTING MARKET CLOSED DEEPLY NAGATIVE,
DESPITE OF GLOBAL & INDIAN MARKET, IT SECTOR IN POSSITIVE.
Accenture results good, but guidance given some low comparitively less than
last quarter. it sector going to anounce jan 12 start with infy.
just check TCS, INFY & HCL THESE
1.Closed above moving avg
2. fibb retracement done & going up ward direction
volume supporting
keep on eye IT STOCKS


HCL: negative breakout candidateHCL technologies is a potential breakdown candidate. Watch out for the breakdown zone!!!

Symmetrical TriangleHCL Technologies has formed symmetrical triangle pattern it is good buy around marked demand and sell on supply/stop loss area levels on closing basis. Let's see

HCLTech broke the resistance 1115HCLTech broke the resistance of 1115
Still in overbought zone but soon all IT stocks will move.

HCLTECH - Bull run beginning Explained in the video all the details.
Should be clubbed with other indicators if more confluence needs to be build.
1200.

HCL TECH - Good Dividend yield stock - Broke the resistance NSE:HCLTECH
HCL tech broke the resistance of 990 to 1000.
Broke the 200 EMA as well.
Result of the HCL tech is also good.
Dividend yield of 3.69%
Company has been maintaining a healthy dividend payout of 44.5%

HCL TechnologiesHCL Technologies- We could see there is Double bottom formed, 1st Target 980 and Next target 1040+ as Marked in the chart.
Disc- Only for Learning Purpose not a trading recommendation.

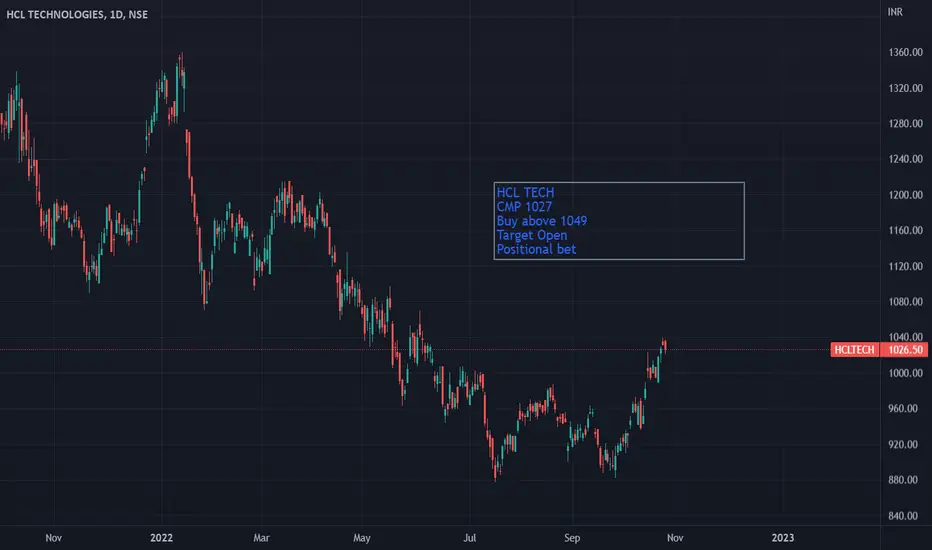
#HCLTechHCL TECH
CMP 1027
Buy above 1049
Target Open
Positional bet
We are already in SIP mode in HCL tech from 930 levels
HCL Technologies Ltd - Trendline Support + Just a View📊 Script: HCLTECH (HCL TECHNOLOGIES LIMITED)
📊 Nifty50 Stock: YES
📊 Sectoral Index: NIFTY IT / NIFTY 500
📊 Sector: Information Technology
📊 Industry: Computers - Software & Consulting
Key highlights: 💡⚡
📈 Script is trading near at its support level which is around 897.
📈 RSI is nearby to its Oversold zone.
📈 script may bounce back from its support level keep an eye on it.
📈 Fundamentals are also strong, one can buy on dips for long term.
📈 if it start moving upward first target will be 990 , Always maintain your Risk & Reward Ratio.
⏱️ C.M.P 📑💰- 895
🟢 Target 🎯🏆 - 990
⚠️ Important: Always maintain your Risk & Reward Ratio.
⚠️ Purely technical based pick.
✅Like and follow to never miss a new idea!✅
Disclaimer: I am not SEBI Registered Advisor. My posts are purely for training and educational purposes.
Eat🍜 Sleep😴 TradingView📈 Repeat🔁
Happy learning with trading. Cheers!🥂
Happy Navaratri 🕉️ 💃🏻🕺🏻


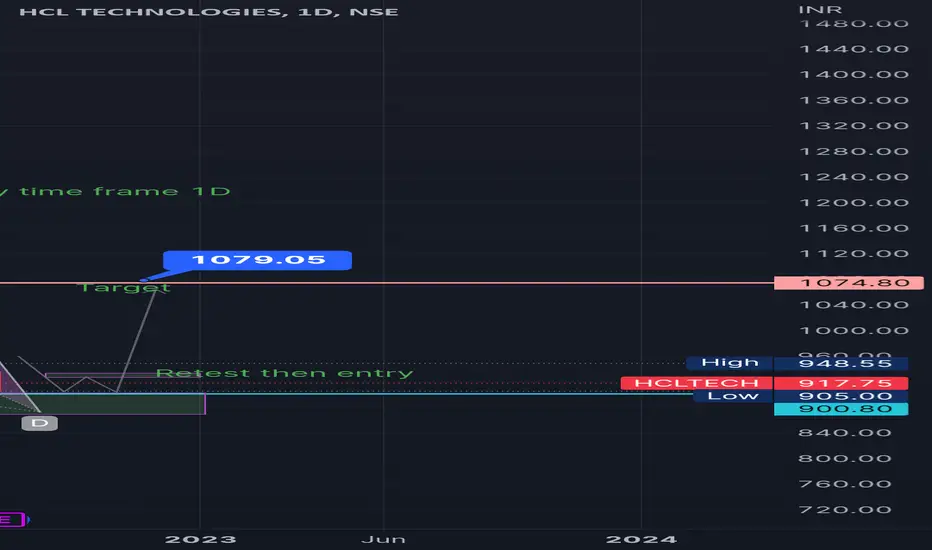
HCL TECHNOLOGY swing trade HCl tech here bat & butterfly pattern complete looking good for swing & midium term.

HCl tech midium termHCl tech 860/910 price here butterfly pattern complete,HCl tech midium/ short Target 1080
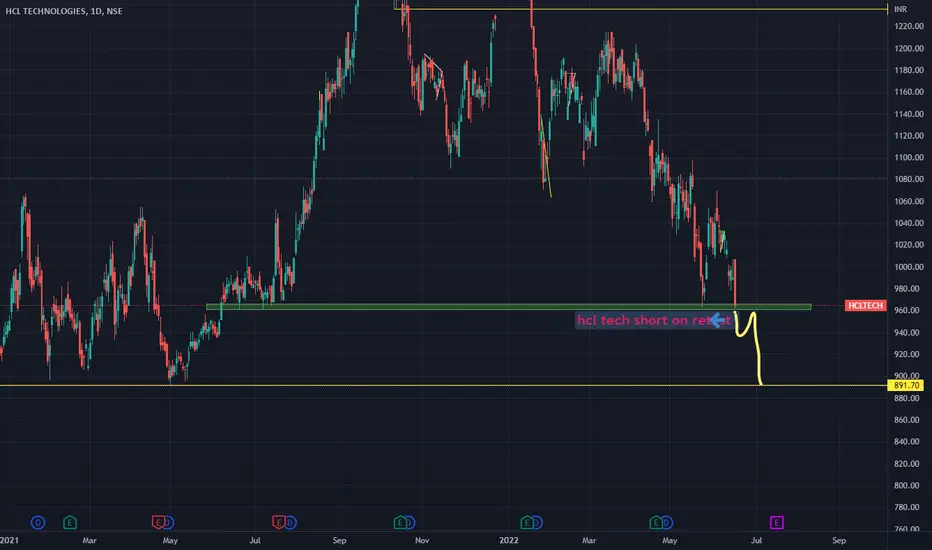
hcl techwe can short hcl tech if it breakdowns 965 with big candle and retest 965 we can buy 900 puts for hcl tech
HCLTECH - Trade for next weekAs seen on the chart, the support from the Volume profile indicator has been breached on Weekly and Daily Timeframes. A huge red candle has engulfed the previous days candle and the gap up could not hold as well.
HCL looks bearish and the targets are
TG1 - 1114
TG2 - 1074
The above is for educational purpose only.

Best buy zones for #Bottomfishing in #HCLTechnologies Good Buy Zone: 950 - 1073
Best Buy Zone: 805 - 950
Add on bounce, not while it is falling.
Long Term Portfolio Stock.
Tracking Quantity can be taken at CMP. (Tracking Quantity : Suppose you want to Invest Rs.X in a particular stock. The amount between Rs.X/5 or Rs.X/10 would be tracking quantity) (‘Tracking Quantity’ of a stock in your portfolio will help you keep a track of the stock if it is coming in the indicated buying zones.)(Sometimes Out of sight goes out of mind so buying tracking quantity of stocks that you want to add in future helps.)

HCLTECH LONGHcltech bounced back from a huge support zone. Tracking this stock from few days back but forgot to update it..
Still good time to enter this stock with decent returns.
Trade safe. Manage risk. Be profitable.
Disclaimer :- This is just my view. Please analyze charts yourself and then decide to take any trades.

Double top in HCLTECHWe are witnessing a double top in NSE:HCLTECH . It gave a breakdown on 27th Jan but on 28th price recovered a bit (as of writing this). If price fails to move up much from here and gives a close below the neckline again then it could be a good shorting opportunity for nearly 20% down move as per the height of double top formation. Keep an eye!

HCL TECHNOLOGIES - FORMING A CUP & HANDLE PATTERNForming a cup and handle bullish pattern. Buy above when the neckline is broken upwards @1330 to play the pattern.

HCLTECH - Bullish Head & Shoulder - Intraday/Short term tradeThe analysis is done on 15 min TF hence price may take a couple of days or more in order to reach the targets.
Trade setup is explained in image itself.
The above analysis is purely for educational purpose. Traders must do their own study & follow risk management before entering into any trade
Checkout my other ideas to understand how one can earn from stock markets with simple trade setups. Feel Free to comment below this or connect with me for any query or suggestion regarding this stock or Price Action Analysis.

HCL TECH SWING TRADE ANALYSISHCL is holding on 23 level of fabonaci its has formed head n shoulder pattern
Entry-1268
Exit-1394
Stoploss-1243

Weekly market analysis with gainers, losers and my viewI talk about how the major indices are placed on a weekly level and discuss the top performers and top losers of last week. Curious to hear your thoughts as well!
