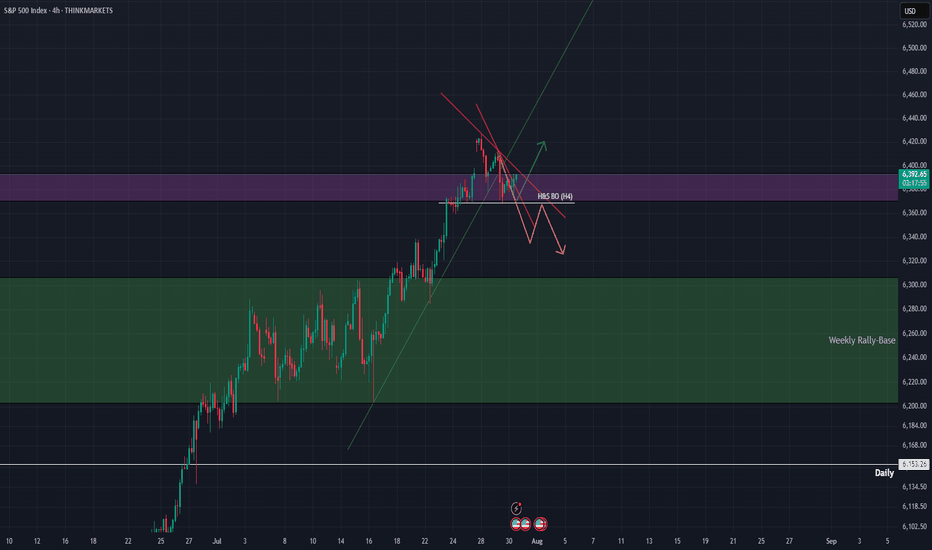
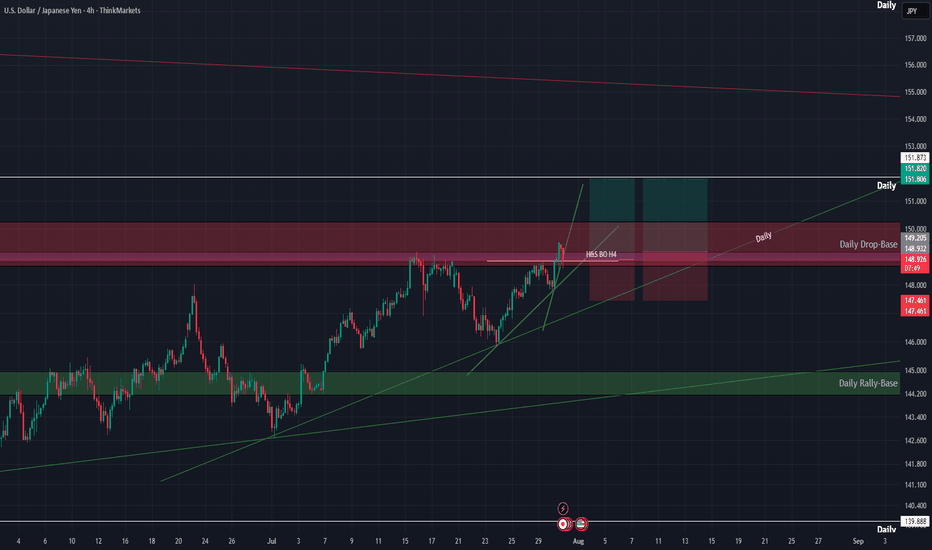
Head and Shoulders
Watchlist for the upcoming MonthWatchlist, I am leaving the buy and hold or technical analysis to the trader.
90% Equity Allocation
T (AT&T) – One of the largest U.S. telecom operators. Known for wireless, broadband, and media services. Defensive dividend stock, often favored for income but less growth.
HWM (Howmet Aerospace) – Supplies aerospace components, particularly jet engine parts and fastening systems. Strong tie to aviation cycles and Boeing/Airbus demand.
PLTR (Palantir Technologies) – A data analytics and AI-driven company with heavy government and enterprise contracts. Popular among growth investors for its AI positioning.
TPR (Tapestry) – Parent of luxury brands like Coach, Kate Spade, and Stuart Weitzman. A play on consumer discretionary spending and global luxury markets.
CBOE (Cboe Global Markets) – A major U.S. options exchange. Benefits from high volatility and increased derivatives trading.
STX (Seagate Technology) – A storage solutions company, specializing in HDDs and increasingly in data center storage. Sensitive to tech hardware cycles.
VST (Vistra Corp.) – A Texas-based power generator and retail electricity provider. Recently a big beneficiary of U.S. grid transition and power demand growth.
LDOS (Leidos Holdings) – Provides defense, IT, and engineering services. A government contractor with exposure to cybersecurity and national defense budgets.
RTX (RTX Corporation / Raytheon Technologies) – Aerospace & defense giant. Combines Pratt & Whitney engines and Raytheon defense systems. Key player in defense spending.
RPRX (Royalty Pharma) – Buys pharmaceutical royalties, giving exposure to drug revenues without direct R&D risks. A unique business model in biotech financing.
NFLX (Netflix) – Streaming leader. Strong global brand with massive original content library. Faces competition from Disney+, Amazon Prime, etc., but maintains scale advantage.
PM (Philip Morris International) – Tobacco company with a pivot toward smoke-free products (IQOS). Strong global distribution, especially outside the U.S.
AVGO (Broadcom) – A semiconductor and infrastructure software powerhouse. Key supplier to Apple and data centers. Huge in AI-driven chip demand.
UAN (CVR Partners LP) – Produces nitrogen fertilizer. Highly cyclical, tied to agricultural demand and natural gas pricing.
10% 2x Leverage Allocation
CAKE (Cheesecake Factory) – U.S. casual dining chain. Consumer discretionary, sensitive to economic cycles and inflation.
NVDA (NVIDIA) – AI and GPU leader. Critical to data centers, gaming, and autonomous vehicles. Market darling in AI revolution.
TSLA (Tesla) – EV leader, also expanding into energy storage and AI-driven autonomous driving. Strong growth but highly competitive sector.
GEV (GE Vernova, the energy spinoff of General Electric) – Focused on renewable and grid solutions. Plays into global decarbonization and power infrastructure demand.
MMM (3M) – Diversified industrial conglomerate (healthcare). Currently restructuring amid legal challenges, but historically a strong dividend payer.
GBPUSD: Bullish Cypher Pattern + Price Action Opportunity In today’s video, we break down two potential bullish trading opportunities on GBPUSD.
🔹 The first setup is a bullish Cypher pattern, offering a high-probability harmonic trading opportunity.
🔹 The second is a price action trade, based on a key level of structure that has been tested multiple times in recent market history.
If you have any questions, comments or just want to share your ideas, please feel free to do so below & as always show some support by hitting that LIKE button before you go!
Akil
USD/CAD Breakout + Continuation SetupIn this video, I'm looking at a simple but powerful trading setup on the $USDCAD.
✅ The pair has been in consolidation, building pressure
✅ A Head and Shoulders pattern has formed
✅ A violation of the current resistance level could trigger a bullish continuation
If we get that breakout, it could set up a clean opportunity for trend continuation traders via the breakout or breakout and pullback
🔔 Don’t forget to like, comment, and leave any questions that you may have below.
Akil
GBP/USD Analysis – Head & Shoulders + Bearish Cypher PatternWe're looking at two key technical setups forming on the FX:GBPUSD chart:
1️⃣ A potential Head and Shoulders pattern – a classic reversal signal that could indicate a reversal in trend.
2️⃣ A potential Bearish Cypher pattern – a harmonic pattern suggesting a high-probability reversal zone.
📈 Don’t forget to like, comment, and leave any questions that you may have for me below.
Akil
Loss of Momentum Pattern Into StructureSimilar to the OANDA:GBPJPY that I shared, the OANDA:EURAUD has put in a pretty aggressive and direct move into a previous level of structure. However, what makes this opportunity different than "the beast" is that as price approach our level of resistance we started to put in a rising channel which is a loss of momentum pattern along with other clues such as divergence on the RSI.
If you have any questions, comments or want to share your views, please do so below. Also be sure to hit that like button & give me a follow, that way you don't miss my future trading ideas.
Akil
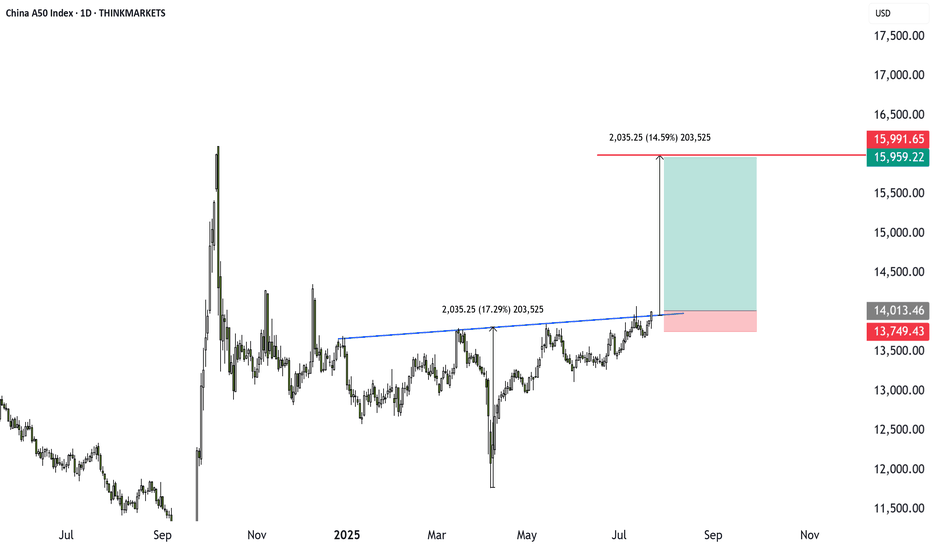
China A50 Breakout: 14% Opportunity Amid Summer Lull?Markets are quiet, but the China A50 is heating up. A bullish inverse head and shoulders pattern has formed, backed by stimulus hopes. Target upside is 14% with a strong risk-reward setup. Are you ready to trade it, or still on holiday?
This content is not directed to residents of the EU or UK. Any opinions, news, research, analyses, prices or other information contained on this website is provided as general market commentary and does not constitute investment advice. ThinkMarkets will not accept liability for any loss or damage including, without limitation, to any loss of profit which may arise directly or indirectly from use of or reliance on such information.
Bitcoin Hits First Target: What I Traded and What Comes NextBitcoin just hit my first target. I went long on BTC, XRP, Chainlink, and more. Booked profits and jumped into two new breakouts with better risk-reward. In this video, I break down my trades, the setup, and why I’m still bullish between 116K and 120K. I also explain how crypto deregulation and the Genius Act could fuel the next move.
Let me know in the comments how you traded this breakout.
This content is not directed to residents of the EU or UK. Any opinions, news, research, analyses, prices or other information contained on this website is provided as general market commentary and does not constitute investment advice. ThinkMarkets will not accept liability for any loss or damage including, without limitation, to any loss of profit which may arise directly or indirectly from use of or reliance on such information.
Educational: how to spot bitcoin tops before they happenBitcoin is rising, but how far can it go? In this video, I walk through key tools to spot local tops, including funding rates, Twitter sentiment, and pattern targets. We also discuss setups in XRP and Solana, and what to watch ahead of the US crypto regulation update on July 22.
XRP breaks out: 19% rally in sightXRP has just broken out of an inverse head and shoulders pattern, a classic bullish setup that points to a potential 19% rally. The breakout comes at a time when the US is expected to deliver key crypto regulation updates by July 22. If the legal outcome is positive, it could fuel further upside not only in XRP but across the broader crypto market. This setup offers a strong risk-to-reward profile, especially if Bitcoin also breaks out of its current rectangle pattern.
This content is not directed to residents of the EU or UK. Any opinions, news, research, analyses, prices or other information contained on this website is provided as general market commentary and does not constitute investment advice. ThinkMarkets will not accept liability for any loss or damage including, without limitation, to any loss of profit which may arise directly or indirectly from use of or reliance on such information.
BTC/USD Technical Analysis – Weekly Elliott Wave StructureIn this video, we analyze the weekly chart of Bitcoin ( BYBIT:BTCUSDT ) using Elliott Wave theory.
The current structure suggests the beginning of a new bullish impulse (waves 0, 1, and 2) following a clearly completed and technically correct corrective phase.
We explore potential impulsive scenarios starting from wave 2, using Fibonacci extensions to project possible targets and identifying key support zones and invalidation levels.
This analysis aims to provide a macro perspective based on price action, helpful for traders and investors following BTC from a medium- to long-term technical view.
🛑 Disclaimer: This content is for educational and informational purposes only. It does not constitute investment advice. Each user is responsible for their own trading decisions.
Dow Jones breakout targets 44K and beyondThe Dow Jones is finally breaking out, and the chart suggests a 3 to 4 percent move higher is in play. We analyse the key patterns, trade setups, and risks ahead including market seasonality, war headlines, and economic data. Bitcoin, EURUSD, and Nasdaq also showing strength. Is this the start of a bigger rally?
This content is not directed to residents of the EU or UK. Any opinions, news, research, analyses, prices or other information contained on this website is provided as general market commentary and does not constitute investment advice. ThinkMarkets will not accept liability for any loss or damage including, without limitation, to any loss of profit which may arise directly or indirectly from use of or reliance on such information.
ETH | BULLISH Pattern | $3K NEXT ??Ethereum has established a clear bullish pattern in the daily as we're seeing an inverse H&S:
The war issues across the globe must also be considered. So far, it's been bullish for crypto but this can also change overnight since it's a very volatile situation - and crypto being a very volatile asset.
For the near term, I believe ETH is due for another increase - at least beyond the current shoulder. This is IF we hold the current support zone:
It seems to be a bit of a slow burn with ETH for this season's ATH. In the ideal world, we'd either:
📢 consolidate under resistance (bullish)
📢make a flag (bullish)
📢OR smash right through the resistance.
But there's likely going to be heavy selling pressure around that zone.
__________________________
BINANCE:ETHUSDT
Dow Jones eyes new highs after NFP surpriseNFP came in at 139k vs 130k expected. Unemployment steady. Bad data earlier this week had markets spooked:
* ISM Services: 49.9 vs 52.4 expected
* ISM and Fairclaim: 48.5 vs 49.5
* Jobless claims hit 2025 highs
But today’s jobs report calms the panic.
Dow Jones could still climb, with potential setups offering 2.2 to 5.3 risk-reward. Watch the video to learn more.
This content is not directed to residents of the EU or UK. Any opinions, news, research, analyses, prices or other information contained on this website is provided as general market commentary and does not constitute investment advice. ThinkMarkets will not accept liability for any loss or damage including, without limitation, to any loss of profit which may arise directly or indirectly from use of or reliance on such information.
NFP Setups: Dow Breakout or USDJPY Breakdown?Big moves ahead? Friday’s Non-Farm Payrolls could be the trigger. ADP came in weak, jobless claims spiked, and ISM data disappointed. Now all eyes are on the Dow Jones and USDJPY. A strong NFP could send the Dow to new highs, while a weak one may sink USDJPY toward the 2025 low.
Watch the full breakdown and share your take in the comments.
This content is not directed to residents of the EU or UK. Any opinions, news, research, analyses, prices or other information contained on this website is provided as general market commentary and does not constitute investment advice. ThinkMarkets will not accept liability for any loss or damage including, without limitation, to any loss of profit which may arise directly or indirectly from use of or reliance on such information.


