HLF - 10 months HEAD & SHOULDERS══════════════════════════════
Since 2014, my markets approach is to spot
trading opportunities based solely on the
development of
CLASSICAL CHART PATTERNS
🤝Let’s learn and grow together 🤝
══════════════════════════════
Hello Traders ✌
After a careful consideration I came to the conclusion that:
- it is crucial to be quick in alerting you with all the opportunities I spot and often I don't post a good pattern because I don't have the opportunity to write down a proper didactical comment;
- since my parameters to identify a Classical Pattern and its scenario are very well defined, many of my comments were and would be redundant;
- the information that I think is important is very simple and can easily be understood just by looking at charts;
For these reasons and hoping to give you a better help, I decided to write comments only when something very specific or interesting shows up, otherwise all the information is shown on the chart.
Thank you all for your support
🔎🔎🔎 ALWAYS REMEMBER
"A pattern IS NOT a Pattern until the breakout is completed. Before that moment it is just a bunch of colorful candlesticks on a chart of your watchlist"
═════════════════════════════
⚠ DISCLAIMER ⚠
Breakout Area, Target, Levels, each line drawn on this chart and any other content represent just The Art Of Charting’s personal opinion and it is posted purely for educational purposes. Therefore it must not be taken as a direct or indirect investing recommendations or advices. Entry Point, Initial Stop Loss and Targets depend on your personal and unique Trading Plan Tactics and Money Management rules, Any action taken upon these information is at your own risk.
═════════════════════════════
Head and Shoulders

MVST - Bearish Head & Shoulders Breakdown Targeting $2.25–$2.75A classic Head and Shoulders pattern has formed on MVST's daily chart, with a clear neckline break to the downside. This technical setup suggests bearish momentum in the short term, with a likely price target between $2.25 and $2.75.
This zone also aligns with a prior consolidation area and dynamic support. I expect the stock to potentially find a bottom in this area. If MVST can deliver strong Q2 earnings in August, a bullish reversal from that demand zone could follow.

Title: Rejection at 3340 – Gold Struggles to Break ResistanceGold faced a clear rejection at the 3340 zone, dropping nearly 30 pips. This confirms that the 3335–3340 area remains a strong resistance. If price fails to break above this zone, we may see a move towards 3330 in the coming sessions. EMA 64 is now the key support to watch.

SILVER (XAGUSD): Pullback From SupportIt seems that the time has come for 📈SILVER to experience a pullback.
This morning, I've observed a solid intraday bullish signal with the emergence of a head and shoulders pattern on the 4-hour chart.
I anticipate a pullback to at least 36.61, followed by a move to 36.95.

GBPCHF shortGBPCHF has formed a HNS pattern at H4. Followed by rejected price recent from a drawn trendline, I foresee price will continue dropping, broken down the lower trendline until reach the size of the HNS 1:1.

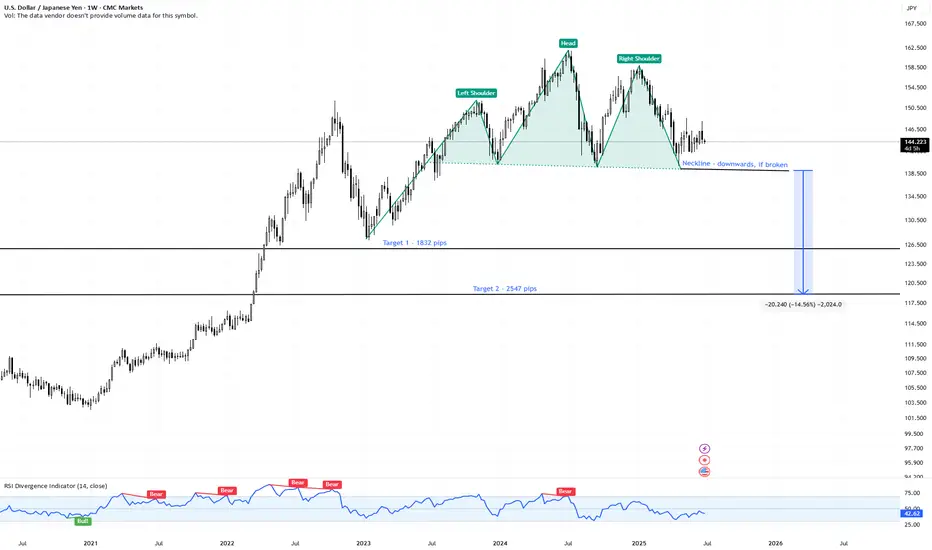
USDJPY | Massive Head & Shoulders Top – 2500+ Pips | Weekly📍 Pair: FX:USDJPY (U.S. Dollar / Japanese Yen)
📆 Timeframe: 1W (Weekly)
📉 Price: 144.22
📊 Pattern: Head & Shoulders (macro top)
🔍 Technical Setup:
USDJPY has formed a textbook Head & Shoulders pattern on the weekly chart, suggesting a potential multi-thousand pip reversal if the neckline fails.
🟩 Left Shoulder – Head – Right Shoulder structure is clear
🔻 Neckline sits near 137.00 – a major support zone
🔺 Pattern took over a year to form — signals significant macro exhaustion
🧠 Trade Plan & Targets:
❗️ Trigger: Weekly close below 137.00 (neckline breakdown)
⛔️ Invalidation: Close back above 151.00 (right shoulder high)
🎯 Target 1: 126.90
→ 📉 Move: -1,832 pips
🎯 Target 2: 118.80
→ 📉 Move: -2,547 pips
🔭 Both targets are based on measured move logic from the height of the head to the neckline, projected downward.
⚠️ Key Observations:
Sideways price action forming the right shoulder = distribution zone
Breakdown would shift trend from bullish to bearish on a long-term scale
Potential for carry trade unwind and safe-haven yen demand if macro tensions rise
💬 Are we on the verge of a major USD reversal vs the yen?
📌 Watch for a confirmed weekly break below 137.00 — this setup could define Q3–Q4.
#USDJPY #Forex #HeadAndShoulders #JPYStrength #TrendReversal #TechnicalSetup #TargetTraders
silver head and shoulder pattern price breakout in first week of june then sideways entire month
during same time gold was selling off below $3430 resistance and fed was very hawkish on stagflation
if buyers stopped buying and seller come in then price can breakdown then neckline of pattern

LTCUSD BUY 86.00On the 4-hour chart, LTCUSD has formed a head and shoulders bottom pattern. Currently, we can pay attention to the support near 86.00. If it falls back and stabilizes, we can consider buying. The upper resistance is around 94.20.

BTC/USD Technical Analysis – Weekly Elliott Wave StructureIn this video, we analyze the weekly chart of Bitcoin ( BYBIT:BTCUSDT ) using Elliott Wave theory.
The current structure suggests the beginning of a new bullish impulse (waves 0, 1, and 2) following a clearly completed and technically correct corrective phase.
We explore potential impulsive scenarios starting from wave 2, using Fibonacci extensions to project possible targets and identifying key support zones and invalidation levels.
This analysis aims to provide a macro perspective based on price action, helpful for traders and investors following BTC from a medium- to long-term technical view.
🛑 Disclaimer: This content is for educational and informational purposes only. It does not constitute investment advice. Each user is responsible for their own trading decisions.

Inverse head and shoulders pattern forming on the Total Chart!This is the full chart from my previous published idea. Lol

Inverse head and shoulders pattern forming on the Total Chart.There's either an inverse head and shoulders pattern forming on the Total chart or it's a cup & handle pattern. Either way they are both extremely bullish and roughly have the same price target!
What are your thoughts? Please tell me in the comments and thank you for looking at my chart! 😊

3 months holdingHINDPETRO made inverse head & shoulder pattern on WEEKLY charts with above average volume.
Could b bought in cash & hold for 2-3 months for target of 540.
Note: These are future levels,adjust it in cash levels.

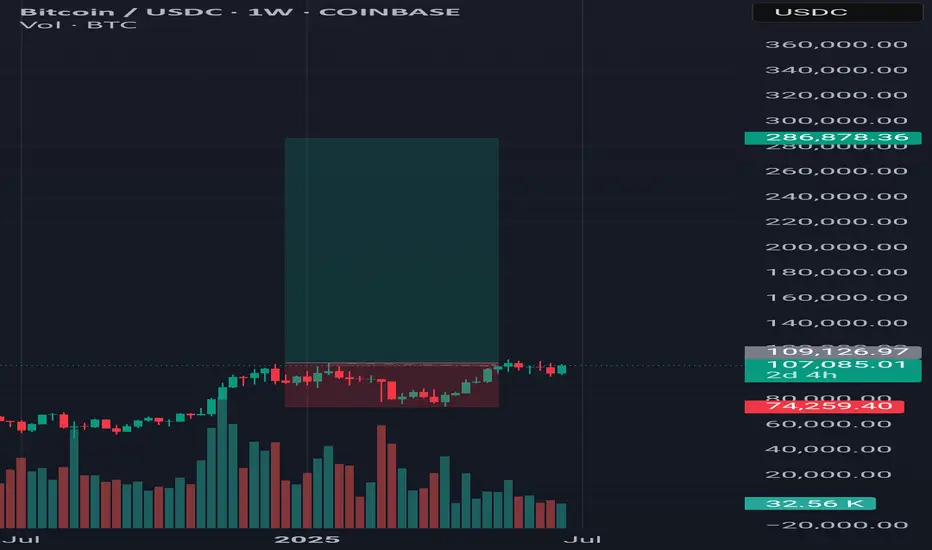
Btc have big long chanceI want to get an optimistic scenario from Bitcoin, which can increase up to five times as far as the history of Hawings.
🇮🇷Long Live Iran🇮🇷
Gold Confirms Breakdown — Eyes on $3100 TargetGold has broken below the neckline of multiple Head & Shoulders formations, signaling potential downside continuation. This technical development opens the path toward the projected target around $3100, Let’s monitor whether the pattern fulfills its full potential.
#Gold #XAUUSD #HeadAndShoulders #TechnicalAnalysis #ChartPattern #GoldForecast #TradingView #Commodities #PriceAction

USDCAD: Very Bearish PatternThe USDCAD has created a head and shoulders pattern at a significant intraday horizontal resistance.
A bearish breakout from this neckline indicates strong selling pressure, suggesting that the pair is likely to continue declining, potentially reaching at least the 1.3600 level.

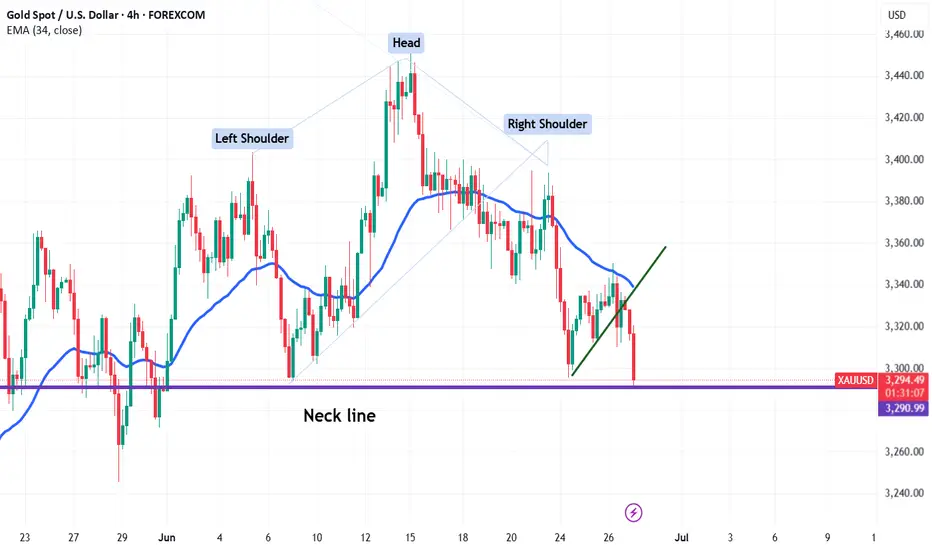
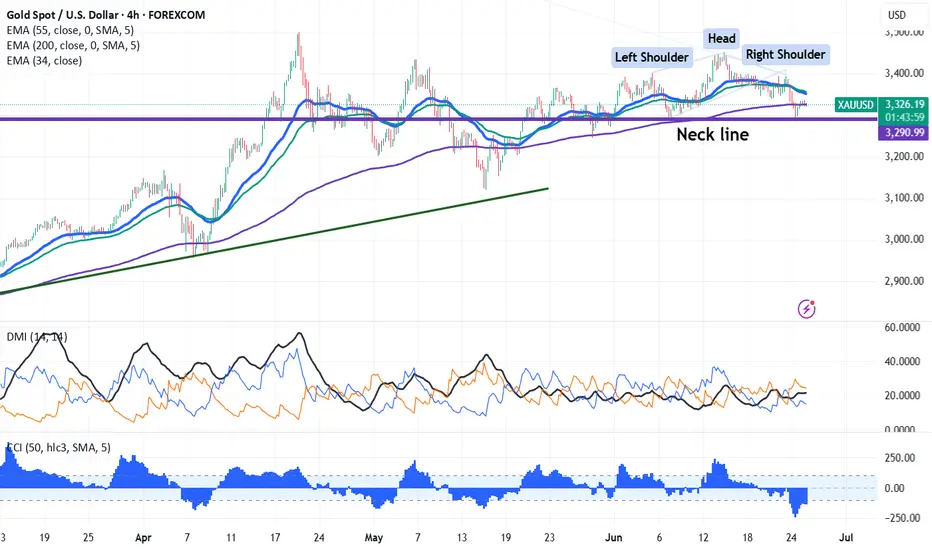
Gold's Head and Shoulders Suggests Bearish SignalChart pattern-Head and Shoulder
Gold pared most of its gains as US and China trade tensions eased. It hits an intraday low of $3291 and is currently trading around $3294.81.
Gold prices are holding below the short-term moving averages 34 EMA and 55 EMA and above the long-term moving averages (200 EMA) on the 4-hour chart. Immediate support is at $3340, and a break below this level will drag the yellow metal to $3330/$3300. The near-term resistance is at $3385 with potential price targets at $3400/43420$3450/$3475/$3500/$3550.
It is good to sell below $3295 with a stop-loss at $3340 for a target price of $3000.
USDJPY: Classic Bearish PatternThe USDJPY has developed a significant head and shoulders pattern on the 4-hour time frame.
We see a confirmed breach of the neckline and an intraday candle closing below it.
The pair is likely to keep falling, with the next target at 143.05.

ETHUSD📊 ETH/USD 4H Trade Setup For Long
🔍 Watching an Inverse Head & Shoulders 🫱🫳👤
🔼 Entry: At Fib levels or marked zone
🛡️ Stop Loss: Below support / right shoulder
⏳ Time to Move: ~4 to 5 days from Support ➡️ Resistance
🚪 Tried to break major resistance 4 times
🌍 Geopolitical tensions 🌐 caused pullback
⚡ Now, resistance is weakening —
💥 Breakout likely
🎯 High Risk:Reward setup
📈 Get ready for the move!

EURUSD Head And ShouldersEURUSD has created a normal head and shoulders pattern while reaching a HTF resistance on the weekly/daily. I expect this pattern to be a catalyst to a bearish movement.
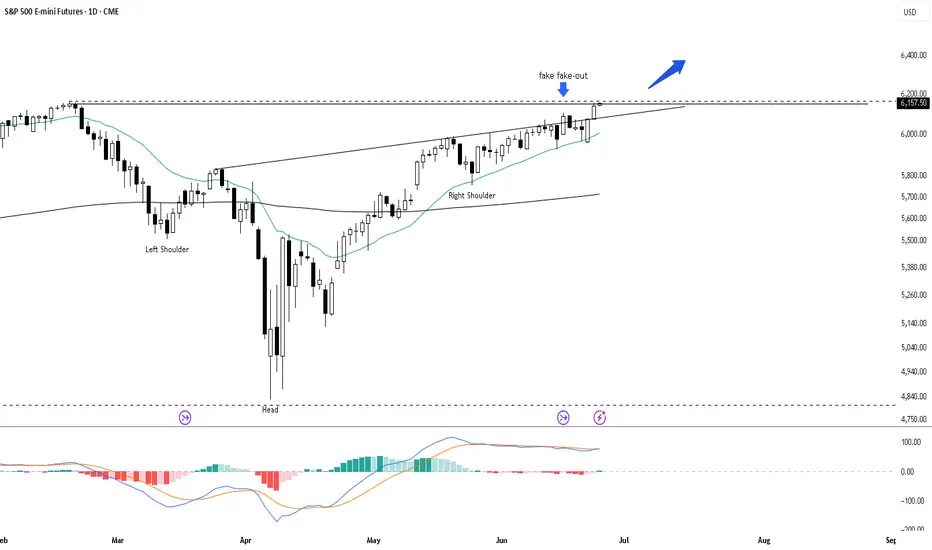
SPX Bullish Breakout: 18% Upside to $7,300The S&P 500 has broken out of an inverse head and shoulders formation, targeting approximately $7,300 within three months. The MACD shows strong bullish momentum with a recent crossover above the signal line. The price is holding above the 21-day EMA, further confirming bullish momentum.
Technical Alert: Gold's Head and Shoulders Suggests Bearish SigChart pattern-Head and Shoulder
Gold pared most of its gains as Israel and Iran ceasefire agreement. It hits an low of $3295 and is currently trading around $3327.
Gold prices are holding below short term moving average 34 EMA and 55 EMA and above long-term moving averages (200 EMA) on the 4-hour chart. Immediate support is at $3340 and a break below this level will drag the yellow metal to $3330/$3300. The near-term resistance is at $3385 with potential price targets at $3400/43420$3450/$3475/$3500/$3550.
It is good to sell below $3295 with a stop-loss at $3330 for a target price of $3000.
Dow Jones breakout targets 44K and beyondThe Dow Jones is finally breaking out, and the chart suggests a 3 to 4 percent move higher is in play. We analyse the key patterns, trade setups, and risks ahead including market seasonality, war headlines, and economic data. Bitcoin, EURUSD, and Nasdaq also showing strength. Is this the start of a bigger rally?
This content is not directed to residents of the EU or UK. Any opinions, news, research, analyses, prices or other information contained on this website is provided as general market commentary and does not constitute investment advice. ThinkMarkets will not accept liability for any loss or damage including, without limitation, to any loss of profit which may arise directly or indirectly from use of or reliance on such information.

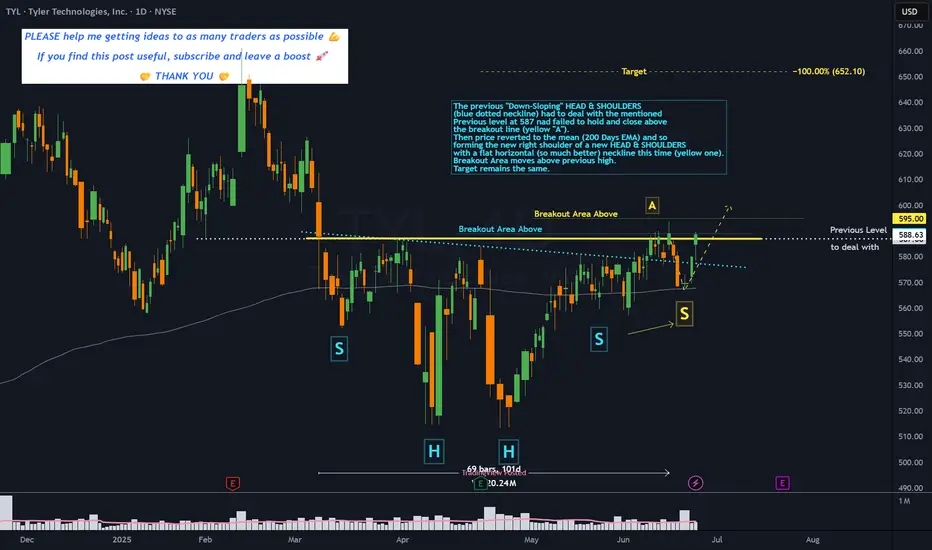
TYL - 3 months HEAD & SHOULDERS══════════════════════════════
Since 2014, my markets approach is to spot
trading opportunities based solely on the
development of
CLASSICAL CHART PATTERNS
🤝Let’s learn and grow together 🤝
══════════════════════════════
Hello Traders ✌
After a careful consideration I came to the conclusion that:
- it is crucial to be quick in alerting you with all the opportunities I spot and often I don't post a good pattern because I don't have the opportunity to write down a proper didactical comment;
- since my parameters to identify a Classical Pattern and its scenario are very well defined, many of my comments were and would be redundant;
- the information that I think is important is very simple and can easily be understood just by looking at charts;
For these reasons and hoping to give you a better help, I decided to write comments only when something very specific or interesting shows up, otherwise all the information is shown on the chart.
Thank you all for your support
🔎🔎🔎 ALWAYS REMEMBER
"A pattern IS NOT a Pattern until the breakout is completed. Before that moment it is just a bunch of colorful candlesticks on a chart of your watchlist"
═════════════════════════════
⚠ DISCLAIMER ⚠
Breakout Area, Target, Levels, each line drawn on this chart and any other content represent just The Art Of Charting’s personal opinion and it is posted purely for educational purposes. Therefore it must not be taken as a direct or indirect investing recommendations or advices. Entry Point, Initial Stop Loss and Targets depend on your personal and unique Trading Plan Tactics and Money Management rules, Any action taken upon these information is at your own risk.
═════════════════════════════