trade idea on xausdprice has finally completed the head and shoulder pattern and a break of the neck line support, i will be waiting for a retest of that broken support around 3854.531 for a short, else gold would continue melting from here on to the down side
Let's see how things play out
Head and Shoulders

Head and Shoulders Pattern in the EUR/USD As it seems, the head and shoulders pattern has formed in the EUR/USD currency pair on the H1 timeframe.
The price has also moved down with a strong candlestick by hitting the ceiling of the H4 descending channel in this range.
The price is expected to continue moving towards the bottom of the channel.
Stop Loss on the Range 1.17500
Take Profit on the Range 1.16700

EURUSD Bullish Correction Not DoneIndeed the overall bias is bearish for this market.
But if there is one thing I know about retests of these head and shoulder patterns is that sometimes price will insist on retesting either the right shoulder region or even the head.
Personally I am not looking to long the dollar just yet until one of those two highs I have drawn up have been taken.
Good luck for NFP everyone.

EUR/USD: How to Catch a Bullish Wave?📈EURUSD retested a recently broken horizontal structure on a 4H chart.
After its test, the price formed an inverted head and shoulders pattern
and violated a resistance line of a bullish flag formation.
To catch a bullish wave with a confirmation, wait for a bullish breakout above the neckline of the H&S pattern,
Then the retest of an underlined blue supply cluster will be your buy zone.
With a stop loss below the right shoulder, we may catch a nice swing trade here.
Goal will be 1.1814

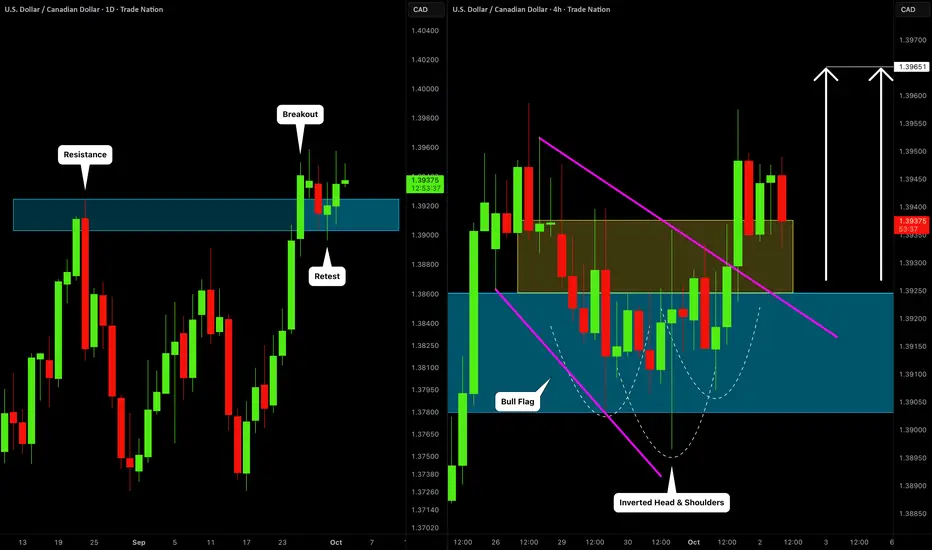
USDCAD: Correction is Over?! 🇺🇸🇨🇦
USDCAD may complete a correctional movement after a confirmed
breakout of a major daily resistance.
A bullish violation of a trend line of a bullish flag pattern and a neckline
of an inverted head & shoulders pattern provides a strong confirmation.
Next goal - 1.3965
❤️Please, support my work with like, thank you!❤️
I am part of Trade Nation's Influencer program and receive a monthly fee for using their TradingView charts in my analysis.
Trade idea on Xauusd My speculation on Xauusd is an If Else situation
A break above 3,875 resistance confirms that the bulls are incharge Else
A break and retest of of 3,854.531 support confirms that the bears are incharge hence a push to the down side
Let’s see how it all plays out from this London session through till New York session. Stay tuned for any updates for when we see our confirmation at either side

USDCHF H&S potential shortUSDCHF H&S potential short on the H1 timeframe
Manage risk and trade to the next H4 zone

EURUSD Daily left head right shoulderEURUSD: Potential Left Head and Right Shoulder. on the 1H we see how it respected the daily fair value gap and we see how the lower time frames like the 5M, 15M, 30M, all showed us rejection from the daily trend and on the fair value gap.
Also if price does end up forming the left head right shoulder the retest could potentially wick into the EMA

EURUSDEURUSD: Potential Left Head and Right Shoulder on the 1H. We see how it respected the fair value gap and we see how the lower time frames like the 5M, 15M, 30M, all showed us rejection from the daily trend and on the fair value gap.
Also if price does end up forming the left head right shoulder the retest could potentially wick into the EMA

$PANW next big mover $250+?If you look at the chart, you can see that PANW has formed a large inverse head and shoulders, a move above the resistance line should produce a huge move to the upside.
I have no clue what causes the move, but breaking $207.50 should trigger a move to the upper resistance levels.
Let's see if it plays out.

AUDNZD Short Treade IdeaDecider (Mandatory)
Trend: Bullish
Divergence: Bearish
Reversal Pattern: Head N Shoulder
Bias: Bearish
Scenario: Sell Stop at neck line breakout
Trade Plan
Stop Loss 1.1391
Entry Level 1.135
TP1 1.131

USDJPY - Head and ShouldersHello Traders!
The USDJPY price formed a head and shoulders pattern.
Currently, the neckline is broken!
So, I expect a bearish move📉
______________
TARGET: 146.890🎯

USD/JPY: Strong Bearish Pattern SpottedThe 📉USDJPY pair formed a significant head and shoulders pattern on a four-hour timeframe.
The neckline was breached earlier today by a bearish candle with considerable momentum.
It seems plausible that the pair could experience a further decline at this point. The subsequent support level is anticipated to be around 147.77.

Btcusd h&s shortThe price action on btcusd is forming a head and shoulders pattern on the hourly timeframe.
Entry on the break of th neckline and tp to the next H4 demand zone.


Head and shoulders reversal GBPUSD longH&S reversal.
London open.
Target the next H1 supply zone
Target is 61.8% retracement level of H4 down leg.

EURUSDLast week price briefly came back to test weekly zone and got a strong bounce. This week it's above daily resistance again around 1.17200 and we can see some sort of inverse head and shoulder on the H1 & H4. There's a bullish flag pattern visible on the H1 as well.
Lets see if fundamentals will play along.

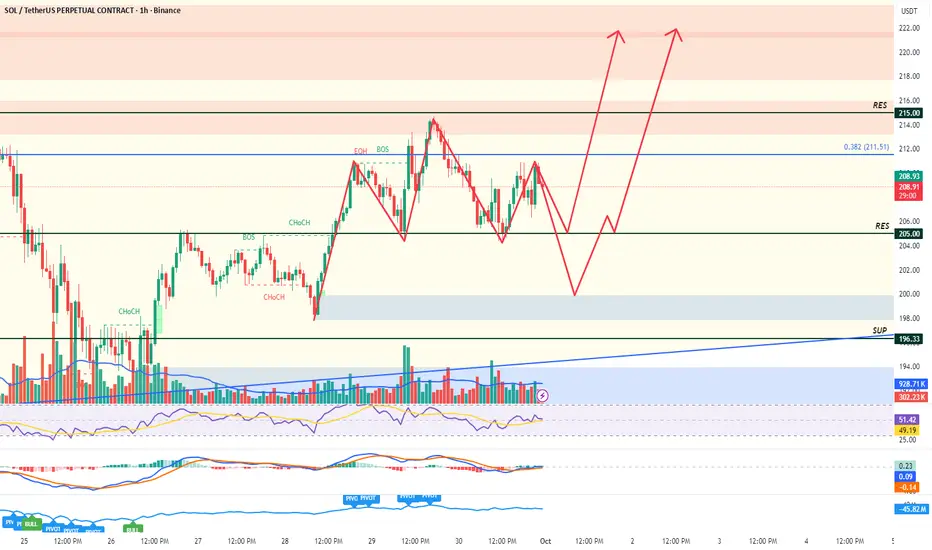
Immediate pullback followed by a runI see two possible outcomes here. Either we hit resistance at 205 and bounce to 220ish area or we break resistance and head towards 198 before we make the next move up. NFA. Happy Trading!
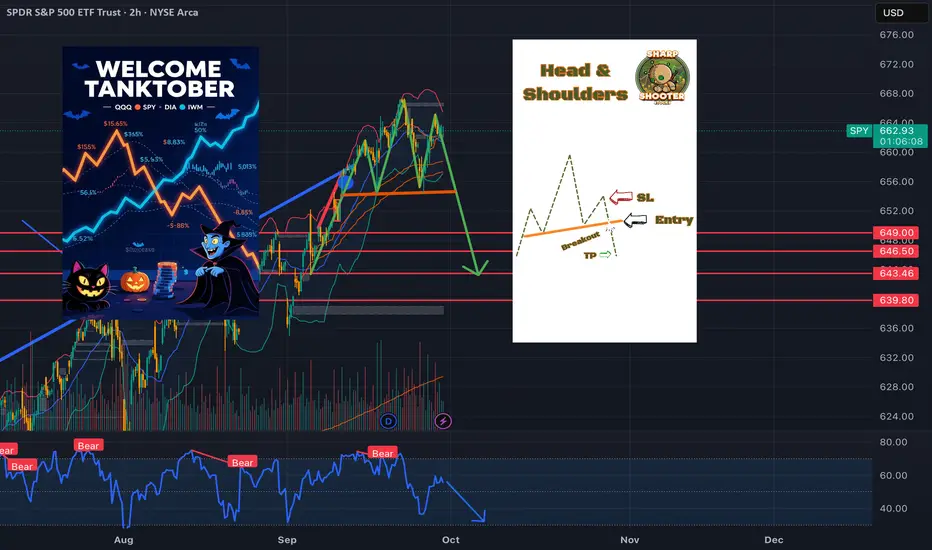
TANKTOBER!SPY eyeing a break below 6600—shutdown looms, Powell’s silence speaks volumes. Holding shorts, rolling puts into November 655s if we gap. #SharpShooterStocks #Trading #SPY #Shutdown2025
WIF back to $3Complete look at Dog WIF Hat
We had some pretty nice technical setups on this meme.
#HVF
#DoubleTop
#InverseHeadandShoulders
#BullFlag
Currently it has two active patterns ...

TANKTOBER!SPY eyeing a break below 6600—shutdown looms, Powell’s silence speaks volumes. Holding shorts, rolling puts into November 655s if we gap. #SharpShooterStocks #Trading #SPY #Shutdown2025

USDCHF BUY 0.7940On the 4-hour chart, USDCHF has formed a head-and-shoulders bottom pattern. Currently, support around 0.7940 is worth watching. Consider buying if the price stabilizes after a pullback. The upside target is around 0.8070. If the price falls below support around 0.7910, a downward trend will begin.

$HYPD at least a 3x and likely much moreNASDAQ:HYPD looks like it's forming the right leg of an inverse head and shoulders here, should it break above $17.66 and flip it as support, I think we could see an extremely large move.
I've marked off key resistance levels for price to stop at, will update the chart as price action unfolds.
