H&S on Bitcoin Daily Is Now Confirmed!Trading Fam,
Not a long post here as I have said enough on this in many of my previous posts. Just wanted to update you on the Head and Shoulders pattern. Our candle close today has now confirmed a break in the neckline. This is bad. We will now look to the weekly candle close to confirm further price action down. The weekly could save us. But this is doubtful.
Remember, I have outlined at least 6 additional strong bearish patterns in previous posts that have all been confirmed. This H&S was really the final nail in the coffin. My target down remains a rough 40-50k. If we're lucky, we'll turn up again at 60k. But that remains to be seen.
One more note and something to keep an eye on, Michael Saylor's MSTR BTC buy-in price is roughly 74k. If Bitcoin breaks below that for any sustained amount of time, things could get spicy!
The show must go on.
✌️Stew
Headshoulders

BTC at a Crossroad: Head & Shoulders or Moonshot? Analyzing the CME Bitcoin Futures chart, we can clearly see confirmation of the price gap between $92K and $94K, which significantly increases the probability of a Head & Shoulders (H&S) formation.
✅ Key Scenarios to Watch
Scenario 1 – H&S Confirmed:
Potential retracement toward $52K–$62K based on the right shoulder's depth
Scenario 2 – Failure H&S Confirmed:
Bullish breakout could push BTC toward $140K–$150K. based on the right shoulder's depth
🔍 Technical Insight
The left shoulde r formed near the Fibonacci 0.618 / 0.382 leve ls. Based on these Fib zones, the right shoulder could develop within a similar range—critical for validating the pattern if weekly closure occurs over 94K .
Disclaimer: This analysis is for educational purposes only and does not constitute financial advice. Always do your own research and manage risk appropriately before making any trading decisions.

$META: LONG SIDE OPPORTUNITY NASDAQ:META : Although it may seem incredible, the head and shoulders pattern TARGET has been reached. The stock has lost 24% of its value since hitting an all-time high in early August. The 14-period RSI indicates clear oversold conditions. Friday's hammer candlestick, combined with significant volume, is signaling a potential long-side opportunity.

NQ - Nasdaq Is Coming For Your Stop!OK, there's not much to say.
That guy looks bad. I mean, really bad §8-)
Let's see if we can use the bad mood for a nice short down to the bottom.
Ohhhh Myyyy.....

EURAUD upside is endingThe EURAUD bullish run may be coming to an end.
Price action has broken trend support and formed a head-and-shoulders trend reversal pattern.
From a fundamental perspective, the AUD is an attractive investment due to its stable inflation and robust GDP growth.
If EURAUD doesn't become bearish, we may see the price action form a consolidation.
OANDA:EURAUD FX:EURAUD

Yes the chicken man - PPC Short?PPC is at the bottom of a monthly box and at VAL of the daily and weekly anchored volume profile. It could catch a bid here and retest $45.60s(VPOC).
If the retest ends in a rejection of that area, and a daily close below the previous low around $41.95 then I expect short continuation and validation of the H&S.
I would especially like this trade after a retest and rejection of box bottom around $43.41 - $43.30.
My targets would be 40.11, 38.98, 37.27,35.96 then 33.72.

Head and Shoulders Pattern on U.S. Dollar Index (DXY) – Bearish Overview of the Idea (as shown in the chart)
The chart illustrates a Head and Shoulders (H&S) reversal pattern forming on the U.S. Dollar Index (DXY). This classical technical pattern signals a potential trend reversal from bullish to bearish.
Left Shoulder: The first peak followed by a pullback.
Head: A higher peak, forming the top of the pattern.
Right Shoulder: A lower peak compared to the head, roughly equal to the left shoulder.
Neckline: A support line connecting the lows between the shoulders. Once broken, it indicates potential bearish continuation.
The chart highlights:
A breakout below the neckline.
A retest of the neckline (common in H&S setups, where old support becomes resistance).
A projected downside target aligned with the height of the head-to-neckline move.
Detailed Analysis
1. Pattern Identification
The H&S is clear: higher high (Head) flanked by two lower highs (Shoulders).
The neckline is slightly ascending, but once broken, it signals sellers stepping in.
2. Breakout Confirmation
Price broke below the neckline, confirming the bearish pattern.
The retest at ~97.62 shows rejection, strengthening the bearish outlook.
3. Bearish Projection
Technical rule: the expected downside target is approximately equal to the distance from the head to the neckline, projected downwards from the breakout point.
The chart projects a move toward 97.25, which aligns with the marked support zone.
Timing
The projection points to Monday, 15/09/25, suggesting this bearish move may unfold in the upcoming trading sessions.
Walkthrough Thought Process
Think of the market like a battle between buyers and sellers:
The buyers pushed price higher (Head), but then failed to sustain strength at the right shoulder.
When price breaks the neckline, it shows sellers are gaining control.
The retest confirms that what was once support (neckline) has now become resistance.
This setup gives traders confidence to enter a short (sell) trade, targeting the projected downside.
Trade Idea
Entry : After retest rejection around 97.62.
Target (TP) : 97.25 (support zone based on H&S projection).
Stop Loss (SL) : Above the right shoulder at 97.80 (to protect if pattern fails).

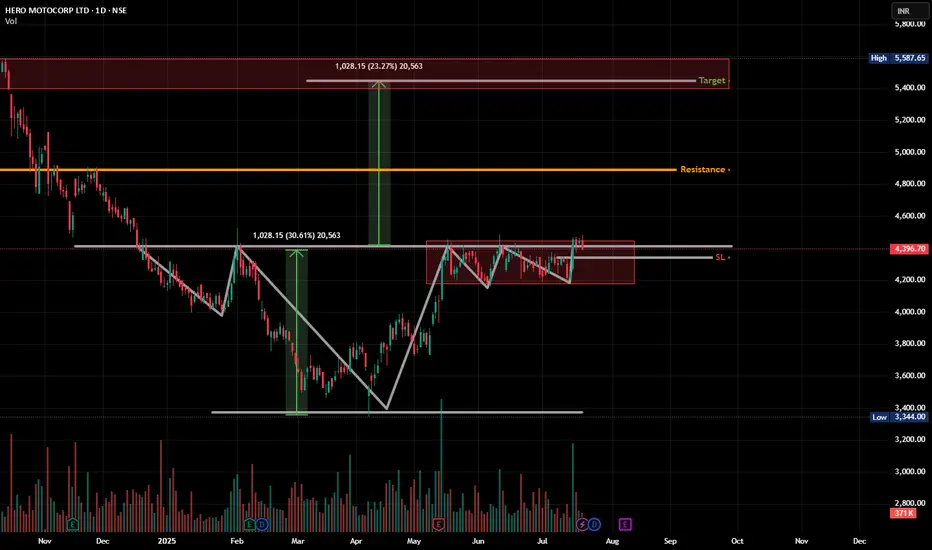
HEROMOTOCO - Multi-Right Shoulder H&S (it works out too much)Pattern Watchers!👀
We usually get one head, one left shoulder, and one right shoulder, right?
But this chart said: "Why stop at one? Let’s bulk up the right side!" 😂
🧠 Head & Shoulders spotted –
✔️ Classic neckline around ₹4390
✔️ Multiple failed breakouts but price holding above range
✔️ Right shoulder has been gymming, forming a clean range
📏 Potential breakout target = ~₹5400
🧱 Resistance zone above (highlighted in red) may act as the next boss level
🎯 Watch for:
Break and hold above ₹4450–₹4480
Volume confirmation
Avoid fakeouts — price needs to STAY above neckline
💡 Bonus thought: This could also be interpreted as an Inverse H&S breakout from March, and this range is just a healthy consolidation.
NATURAL GAS formed Head and Shoulders patternCAPITALCOM:NATURALGAS
🔍 From a longer-term perspective, I noticed that a Head and Shoulders pattern 🪖🩻 is about to form. This pattern has been forming since December 2024 and in the long term 🕰️ means no good for those who play long here 📉.
🙋♂️ Personally, I will stay aside for now and observe 👀. The asset may head towards the 3.0000 support level 🪙, where I expect a potential rebound 🔄, possibly even a retest of the trendline from below ↩️.
⏳ In the long term, the asset may even move towards the 2.0000 support level 🚨, but I will need more observation and data to be sure 🧪.
🕊️ Time will show. Thank you for the attention! 🙏

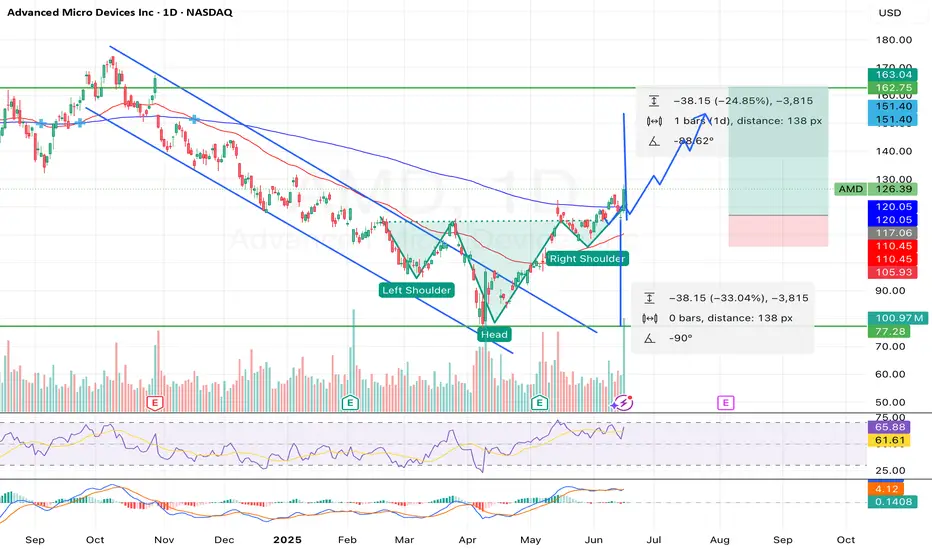
Breakout Alert: AMD Head & Shoulders Points to $160+Overview
Name: Advanced Micro Devices, Inc.
Ticker Symbol: AMD
Exchange: NASDAQ
Founded: 1969
Headquarters: Santa Clara, California, USA
CEO: Lisa Su (as of 2025)Sector: Technology / Semiconductors
About
AMD is a leading semiconductor company known for its high-performance computing and graphics solutions. It competes with Intel and NVIDIA in the CPU, GPU, and data center markets. Its product line includes Ryzen (desktop/laptop CPUs), EPYC (server CPUs), and Radeon (GPUs), with strong expansion in AI and custom silicon for next-gen applications.
Fundamentals
Earnings: AMD reported strong Q1 2025 earnings with a beat on both revenue and EPS, supported by explosive demand in the AI and data center segments.Revenue: $6.52B, up 21% YoY
Outlook: The company raised guidance for the second half of 2025 as it expects to benefit from the AI chip boom and new product rollouts.
Technicals (4H Chart)
Inverted Head and Shoulders pattern confirmed with neckline breakout around ~$117
Breakout from Falling Channel aligning with bullish reversal structure
Price surged past resistance with strong volume, currently at $126.39 (+9.71%)
RSI at 65.88, approaching overbought but not signaling weakness
MACD bullish crossover, confirming momentum
Short-term target range: $145–$150, with extended projection up to $162.75
📌 Support Levels: $117, $111.50📈 Target Price (TP): $162.75 (based on pattern breakout height projection)
💡 My Take
AMD just pulled off a textbook bullish reversal — inverted head and shoulders breakout combined with a falling channel exit. With strong macro trends in AI hardware and data center expansion, this move feels well-supported fundamentally and technically.
The clean neckline breakout and explosive candle suggest continuation. I am expecting a potential consolidation around $130–$135ish before next leg to $150+. If momentum holds, $162+ is possible before August.
💼 Position
Type: AMD 145 Call
Expiry: July 03, 2025
Quantity: 15
Average Cost Basis: $.038
Date Purchased: June 12, 2025
Last Price: $0.47
Total % Gain/Loss: +23.4%
I entered after the neckline break and riding the wave. AMD’s setup is too clean to ignore — high conviction play.
How to Spot Head & Shoulders Patterns in TradingViewDiscover how to identify and validate Head & Shoulders patterns using TradingView's built-in pattern recognition tools in this detailed tutorial from Optimus Futures. Chart patterns are essential tools for many futures traders, and the Head & Shoulders formation is among the most recognized reversal patterns in technical analysis.
What You'll Learn:
• Understanding the Head & Shoulders pattern: a key reversal formation in technical analysis
• How to access and use TradingView's pattern drawing tools and objects
• Step-by-step process for identifying potential Head & Shoulders formations on any timeframe
• Techniques for spotting the "head" by locating the highest high or lowest low pivot points
• How to identify matching "shoulders" on either side of the head formation
• Validating your pattern identification using TradingView's drawing tools
• Real-world example using crude oil futures on an hourly chart from October 2024
• Key characteristics that distinguish bearish Head & Shoulders reversal patterns
• Best practices for using pivot points and swing analysis in pattern recognition
This tutorial may benefit futures traders, swing traders, and technical analysts who want to improve their chart pattern recognition skills in TradingView. The techniques demonstrated could help you identify potential reversal opportunities and make more informed trading decisions when these classic formations appear on your charts.
Keywords: Head and Shoulders pattern, TradingView tutorial, chart patterns, technical analysis, reversal patterns, futures trading, pivot points, swing analysis, pattern recognition, trading education
Visit Optimus Futures to learn more about trading futures with TradingView:
optimusfutures.com
Disclaimer:
There is a substantial risk of loss in futures trading. Past performance is not indicative of future results. Please trade only with risk capital. We are not responsible for any third-party links, comments, or content shared on TradingView. Any opinions, links, or messages posted by users on TradingView do not represent our views or recommendations. Please exercise your own judgment and due diligence when engaging with any external content or user commentary.
This video represents the opinion of Optimus Futures and is intended for educational purposes only. Chart interpretations are presented solely to illustrate objective technical concepts and should not be viewed as predictive of future market behavior. In our opinion, charts are analytical tools—not forecasting instruments. Market conditions are constantly evolving, and all trading decisions should be made independently, with careful consideration of individual risk tolerance and financial objectives.

Shoulders to the Sky: Amazon’s Breakout Journey BeginsOverview
Name: Amazon.com, Inc
Ticker Symbol: AMZN
Exchange: NASDAQ
Founded: 1994
Headquarters: Seattle, Washington, USA
CEO: Andy Jassy (as of 2025)
Sector: Consumer Discretionary / E-commerce & Cloud Computing
About
Amazon is a global e-commerce and cloud services powerhouse. It dominates online retail while also operating AWS (Amazon Web Services), one of the world’s leading cloud computing platforms. Other segments include advertising, logistics, streaming, AI hardware (Alexa), and physical retail.
Fundamentals
Earnings: Amazon has consistently beaten revenue expectations with strong growth in AWS and advertising segments.Revenue: Q1 2025 revenue topped $154.8B, up 13% YoY, with solid margins.Outlook: Management has raised guidance for Q2 citing AI integration in AWS and retail efficiency gains.
Technicals
Inverted Head and Shoulders Pattern confirmed on the daily chart — a strong bullish reversal signal.
Price has broken above the neckline (~$213–$215) with volume confirmation.
Golden Cross forming on short-term MAs — bullish signal.
RSI is around 64, suggesting momentum remains but is nearing overbought.
MACD is bullish with widening divergence — supports potential continuation.
📌 Support Zones: $202, $199
📈 Resistance / Target Zones: $217 (short-term), $235 (TP), $242 (extension)
💡 My Take
AMZN is showing bullish continuation out of a textbook inverted head and shoulders — typically a strong reversal setup after a downtrend. We’ve seen the neckline break with follow-through, and volume patterns support the move.
While the RSI shows slight overbought conditions, this could lead to a short consolidation before another leg up toward $235–$242. With macro tailwinds from cloud and advertising sectors, AMZN is positioned well for a strong Q3 rally.
Position
Type: AMZN 235 Call
Expiry: July 11, 2025
Quantity: 7
Average Cost Basis: $1.00
Last Price: $0.69
Purchase Date: June 12, 2025
Total % Gain/Loss: –30%
Despite current drawdown, I remain optimistic about AMZN's momentum. The technical setup is strong, and short-term weakness is likely just healthy consolidation. I'm holding through July with my eyes on the $235 target.

Shoulder on Shoulder - Need a dump this Week😥 The past week was complicated, and I don't want to bore you with all the political goings-on, which I hope you're already aware of. I'm a bit short on time right now, but I still wanted to share this perspective with you all.
💁♂️ It is Shoulder on Shoulder H&S everywhere!
💡 My concept of a plan:
🧗 Let's climb the Pinky way down
3289 - Actual Price
3271 - 🏁 S1
3232 - 🚪 Pink Neckline entry
3245 - 🤞 S2 & Head of White reverse H&S
3204 - 👀 Pink Start from Left Shoulder
3184 - 🎯 TP 1 - Fibo 1.272
3163 - 🎯 TP 2 - Fibo 1.414 or 3166
3134 - 🎯 TP 3 - Fibo 1.618 or 3154
3120 - 👀 Head of Yellow reverse H&S
3079 - 🎯 TP 4 - Fibo 2
🗣️ Important: FED Chair Powell speaking June 02 Mon at 1 PM EDT
What are your toughts about this? Please write it in the comments.
-------------------------------------------------------------------------
This is just my personal market idea and not financial advice! 📢 Trading gold and other financial instruments carries risks – only invest what you can afford to lose. Always do your own analysis, use solid risk management, and trade responsibly.
Good luck and safe trading! 🚀📊

Possible Reverse Head and Shoulders?👁️🗨️ The strong uptrend yesterday, followed by the downtrend during the Asian session, has built a possible inverse head and shoulders pattern (30 min chart) 🤷🏼♂️.
⏫ If an uptrend follows today, the pattern will be complete.
The right shoulder began around $3287, which isn't far from the current price.
👀 Keep an eye on this, as it could drop lower while still keeping the structure intact.
⚡ What's very interesting is that the downward trendline (strong resistance) crosses the neckline support if the time window allows.
🙏 Possible target points:
TP 1: $3358
TP 2: $3382
What are your toughts about this? Please write it in the comments.
-------------------------------------------------------------------------
This is just my personal market idea and not financial advice! 📢 Trading gold and other financial instruments carries risks – only invest what you can afford to lose. Always do your own analysis, use solid risk management, and trade responsibly.
Good luck and safe trading! 🚀📊

EURUSD | Head‑&‑Shoulders on the Brink – Bears Eye 1.1250📉 Trade Thesis
A textbook Head‑and‑Shoulders has completed on the 30‑min EURUSD chart. Price is now testing the rising neckline drawn from mid‑April swing lows. A clean close and retest beneath that trendline opens room toward the next demand shelf and the lower boundary of the broader ascending channel.
🎯 Execution Plan
Entry: wait for a decisive candle close below the neckline, then look to short on a minor pull‑back into that broken support.
Stop: just above the right‑shoulder high to keep risk tight.
Target: the measured‑move objective sits near the channel median/support cluster highlighted on the chart; scale out as price approaches that zone.
🧩 Confluence Factors
Momentum loss: RSI made a lower peak on the “head” versus the prior thrust, signalling fading upside energy.
Event risk: upcoming NFP/ISM releases may fuel USD volatility, providing the catalyst for a break.
Structure: the right shoulder’s supply shelf has capped every rally since late April, reinforcing bearish pressure.
⚠️ Risk Management
Macro data can produce whipsaws—size positions accordingly and stick to the plan. Move stops to breakeven once price pushes convincingly away from the neckline.
For educational purposes only. Trade your own strategy & manage risk.

Possible H&S Forming – It’s All About the News NowOANDA:XAUUSD
📉 Watching closely: Possible Head and Shoulders formation developing on the 4H and 1H charts
As of April 24, 2025, Gold (XAU/USD) is forming a potential Head and Shoulders pattern on the shorter timeframes (4H and 1H), which could indicate a reversal setup. While multiple scenarios are still in play, the price action around the $3368 level will be crucial.
If price fails to break above this resistance in the near term, it could suggest weak bullish momentum and open the door for a pullback toward and possibly below the neckline around $3250 .
🔔 Key Economic Events – April 24
08:30 EDT – Durable Goods Orders MoM
Forecast: +2.0%
Personal outlook: Numbers might come in weaker than forecasted.
Durable goods orders are a solid gauge of industrial demand. Weaker-than-expected numbers would likely weaken the USD and could offer some upside pressure on Gold.
10:00 EDT – Existing Home Sales
Forecast: Lower than previous.
As a key barometer of consumer confidence and economic stability, lower-than-expected figures could also put pressure on the USD, potentially providing Gold a short-term bullish impulse.
📊 Potential Scenarios
Scenario 1 – Bullish Breakout
Weak economic data → USD weakens → Gold spikes above $3400
If both data points disappoint, we could see a rally in Gold, possibly breaking the resistance and invalidating the H&S pattern.
Scenario 2 – Bearish Breakdown (Preferred H&S Scenario)
Strong data → USD strengthens → Gold falls below $3200
While less likely, if economic data comes in stronger than forecasted, Gold could see a significant drop, forming the right shoulder and breaking the neckline – confirming the Head & Shoulders reversal.
Scenario 3 – Sideways Movement
Neutral data + Tariff talks in focus
In the absence of impactful data or if figures come in as expected, Gold might consolidate sideways. Ongoing developments around US-China tariff negotiations could dominate sentiment, delaying or nullifying the H&S pattern entirely.
📉 Market Sentiment Snapshot
US stocks are rallying on optimism around tariff reductions
Trump administration signaling potential easing of China tariffs
➡️ Gold under pressure as risk-on sentiment rises
📍 Conclusion
Keep an eye on the $3368 level and $3250 neckline. Short-term moves will likely be dictated by today’s economic releases and the evolving trade narrative. A confirmed break below the neckline would validate the bearish H&S scenario with potential downside toward $3200 and below.
👉 Stay nimble and trade the reaction, not just the forecast.
-------------------------------------------------------------------------
This is just my personal market idea and not financial advice! 📢 Trading gold and other financial instruments carries risks – only invest what you can afford to lose. Always do your own analysis, use solid risk management, and trade responsibly.
Good luck and safe trading! 🚀📊

Head and Shoulders Pattern: Advanced Analysis for Beginners█ Head and Shoulders Pattern: Advanced Analysis for Beginners
The Head and Shoulders pattern is one of the most widely recognized and reliable patterns in technical analysis. And today, I am going to teach you how to use it as efficiently as an experienced trader would.
Learning to spot and trade this pattern can be a great asset in your tool belt —whether you’re trading stocks, forex, or cryptocurrencies.
The Head and Shoulders is a well-known reversal pattern in technical analysis that signals a potential trend change.
⚪ It consists of three peaks:
The Left Shoulder: A peak followed by a decline.
The Head: A higher peak formed after the left shoulder, followed by a decline.
The Right Shoulder: A smaller peak resembling the left shoulder, followed by another decline.
When these peaks form in a specific order and the price breaks below the neckline (the line connecting the two troughs between the shoulders), it indicates a bearish reversal from an uptrend to a downtrend.
█ What about Bullish reversals? Don’t worry — there's good news!
Conversely, the Inverse Head and Shoulders pattern forms at the bottom of a downtrend and signals a potential reversal to the upside. By recognizing the pattern early, you can position yourself for a high-probability trade with a clear entry and exit strategy.
█ How to Identify a Head and Shoulders Pattern?
I truly believe the best way to learn any trading strategy is to keep it simple, away from the “technical” jargon unless absolutely necessary. We’ll do the same with this strategy.
Despite its varied usage, you can break it down into four simple steps:
1. Look for the Left Shoulder
The first part of the pattern forms when the price rises , creating a peak. Then, it declines back down to form the trough . This creates the Left Shoulder of the pattern.
Example: If the price of Bitcoin (BTC) rises from $85,000 to $90,000, and then declines to $87,500. This is your Left Shoulder.
2. Spot the Head
The second part of the pattern is the Head . After the Left Shoulder, the price rises again , but this time, it forms a higher peak than the Left Shoulder. The price then declines again, creating a second trough .
Example: Continuing with Bitcoin, after the price dropped to $87,500, it rises to a new high of $95,000 before dropping back to around $90,000. This $95,000 peak is the Head, which is higher than the Left Shoulder.
3. Find the Right Shoulder
After the decline from the Head, the price rises again, but this time, the peak should be smaller than the Head, forming the Right Shoulder . The price then starts declining again, and this is where the neckline is formed (connecting the two troughs).
Example: Bitcoin then rises from $90,000 to $92,000 (lower than the $95,000 peak). This forms the Right Shoulder, and the price starts to decline from there.
4. Draw the Neckline
The neckline is drawn by connecting the lows (troughs) between the Left Shoulder and the Head, and between the Head and the Right Shoulder. This is your key reference level.
█ How to Trade the Head and Shoulders Pattern
Once you've spotted the Head and Shoulders pattern on your chart, it’s time to trade it. And yes, it did need a separate section of its own. This is where most amateur traders mess up - the finish line.
1. Wait for the Neckline Breakout
The most crucial part of the Head and Shoulders pattern is the neckline breakout . This is when the price breaks below the neckline, signaling the start of the trend reversal.
Example: After the price rises to form the Right Shoulder at $92,000, Bitcoin then drops below the neckline (around $90,000). This is the confirmation that the pattern is complete. The price of BTCUSD is likely to continue downward past the 90k mark.
2. Enter the Trade
Once the price breaks below the neckline, enter a short position (for a bearish Head and Shoulders pattern). This is your signal that the market is reversing from an uptrend to a downtrend.
3. Set Your Stop Loss
Your stop loss should be placed just above the right shoulder for a bearish Head and Shoulders pattern . This makes sure you are protected in case the pattern fails and the price reverses back upward.
Example: Place your stop loss at around $93,000 (just above the Right Shoulder at $92,000) on BTCUSD.
You can also try one of these strategies I have used in the past:
⚪ Conservative Stop: Place the stop above the head (for bearish H&S) or below the head (for bullish iH&S) for maximum safety.
⚪ Aggressive Stop: Place the stop above the right shoulder (for bearish H&S) or below the right shoulder (for bullish iH&S) to reduce your stop size.
⚪ Neckline Reclaim Invalidation: Exit the trade if the price reclaims the neckline after breaking it. This could be an indication of a false positive/invalid pattern.
4. Set Your Profit Target
To calculate your profit target, measure the distance from the top of the Head to the neckline and project that distance downward from the breakout point.
Example: The distance from the Head at $95,000 to the neckline at $90,000 is $5,000. So, after the price breaks the neckline, project that $5,000 downward from the breakout point ($89,800), which gives you a target of $84,800.
5. Monitor the Trade
We’re in the home stretch now, people. This is the 9th inning.
There’s only one job left: keeping an eye on any retests or contrarian moves.
As the price moves in your favor, you can scale out or move your stop loss to break even to lock in profits.
█ What makes H&S strategy an all-time classic?
It’s simple. It works.
This pattern works because it reflects a shift in market sentiment:
In a Head and Shoulders pattern , the uptrend slows down as the market struggles to make new highs, and then the price ultimately breaks down, signaling that the bulls have lost control.
In an Inverse Head and Shoulders pattern , the downtrend weakens as the market fails to make new lows, and the price breaks upwards, signaling a bullish reversal.
⚪ Here are a few points to remember as a cheatsheet for Head and Shoulders patterns:
Wait for the neckline breakout to confirm the pattern.
Set a stop loss above the right shoulder for protection.
Project the price target using the height of the head for a realistic profit goal.
Always monitor the trade for any signs of reversal or false breakouts.
Mastering this pattern can be a game-changer for any trader, but like any tool, it’s only effective when combined with other indicators, strategies, and a solid risk management plan.
-----------------
Disclaimer
The content provided in my scripts, indicators, ideas, algorithms, and systems is for educational and informational purposes only. It does not constitute financial advice, investment recommendations, or a solicitation to buy or sell any financial instruments. I will not accept liability for any loss or damage, including without limitation any loss of profit, which may arise directly or indirectly from the use of or reliance on such information.
All investments involve risk, and the past performance of a security, industry, sector, market, financial product, trading strategy, backtest, or individual's trading does not guarantee future results or returns. Investors are fully responsible for any investment decisions they make. Such decisions should be based solely on an evaluation of their financial circumstances, investment objectives, risk tolerance, and liquidity needs.

AUDUSD Potential SellsFX:AUDUSD is definitely interesting rn. I can see AU selling to the 0.6200 area based of H4/Daily head & shoulders pattern. If price breaks daily support/head & shoulders neckline, then that'll give me more confirmation to look for sells.

USD/CHF: Selling the Head & Shoulders BreakdownSpotted a clear H&S pattern on USD/CHF 15m chart!
Selling at 0.8826 with stop above 0.8844.
Target: First 0.8815, then possibly lower to the -0.27 Fib level.
The neckline break looks solid and we're still in the channel. Risk-reward looks good here.
What do you think? Are you bearish on USD/CHF too?
#USDCHF #Forex #TradingIdea

The Head and Shoulders Pattern: How to TradeHello, Traders!
Have you ever noticed price action forming three peaks, with the middle one standing taller than the others? If so, you’ve spotted the head and shoulders pattern, one of technical analysis's most well-known and reliable reversal patterns. Whether you’re trading stocks, forex, or crypto, the head and shoulders chart pattern can provide high-probability setups for both bullish and bearish trades. But is the pattern of the head and shoulders bullish or bearish? The answer depends on its structure.
Let’s dive into what a head and shoulders pattern is, how to identify it, and how to trade both the classic and inverse head and shoulders patterns effectively.
What Is a Head and Shoulders Pattern?
The head and shoulders trading pattern is a reversal formation that signals a shift in trend direction. It consists of three peaks:
Left Shoulder – A price rise, followed by a temporary decline.
Head – A higher peak, followed by another drop.
Right Shoulder – A lower peak that struggles to reach the height of the head, signaling weakness in the trend.
Neckline – A support level connecting the lows of the left shoulder and the right shoulder. The breakout below this level confirms the reversal.
The head and shoulders stock pattern typically appears at the top of an uptrend, indicating a potential trend reversal to the downside.
Is the Head and Shoulders Pattern Bullish or Bearish?
The classic head and shoulders pattern is bearish, which usually signals that buyers are losing strength and sellers are taking control. Traders use it to identify potential downtrends and short-selling opportunities.
However, the reverse head and shoulders pattern, also known as the inverted head and shoulders pattern, is bullish and might signal the start of an uptrend.
The head and shoulders candlestick pattern is considered to be most effective when combined with volume analysis—high selling volume at the neckline is thought to confirm the breakdown.
Head and Shoulders vs. Other Reversal Patterns
The head and shoulders chart pattern is one of the most reliable reversal formations, but how does it compare to others?
Head and Shoulders vs. Double Top – The head and shoulders pattern includes three peaks, while a double top has only two.
Head and Shoulders vs. Triangle – Triangles are continuation patterns, while the head and shoulders candle pattern signals reversal.
Final Thoughts: Why the Head and Shoulders Pattern Matters
The head and shoulders trading pattern is considered to be powerful for identifying trend reversals. Whether you’re trading a head and shoulders, a pattern bullish setup with an inverted head and shoulders pattern, or a bearish reversal with the classic formation, mastering this strategy can improve your trading accuracy.
So, traders, have you used the head and shoulders chart pattern in your strategy? What’s your success rate with it? Let’s discuss it!

Chart Patterns That Keep Showing Up (Are Traders Predictable?)In the grand theater of financial markets, traders often fancy themselves as rational actors, making decisions based on cold, hard data. Yet, time and again, their collective behavior etches familiar patterns onto price charts, as if choreographed by an unseen hand (the Invisible Hand?)
All across the world economy , markets trade in patterns. The trick is to spot those patterns before they unfold.
These recurring formations, known as chart patterns, are a testament to the predictability of human psychology in trading. Let's rediscover some of these enduring patterns, exploring why they persist and how you can leverage them.
🚿 The Head and Shoulders: More Than a Shampoo Brand
Imagine a market trend as a partygoer who's had one too many. Initially, they're lively (the left shoulder), then they reach peak status of euphoria (the head), but eventually, they slump with one last “let’s go party people” (the right shoulder). This sequence forms the Head and Shoulders pattern, signaling a trend reversal from bullish to bearish.
Traders spot this pattern by identifying three peaks: a central, higher peak flanked by two lower, similar-sized peaks on each side. The neckline, drawn by connecting the lows between these peaks, becomes the critical support level. A break below this line suggests the party's over, and it's time to exit or short the trading instrument.
Conversely, the Inverse Head and Shoulders indicates a reversal from bearish to bullish, resembling a person doing a headstand—a strong sign the market's ready to flip.
Ready to hunt down the charts for some Head and Shoulders? Try out the Head and Shoulders drawing tool .
⛰️ Double Tops and Bottoms: Déjà Vu in Trading
Ever experience déjà vu? The market does too, in the form of Double Tops and Bottoms. A Double Top resembles the letter "M," where the price hits a high, retreats, and then tests that high again before declining. It's the market's way of saying, "I've been here before, and I'm not going higher."
The Double Bottom, shaped like a "W," occurs when the price drops to a low, rebounds, and then retests that low before rising. It's akin to the market finding a sturdy trampoline at support levels, ready to bounce back.
These patterns reflect traders' reluctance to push prices beyond established highs or lows, leading to reversals.
⚠️ Triangles: The Market's Waiting Game
When traders are indecisive, prices often consolidate, forming Triangle patterns. These come in three flavors:
Ascending Triangle : Characterized by a flat upper resistance line and a rising lower support line. Buyers are gaining strength, repeatedly pushing prices up to a resistance level. A breakout above this resistance suggests bullish momentum.
Descending Triangle : Features a flat lower support line and a descending upper resistance line. Sellers are in control, and a break below support signals bearish continuation.
Symmetrical Triangle : Both support and resistance lines converge, indicating a standoff between buyers and sellers. The eventual breakout can go either way, and traders watch closely for directional cues.
Triangles epitomize the market's pause before a storm, as participants gather conviction for the next move.
Feel like looking for some triangles on charts? Jump straight to our easy-to-use Triangle Pattern drawing tool .
🏁 Flags and Pennants: The Market Takes a Breather
After a strong price movement, the market often needs a breather, leading to Flags and Pennants. These are short-term continuation patterns that indicate a brief consolidation before the trend resumes.
Flag : Resembles a parallelogram sloping against the prevailing trend. It's like the market catching its breath before sprinting again.
Pennant : Looks like a small symmetrical triangle that forms after a sharp move. Think of it as the market pitching a tent before continuing its journey.
Recognizing these patterns helps traders position themselves for the next leg of the trend.
🧠 The Psychology Behind Pattern Persistence
Why do these patterns keep appearing? The answer lies in human psychology. Traders, despite access to vast information, are influenced by emotions like fear and greed. This collective sentiment manifests in predictable ways, creating patterns on charts.
For instance, the Head and Shoulders pattern emerges because traders, after pushing prices to a peak, become cautious. Early sellers take profits, causing a dip. A second rally (the head) attracts more participants, but if it fails to sustain, confidence wanes, leading to a sell-off. The final attempt (right shoulder) lacks conviction, and once support breaks, the downtrend ensues.
Understanding the emotional drivers behind these patterns allows traders to anticipate moves and strategize accordingly.
🎯 Using Patterns to Your Advantage
While recognizing patterns is valuable, it's crucial to approach them with a discerning eye:
Confirmation is Key : Don't act on a pattern until it's confirmed. For example, in a Head and Shoulders, wait for a break below the neckline before taking a position.
Volume Matters : Volume often validates a pattern. A genuine breakout is usually accompanied by increased trading volume, indicating strong participation.
Contextual Awareness : Consider the broader market context. Patterns can yield false signals in volatile or news-driven environments.
Risk Management : Always set stop-loss orders to protect against unexpected moves. Patterns suggest probabilities, not certainties.
🧬 The Evolution of Patterns in Modern Markets
In today's algorithm-driven trading landscape, one might wonder if traditional chart patterns still hold relevance. Interestingly, even sophisticated trading algorithms (those used by hedge funds and investment managers) are programmed based on historical patterns and human behavior, perpetuating the cycle.
Moreover, as long as markets are driven by human participants, emotions will influence decisions, and patterns will emerge. The tools may evolve, but the underlying psychology remains constant.
🤗 Conclusion: Embrace the Predictability
In the volatile world of trading, chart patterns serve as a bridge between market psychology and price action. They offer insights into collective behavior, providing traders with a framework to anticipate movements.
By studying these recurring formations, traders can align their strategies with market sentiment, turning the predictability of human nature into a trading edge.
What’s your go-to technical analysis pattern? Are you and H&S trader or maybe you prefer to trade double tops? Share your approach in the comments!

GBPCHF - Head and Shoulders SetupHello traders,
On the daily timeframe GBPCHF has been consolidating in a range. Now it is at the resistance level of the range and so we should be looking for shorting opportunities.
On the lower timeframes, the 4H and 2H, it has formed a head and shoulders pattern which is a great reversal pattern.
Add to this the RSI divergence which in many occasions foreshadows the change in trend.
I will be entering when we get a close below the neckline on the 2H timeframe.

8h Chart Head & ShouldersBull and bear targets on the chart.
Conditions for Bear - lose 91.4k and fail to reclaim
Bear Targets TP 1 and 2:
- approx 77k
- approx 71k
Conditions for Bull - reclaim 102.750 and hold above.
Bull Targets TP 1 and 2:
- approx 122k
- approx 133k
