Copper – Targets for the Year: 15,760 > 16,600 – 16,800 > 14,800Good day, friends. Today we will try to analyze the current situation in the copper market for this year and identify key targets for the year. Let's start with the news that had the biggest impact:
🔴 Codelco — El Teniente: Tunnel Collapse (July 2025) A tragedy at the world's largest underground copper mine, caused by seismic activity triggered by mining operations. Current Situation:
Partial resumption — 8 underground sectors deemed safe are operational, running at ~75% capacity
Production Losses in 2025: 48,000 tonnes of copper
❌ Exact recovery date not announced. Forecast — no earlier than late 2026.
Codelco — A Chilean state-owned company and the world's largest copper producer. Operates legendary deposits: • El Teniente — the world's largest underground copper mine • Chuquicamata — one of the largest open-pit mines • Radomiro Tomic — high-grade ore Codelco faces challenges: aging assets, declining copper ore grades, and the need for large-scale investments in modernization.
🔴 Freeport-McMoRan — Grasberg: Landslide and Force Majeure (September 2025) A serious incident at one of the world's largest copper mines Force majeure declared on deliveries
Recovery Plan: • Big Gossan and Deep MLZ mines (unaffected) restarted in Q4 2025 • Main mine Grasberg Block Cave — phased restart from Q2 2026 Phase 1 - Q2 2026 - Beginning of phased restart of Grasberg Block Cave Phase 2 - H2 2026 - Reaching 85% capacity Full Recovery - 2027 - 100% capacity
Freeport-McMoRan (FCX) An American company with the world's most profitable copper mine — Grasberg in Indonesia. Key facts:
• Grasberg is also one of the largest gold deposits (gold bulls send their regards) • Largest copper producer in the USA (Morenci mine in Arizona) • Actively developing underground mining at Grasberg
🔴 DR Congo — Copper Mine Collapse (November 2025) This is not a major corporate mine, but the incident highlights the risks of mining in the region. • African Copper Belt — DR Congo and Zambia are attracting major investments
✅ Kamoa-Kakula — Smelter Launch (November 2025) This is the biggest event in the industry. Estimated Smelter Capacity - 500,000 tonnes/year (direct-to-blister) Product - Copper anodes (first melt completed) Production in 2025: 388,838 tonnes of copper in concentrate Forecast for 2026: Sales 20,000 tonnes above production (inventory realization)
p.s. There is no incentive to sell inventory now; better to wait for price growth and sell in Q2 2026 for higher margins.
Ivanhoe Mines and Zijin Mining launched their own 500,000 tonnes/year smelter directly on-site in DR Congo. This allows production of high-purity copper anodes instead of exporting concentrates, significantly increasing margins.
🟡 Escondida and Zaldivar — Strike (January 2026) The world's largest copper mine is experiencing disruptions. Protesters are blocking access roads to the mines. Blockades affect access to Escondida (BHP) and Zaldivar in the La Negra industrial sector, Chile.
📈 Factors Supporting DEMAND
China — Massive investments in renewable energy Target by 2035 - 3,600 GW of solar and wind capacity (new commitment) State Grid Investments - 89 billion USD planned for 2025 — a record level Each GW of solar capacity requires ~2,500-5,000 tonnes of copper . Grid expansion and energy storage require even more. This creates sustainable long-term demand.
USA — Tariff Policy (Section 232) November 1, 2025 - 25% tariff imposed on imports of medium and heavy trucks and parts November 14, 2025 - Framework agreement announced with Switzerland and Liechtenstein (rate reduction) November-December 2025
Impact on copper Tariff uncertainty stimulated frontloading by American importers, temporarily boosting demand.
Electric Vehicles — Continued Growth In 2025, over 18.5 million electric vehicles were sold globally, accounting for ~25% of new sales. Each EV contains 80-100 kg of copper (4 times more than ICE vehicles).
Summary November 2025 became a turning point for the copper market: The combination of factors — China's massive investments in renewable energy, US tariff policy, and multiple disruptions at the world's largest mines — created a powerful bullish impulse that supported prices above 13,000 USD/tonne. Particularly significant is that the three largest producers (El Teniente, Grasberg, Escondida) simultaneously faced problems, which is a rare coincidence that amplified the supply deficit.
Now for the technical analysis. In this forecast, we use Fibonacci extension zones for price and time, projecting onto the industry information and expected events we've gathered. The overall trend is bullish. I assume that the current uncertainty with strikes will last up to 2 months, and we will observe sideways movement for some time while buyers accumulate positions and replenish inventories for subsequent resale, amid growing demand and increasing deficit due to accidents at major facilities.
Next — growing demand (including the new Kamoa-Kakula smelter) will push the price toward 15,760 – 15,800 (which we should reach by May).
Then — relative price stabilization in the range of 15,780 – 16,600 Likely price breakout ~ 16,800
After which , amid news of the restart of Grasberg Block Cave and other damaged mines, as well as news of increased copper production in DR Congo , buyers will take profits , leading to a phased price correction .
As copper production in DR Congo continues to grow:
2025 - ~3,210 thousand tonnes | +0.3%
2026 (forecast) - ~3,404 thousand tonnes | +6%
First correction target: ~ 14,800
Second target: ~ 13 200
What do you think?
With Respect to Everyone, Your #SinnSeed
Copper Futures HG1!

Copper - Next for the parabolic?Price kicked off in 2002,
ever since then it's been a parabolic rise on both the upside and the downside.
Given that the world needs copper for datacentres and power, and datacentres are currently sucking most of the inventory for DDR5 and hard drives, both have gone 300% and 200% respectively in Jan 2026 in last 6 months.
this is a train that can't stop any time soon.
sell your gold, buy copper ftw!
jk, never sell your gold

COPPER Time to turn bearish long-term?It's been more than 4 months (September 03 2025, see chart below) since we had a look at Copper (HG1!), giving a strong buy signal right at the bottom of the 4.5-year Rising Wedge, which went straight to our 6.000 Target:
By doing so, the price hit the top of this pattern and for practically the last 3 weeks, it's been trading sideways, getting rejected twice on that Higher Highs trend-line, unable to close a 1W candle above.
As a result, we treat this as a Sell Signal, given also the fact that the 1W RSI is getting rejected just below the 70.00 (overbought) Resistance, where we got the last 2 Sell Signals on the July 21 2025 and March 24 2025 Highs.
All Bearish Legs on this Rising Wedge have pulled back to at least their respective 0.618 Fibonacci retracement levels, making contact with the 1W MA100 (green trend-line). As a result, our Target is at 5.000, marginally above the 0.618 Fib level.
---
** Please LIKE 👍, FOLLOW ✅, SHARE 🙌 and COMMENT ✍ if you enjoy this idea! Also share your ideas and charts in the comments section below! This is best way to keep it relevant, support us, keep the content here free and allow the idea to reach as many people as possible. **
---
💸💸💸💸💸💸
👇 👇 👇 👇 👇 👇

Gold, Silver, Copper Futures Positionings ComparedUsing the latest weekly Commitment of Traders (COT) data, I look at how futures traders are positioned in gold, silver and copper. Together, they tell three very different stories — one that looks undervalued, another that appears overextended, and a third that makes me nervous.
MS.

Copper Map: Price Could Hit $8 Then $10 On Projected Deficit Huge impulse is underway on Copper Futures quarterly chart
The metal price was under pressure since Great Financial Crisis
as you can see it was in huge Triangular consolidation from 2008 till 2020
The metal rose from the ashes in 2020 breaking out of Triangle
It hit the record high $5 mark in 2022 as I labeled it as wave 1 in projected
5 wave sequence
Wave 2 was textbook perfect as it retraced the first wave by 61.8% exactly (Fibonacci ratio)
Wave 3 has been confirmed since the price overcame the peak of wave 1 beyond $5
It can hit 1.618x of wave 1 from the bottom of wave 2 at $8.1
Waves 4 and 5 are not calculated as we should wait to see how wave 3 unfolds
This map aligns with the projection of deficit of Copper by 2030

CopperXCUUSD
- Fair Value Gap
- Demand Zone
- Fibonacci Level - 61.80%
- Order Block
- Completed " 12345 " Impulsive Waves

COPPER IS PRIMED AND READYSo this decade precious metals have finally shown volatility. Gold and Silver have been a highlight especially with the past Administration boasting EV, GREEN-NEW DEAL, and now with AI; Precious metals are showing that people as of right now prefer a physical safe haven asset rather than “code” like cryptocurrency. Even now with the Trump administration, space exploration and the ongoing need and increasing demand for more precious metals is obviously making these assets worth looking at BUT one metal that stands out the most but no one is talking about, is COPPER (CU)!
COPPER is by far primed and ready to show what its really made of. Often overlooked, with pennies being disclosed as being “worthless,” it takes more to produce 1 penny than what its actual value is, with only 2-4% of modern day pennies being made of Copper (CU) and 96%+ being zinc and other over supplied metals. Why?
By 2026 the US Government will stop printing pennies, and any 1 cents transactions will now be rounded to the nearest Nickel.
Gold and Silver showed similar chart patterns, and experienced almost the same innovations that lead to its increase demand thus leading to price being bullish as well. One thing that leads me to believe COPPER IS VERY UNDERVALUED is the FACT that silver mining and gold mining can be done by basically any individual with an increased appetite to fund a business venture of 1mil+, and in this day and age thats more common than you think. But copper mining takes at least 10times more money, and it takes at least 15 years to get a Copper Mine up and ready before you start to dig your first ore. With that being said, and the fact that most copper mines if not all of them up to unow, are starting to show depletion…. its TIME.
Technical analysis is easy here, basic trend and resistance/support and price action on the monthly outlook. This asset will be like when your daddy or great granddaddy bought gold cheap!


CopperXCUUSD
- Head and Shoulder as an corrective pattern in Short Time Frame
- Break of Structure
- Demand Zone
- Fair Value Gap
- Buy Side Liquidity

XCU/USD: Will This Demand Zone Hold for Bulls?🎯 XCU/USD: The Great Copper Heist Strategy | Multi-Layer Entry Setup 💰
📊 Asset Analysis
Copper vs U.S. Dollar (XCU/USD) - Metals Market
Strategy Type: Swing/Day Trade Hybrid
Market Bias: 🐂 BULLISH CONFIRMATION
🔍 Technical Setup Overview
The setup shows bullish confirmation with triangular moving averages converging in a demand zone - a classic institutional accumulation pattern. We're seeing strong support structure forming, making this an attractive risk-reward opportunity for multi-layer entries.
🎯 The "Layered Entry" Strategy Explained
This isn't your typical single-entry approach. We're using a multi-limit order layering strategy (what I call the "strategic accumulation method") to build positions gradually:
📍 Suggested Layer Entry Levels:
Layer 1️⃣: $4.9000
Layer 2️⃣: $4.9500
Layer 3️⃣: $5.0000
Layer 4️⃣: $5.0500
Layer 5️⃣: $5.1000
💡 Pro Tip: You can add more layers or adjust based on your account size and risk tolerance. The beauty of layering? You average into the position as price dips, reducing overall entry cost.
🛡️ Risk Management
🚨 Stop Loss: Below $4.8000
This level invalidates the bullish structure and protects capital if the setup fails.
⚠️ Important Disclaimer: The stop loss mentioned is based on this specific analysis. You should always determine your own risk parameters based on your account size, risk tolerance, and trading plan. Take profits at YOUR comfort level - your risk, your rules! 🎲
🎯 Profit Targets & Exit Strategy
Primary Target: $5.4000 🎊
This represents a solid risk-reward ratio from our layered entries.
⚠️ Long-Term Resistance Warning: There's a major resistance zone around $28.00 (historical supply zone acting as a strong barrier + potential overbought conditions). If you're thinking ultra-long term, be aware that this level has trapped bulls before.
💰 Exit Strategy Note: The targets provided are guideline levels. Always manage your own exits based on price action, momentum, and your personal profit goals. Lock in gains when you're comfortable - trading is personal!
🔗 Related Pairs to Watch (Correlation Analysis)
Keep an eye on these correlated assets to confirm the copper move:
HG (Copper Futures) - Direct correlation, primary benchmark
FCX (Freeport-McMoRan Inc.) - Major copper producer, equity proxy
DXY (U.S. Dollar Index) - Inverse correlation; weak dollar = stronger copper
CL (Crude Oil) - Industrial commodity correlation
AUD/USD - Australian dollar heavily tied to copper exports
CNY/USD - China is the largest copper consumer globally
💡 Key Point: If DXY weakens and AUD/USD strengthens while industrial commodities rally, this confirms the copper bullish thesis.
📈 Why This Setup Works
✅ Triangular MA convergence in demand zone = strong technical confluence
✅ Multi-layer entry reduces timing risk
✅ Clear invalidation level for risk management
✅ Favorable risk-reward ratio to first target
✅ Industrial metals showing strength in current macro environment
⚡ Final Thoughts
This is a methodical approach to capturing potential upside in copper while managing downside risk through layered entries. Remember: trading is a marathon, not a sprint. Build positions strategically, manage risk religiously, and let the market come to you.
🎭 Strategy Style Disclaimer
This analysis uses a creative "layered accumulation" approach for educational and entertainment purposes. All trading involves substantial risk of loss. This is not financial advice - trade at your own risk and always do your own research. Past performance doesn't guarantee future results. ⚠️📉
✨ If you find value in my analysis, a 👍 and 🚀 boost is much appreciated — it helps me share more setups with the community!
#XCU #Copper #MetalsTrading #SwingTrading #DayTrading #ForexTrading #CommodityTrading #TechnicalAnalysis #LayeredEntry #RiskManagement #BullishSetup #TradingStrategy #XCUUSD #CopperFutures #MultiLayerEntry

Copper At A Crossroads: Rally Exhaustion Vs Macro RiskCopper just delivered a classic volatility sequence: a blow off into the 5.89 area, followed by a fast 27% flush in six days. Since printing the 4.29 low, price has been grinding higher and is now back into my short entry around 5.40, which is roughly a 26% retrace of the drop. What matters to me here is the structure: we retraced without a clean liquidity sweep above the prior extreme, which keeps the move looking corrective, not a fresh impulse leg.
On the macro side , the tape has been pricing a lot of bullish copper narratives at once. We have seen copper trade at record levels in global benchmarks, with the rally supported by supply risk headlines and policy driven optimism. That is exactly why I am interested in fading the retrace: when supply premium and bullish positioning get crowded, even small shifts in risk appetite can trigger sharp mean reversion. Recent reporting has highlighted how sensitive flows and inventory distribution can become when policy risk enters the picture, which tends to amplify volatility rather than smooth it.
Technically, I am treating 5.40 as the “decision zone” after the rebound. As long as price holds below the prior spike region near 5.89, my base case is a rotation back toward the mid range and ultimately a retest of the 4.29 low. If we reclaim the prior extreme and hold above it, that would invalidate the correction thesis and I would reassess.
Note: Please remember to adjust this trade idea according to your individual trading conditions, including position size, broker-specific price variations, and any relevant external factors. Every trader’s situation is unique, so it’s crucial to tailor your approach to your own risk tolerance and market environment.

Copper Trend Acceleration! LSMA Pullback Supports the Move!🔥 XCU/USD — “COPPER VS U.S. DOLLAR”
🔧 Metals Market Opportunity Blueprint (Day / Swing Trade Edition)
📌 🔵 Market Plan: Bullish Structure Confirmed
Copper continues to showcase strong upside structure, and the LSMA Moving Average Pullback has now confirmed fresh bullish continuation momentum.
The price action is stabilizing above key intraday support, keeping buyers in control while maintaining trend discipline.
🎯 Entry Strategy (Flexible + Layer-Friendly)
You may enter at any price level, depending on your personal plan.
For traders using the Thief Layer Strategy, here are the structured levels:
🔹 Layer 1 → 5.3400
🔹 Layer 2 → 5.3800
🔹 Layer 3 → 5.4200
🔸 (You may extend layers based on volatility and your personal system.)
This layered approach helps average entries while staying aligned with market strength.
🛡 Stop-Loss Zone (Trader-Controlled)
Suggested SL for the thief plan: 5.2800
Dear Ladies & Gentlemen (Thief OG’s), this is NOT a mandatory level — adjust according to:
• Your risk profile
• Your system’s buffer
• Market volatility
Use your own decision-making to secure gains and protect your capital.
🎯 Target Levels (Smart Exit Zone)
Copper is approaching a strong resistance cluster combined with overbought conditions + liquidity trap zones.
So the recommended approach is to escape with profits rather than hold blindly.
🏁 Primary Target → 5.5600
Again, Dear Ladies & Gentlemen (Thief OG’s), this TP is optional — manage exits with your own discipline, risk, and style.
🌍 Related Pairs to Watch (Correlation Guide + Key Points)
🟠 1. XAU/USD — Gold vs USD
Correlation:
• Often moves inversely with USD strength
• Can highlight broader commodity demand sentiment
Why watch it:
• Gold strength can indicate commodity-wide risk-on behavior
• Helps confirm metals sector flows
🟣 2. XAG/USD — Silver vs USD
Correlation:
• Silver and Copper often rise together during industrial demand expansions
Why watch it:
• Strong silver rallies often lead or follow copper momentum
• Helpful for timing metals-based pullbacks and extensions
🟢 3. USOIL / WTI Crude
Correlation:
• Copper responds to global growth expectations — oil confirms economic activity
Why watch it:
• Rising oil typically reflects higher industrial production
• Gives early signals of demand conditions that benefit copper
🔵 4. AUD/USD — Commodity Currency
Correlation:
• Australia is a major copper producer
• AUD is strongly tied to global commodities
Why watch it:
• AUD strength often corresponds with rising metals
• Can help detect early sentiment shifts
🟤 5. DXY — U.S. Dollar Index
Correlation:
• Copper moves inversely with USD
Why watch it:
• Copper rallies strengthen when USD weakens
• A strong DXY can slow or cap copper upside near resistance
Remember:
✅ Trade with layers ✅ Adjust SL/TP to your style ✅ Watch correlated assets
🚀 Let’s catch this move, Thief OG’s!
Like, Follow, and Share if this helps! 💬⬆️🔔
Stay tuned for more high-quality setups.
#Copper #XCUUSD #TradingSetup #MetalsTrading #Bullish #SwingTrade #DayTrade #ThiefMethod #TradingView #Investing #Commodities

CopperXCUUSD
- Fair Value Gap
- Order Block
- Fibonacci Level - 78.60%
- Completed " 123 " Impulsive Waves
- Resistance Level

CopperXCUUSD
- Bullish Channel as an corrective pattern in Short Time Frame
- Resistance Level
- RSI - Divergence
- Completed " 1234 " Impulsive Waves
- BSL

CopperXCUUSD
- Fibonacci Level - 61.80% / 78.60%
- Demand Zone
- Completed " 12345 " Impulsive Waves and " AB " Corrective Wave
- Fair Value Gap
- Bullish Channel as an corrective pattern in Short Time Frame

COPPER / GOLD & ISM PMI = Critical For AltseasonBeen seeing a lot of commentary on COPPER / GOLD.
This is a strong indication of industrial growth in the economy, as the demand for copper rises with build-outs.
The ISM PMI has a very strong correlation with C/G, also showing strength in the economy, as consumers buy more which gives businesses the ability to expand operations.
In a nutshell, these charts portray “Retail” ie “Main Street”.
There’s a very real possibility that we do not get our typical Alt Season at all this cycle if C/G & ISM PMI do not have a violent move up in the next few months. (more on this later)
The last time we saw such a divergence between these two was in January 2016 where it took C/G ~230 days to turn-up.
This would put Alt-Season Q4 ’26 - Q1 ’27, which makes sense theoretically based on Trump’s suspected stimulus plans which would come right before mid-terms.
This would give us our typical year-long bear market which has snuck up on us all because we lacked the retail euphoria phase due to very weak retail participation.
HOPIUM:
In 2016 When the ISM climbed above 50, COPPER soon found a bottom and Alts ripped.
Notice the bullish divergence on the RSI during that time, same as we are seeing now.
It looking like C/G may have found a bottom on this multi-decade parallel channel.
*Our livelihood depends on the ISM showing immense strength in the coming months so that C/G can follow.

CopperXCUUSD
- Completed " 12345 " Impulsive Waves
- Bullish Channel as an corrective pattern in Short Time Frame
- Break of Structure
- Order Block
- Fair Value Gap

CopperXCUUSD
- Falling Wedge in Short Time Frame
- Demand Zone
- Order Block
- Change of Characteristics
- Bullish Channel as an corrective pattern in Long Time Frame

CopperXCUUSD
- Bullish Channel as an corrective pattern in Short Time Frame
- Sell Side Liquidity
- Change of Characteristics
- Demand Zone
- Completed " 12345 " Impulsive Waves and " A " Corrective Waves

Copper extends gains amid risk on tradeFollowing the weaker US cpi report, risk assets have all rallied and copper is among those. The metal broke out of a triangle continuation pattern yesterday and held above $5.00 key level. With optimism over US-China sending stocks to new records today, copper could follow suit and gain further ground in the days and weeks ahead. Watch out for more upside potential.
By Fawad Razaqzada, market analyst with FOREX.com

Copper (HG1) Market Watch Simple & Clear!Copper’s looking strong right now 💪 and it might be setting up for a big move.
Here’s the key level I’m watching:
📈 If copper breaks and closes above 5.41, that could open the door for a run all the way up to 7.13.
That’s a big potential move but only if we hold strong above that breakout level.
💡 Right now, it’s all about confirmation ; a clean close above 5.41 could shift the trend in a big way.
Want to see the chart setup I’m using and how I’m planning around that 5.41 breakout?
💬 DM me “COPPER” and I’ll send you the exact breakdown directly. 🚀
Mindbloome Exchange
Trade Smarter Live Better

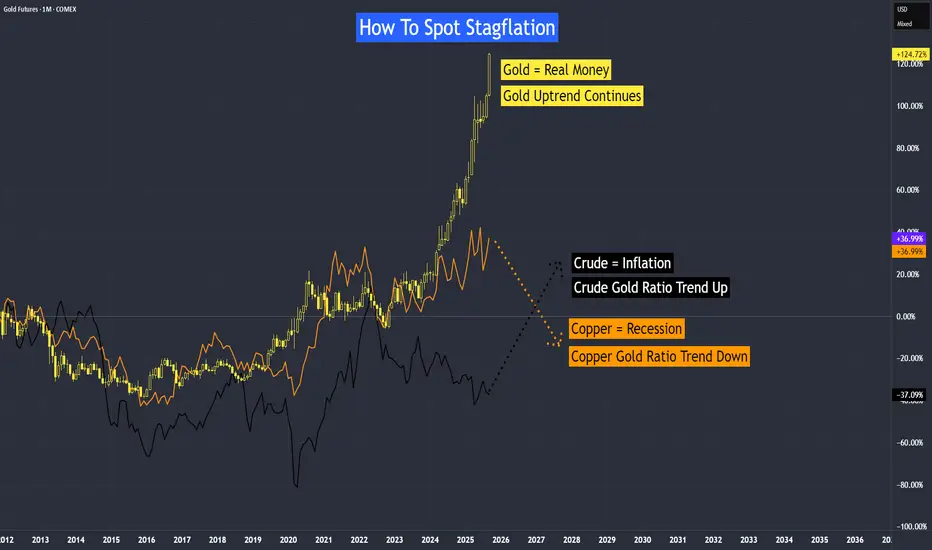
How To Spot Stagflation?One way is by looking at the copper-to-gold ratio and the crude oil-to-gold ratio.
• Gold reflects real money and investor confidence.
• Copper tracks recession.
• Crude oil represents inflation pressures.
When real money is under threat, the economy slows, and inflation rises at the same time, we have stagflation. This is the worst-case scenario for any economy. Fortunately, we are not experiencing it yet, though the risk remains.
What could trigger it?
Copper Gold Ratio - A downward trend signals slower growth and potential recession. This does not mean copper prices are falling; rather, if both copper and gold are rising but copper is climbing at a slower rate than gold, the ratio will continue to trend lower.
Crude Gold Ratio - As of now, the trend is still down, indicating that inflation remains under control. However, if crude oil starts moving higher, and its percentage change exceeds that of gold, the ratio will turn upward. Currently, inflation already seems to be pointing upward, and if the copper-gold ratio also rises, inflation is likely to trend higher than its current level.
Video version:
Therefore, stagflation = slow growth (copper-gold ratio) + high inflation (crude-gold ratio). Keep a close watch on the direction of copper and crude oil.
Copper Oil Futures & Options
Ticker: HG
Minimum fluctuation:
0.0005 per pound = $12.50
Disclaimer:
• What presented here is not a recommendation, please consult your licensed broker.
• Our mission is to create lateral thinking skills for every investor and trader, knowing when to take a calculated risk with market uncertainty and a bolder risk when opportunity arises.
CME Real-time Market Data help identify trading set-ups in real-time and express my market views. If you have futures in your trading portfolio, you can check out on CME Group data plans available that suit your trading needs www.tradingview.com
Tracking Stagflation with this Ratio - Crude, Copper, Gold RatioHow to Spot Stagflation?
One way is by looking at the copper-to-gold ratio and the crude oil-to-gold ratio.
• Gold reflects real money and investor confidence.
• Copper tracks recession.
• Crude oil represents inflation pressures.
When real money is under threat, the economy slows, and inflation rises at the same time, we have stagflation. This is the worst-case scenario for any economy. Fortunately, we are not experiencing it yet, though the risk remains.
What could trigger it?
Copper Oil Futures & Options
Ticker: HG
Minimum fluctuation:
0.0005 per pound = $12.50
Disclaimer:
• What presented here is not a recommendation, please consult your licensed broker.
• Our mission is to create lateral thinking skills for every investor and trader, knowing when to take a calculated risk with market uncertainty and a bolder risk when opportunity arises.
CME Real-time Market Data help identify trading set-ups in real-time and express my market views. If you have futures in your trading portfolio, you can check out on CME Group data plans available that suit your trading needs www.tradingview.com
