EOS Accumulation Zone Complete / Result: Effect Stage CommenceHi Everyone,
It appears EOS has now completed its accumulation in respect to the Wyckoff Theory. Rhyming to the rules of Wyckoff Theory, we can see the Accumulation (Cause) now reflecting the strength of the buyers and pushing the price above the zone to represent reversal of the trend which should now have the health to make new highs (Effect). I Personally have a target of around the 1700-1800- Satoshi Range which is a potential 80% profit.
Other supporting factors include:
Volume: High (we haven't seen this peak of volume in 3 years)
Candles: Weekly Candle showing the buyer strength as consistent wicking of the weekly can be observed in favour of the bulls
EW: From peak of 2018, ABC wave correction complete with wave C extended 5th wave 1.618 showing exhaustion.
Lets see how this one plays out.
Please follow for further updates and other Crypto trades .
Please note this is not Financial advice and DYOR as always.
Thanks,
Husky.
High

Go to Binance and buy ASR token.This is a very great and secure opportunity. Don't miss it!
Remember: low volume tokens with cheapest price in the market always explode! This is a law.

BTC Lower high Lower lowEntered short when 4hr painted lower high lower low a few times.
See what happens in next 30 mins

ASR bullish trend started with high volume increase. Buy it.This is your opportunity, this coin will hit the JUV price.

BTC Possible Scenarios (For Now)BITSTAMP:BTCUSD
It looks like BTC is setting new highs again. We are approaching a 2.618 fib. extension level. If we go break above it and form a support, we could be VERY BULLISH. That would be nice, but for now i belive it is more likely that we will get rejected from that 2.618 level and retest much lower areas, then go for a final rally with the altcoins outperforming BTC.
I am not a financial advisor so don't buy anything that a say. Be well.


TSLA great Buy opportunityUsing the patterns that worked in the past TSLA is going high up again soon.

Pump for high retest?I find it interesting we are finding momentum while DXY is relatively strong and high in sentiment. This has been the recent play out.
Is this an indicator to sentiment breaks to retest high? You tell me.
Please comment with thoughts and ideas. Thank you .

XRP still look bullish..Idea if you want to jump in nowHere's a trade idea for XRP/USDT for those who would like to jump in now
The price is still hovering where our MA crosses signaling a long. I use our MA script to define the entry
Our stoploss use pivot from our Stoploss picker script
As for the TP, I placed it near the next candle after the recent high as it might very well retest this area. I wouldn't suggest using the MA cross as an exit as it is not performing well for this pair.
If you are risking 2% of your account on that position, you should use 4.69% of your equity
you can learn how to define your Position size by googling "trend surfers position size"
this is not the best trade opportunity, but for those who really want to trade XRP today, you might want to consider this trade idea.


AUD/JPY - Price beginning its DescentWe've been bearish on this pair for some time now after a previous break of structure. Price retested the highs and tanking rapidly so far today.
If you want to learn about this analysis, using highs, lows and key structures just send me a message on TradingView.
Happy Trading guys!

XRP Daily - Fibonacci With the zone mentioned on the chart being from the weekly timeframe, it is likely that we will see a push towards this now $0.26 has broken.
The wick on the 22nd to $0.24 was also a sign that this move is likely to happen.
This would close the Monthly candle as a doji which is a good sign next month should be bullish.


APPLE - Falling From The Tree!Hello everyone, if you like the idea, do not forget to support with a like and follow.
APPLE rejected its all-time-high and now falling down, so we are currently in a down-trend.
on H1: APPLE is forming a symmetrical triangle (pennant) in red but the lower trendline is not valid yet (as it only connects two swing lows) so we will be waiting for a third swing low to form around it to consider it valid.
Trigger: Waiting for a momentum candle close below the gray area (the entire structure) to sell.
When the sell is activated, a downward movement would be expected equal to the previous impulse.
and until the sell is activated, this one would be overall bullish and can still break the upper red trendline and test the all-time-high again before falling.
Good luck!
All Strategies Are Good; If Managed Properly!
~Rich

BTCUSD ATH last candle on 1W TFrame, then to down Week23 of 2021Next Min Low price Week23 of 2021 (06.13)
Maybe Min low price 4033.82$

USD/CHF - Trend IdentificationGood Morning Traders. Here is an educational piece on two key things.
Before trading a currency pair, we want to head to at least the daily chart to identify the long term trend on the pair before we scale down to our lower time frames. To identify a trend is simple. For an uptrend, look for higher highs and higher lows.
Here is a clear long term downtrend on UCHF. We can see price is making lower highs and lower lows. This indicates a downtrend.
It is important to zoom out and see highs and lows of markets long term. We've done that here with USD/CHF and we can see that price is now at 6 year lows! Will sellers keep pushing price down further or is this a level where buyers will jump into the market?
Top Tip - You can always switch to a line chart. This makes identifying the trend easier for forex beginners!

Buy Deutsche bank, no this is not troll idea.Buy Deutsche bank cheap, sell expensive, later.
Risky, but payoff potential is pretty decent.

Kraft Heinz long term buy positionBuy as low as you can, ideally, put this stock in your long-term investment portfolio.

NZDCAD for new highs? 🦐NZDCAD after breaking above the weekly structure at 0.91750 started a minor consolidation move.
If the price will move according to Plancton's strategy we will set a nice long order.
----
Follow the Shrimp 🦐
Keep in mind.
🟣 Purple structure -> Monthly structure.
🔴 Red structure -> Weekly structure.
🔵 Blue structure -> Daily structure.
🟡 Yellow structure -> 4h structure.
⚫️ Black structure -> >4h structure.
Here is the Plancton0618 technical analysis , please comment below if you have any question.
The ENTRY in the market will be taken only if the condition of the Plancton0618 strategy will trigger.

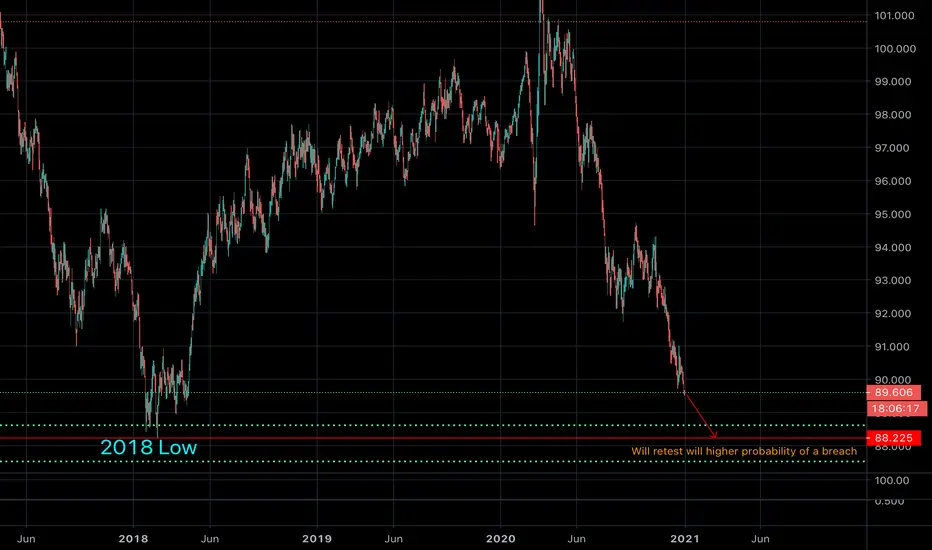
Twin Deficit forcing Psych levelsTwin deficit has resurfaced as a driving force towards DXY decline. At this point pairs are being controlled by psychological trend levels.
Presented is the DXY day chart. We can see a clear drop for a retest of the 2018 low which in contrast brings pairs such as NZDUSD, EURUSD, GBPUSD, etc to levels breached in Jan 2018.
A fundamentalist like myself begins to wonder if Twin Deficit sentiment is the ultimate driving factor for these psych occurrences taking place in 2018 and current. While COVID would be a logical main factor, ultimately any factor that would push double negative accounts.
Attached is my previous DXY idea as well as my 2018 high retest idea of USD pairs I published over a month ago. Anyone patient enough to hold USD pairs have certainly played their cards well.
Expect a retest of 88.225 to match 2018 with a higher breach probability for a new low.
Please comment with any thoughts and Ideas. Thank you.
GOLD Simple and Bold Trade of the Week.Trade Analysis Based on FA+PA.
With risk mannagement you will never loss.
Thank you.

NASDAQ Long-Term Possible ScenarioHello everyone, if you like the idea, do not forget to support with a like and follow.
on DAILY: NASDAQ is sitting around its all-time-high and 140.0 round number in blue so a reversal may be expected from here.
As you can see, this one formed an objective trendline in red and a valid RichBomb setup (orange dots)
The bearish movement would be confirmed after a momentum candle close below the gray area (the entire structure)
and until the sell is activated, this one would be overall bullish and can still break above the 140.0 round number to reach 150.0 before going down.
As price approaches our lower green support and round number 100.0, we will be looking for buy setups.
Good luck!

Pattern: Morning Panic Dip-Buy Pattern->What is the Morning Panic Dip-Buy Pattern?
This pattern is based on a wall of sellers that drive the market down in a short time.
As you can see in the chart the wall of sellers show how market quickly sold off during the session of March 6th, after an all time high (not supported by demand).
Leaving us with a first day candle of March 7th, with a volume as high as the all time high, opening and closing in the same price; this is a clear sign of strength because demand are now the leaders of the market. This day we had the possibility to entry in this new trend.
->What causes the Morning Panic?
This pattern is caused by a new catalyst as a new, longs taking their profits overnight during the all time high, and sellers betting against the stock as it rose so high that it could not maintain.
->How the Morning Panic Plays Out?
These stocks often close strong during the previous session (as the example did), sometimes this creates a gap up at market open and when gap up occurs, longs sell their shares to take profits.
Be aware as the stock after the morning panic usually takes some time to settle into a cleat trend.
->Dip Buying a Morning Panic is a classic long position.
Hope you have a great day!
