Spirits Airlines Inc. Where's The Support Zone?Prices are currently at THE 39.00 - 38.00 Zone.
I believe that we could potentially see prices go lower only to spike back up, ultimately wiping out prior higher highs at both 49.00 and 60.00 .
I don't believe however this is going to happen immediately, we might be monitoring this for a while guys.
Let's now wait for this stock to find a lower support zone.
Sector: Industrials. Airlines
Vol: 844.878K
EPS: 8.94
Market Cap: 2.769B
P/E: 4.47
High

Potential H&S Pattern forming on BTC/USDI can see a potential H&S pattern forming in bitcoin USD since 17/02/18? it seems to be forming its neckline on the 0.786 fib from the bottom low of 6,140 to the high of 11,664.


FTSE 100: UKX Inter-Generational High: Super Cycle only half wayFTSE 100 Inter - UKX - Inter-Generational Cycle High - Half-Way House
Nine years from high to low. Nine years from low to High on
FTSE in fact the secondary or final rally high set in week of
13.03 00 as Internet generation 1 peaked with Nasdaq and
techs' peak reached that week). Low reached March 9th 2009.
The next cycle date falls between Friday 2nd March and
Friday 9th March. If the major markets break below the lows
of last week we can therefore most likely expect a low to
form at this point in time - and if they can hold up today and
rally from here the next high is likely to be struck in the 5
trading days between March 2rd '18 and March 9 '18.
Whichever way it breaks from here should be worth following
in the near term - but start to look for a significant change in
trend in either event come 2nd March through 9th.
Looking even further out in time this peak now is likely only an inter-generational cycle high, marking the half-way point in the old 18 year generation cycle. The real grand super-cycle high (high to super-high) is not reached on this chart until March 1st 2027.
Time, as always, will tell.
In the meantime, there's a nearer term FTSE strategy outlined below.

MJX; 2018 the year of legal weed!Im biased, I smoke the good kush every day, so it is only logical for me to be long good kush and those who can provide it.
a new etf was converted from latin american RE to 'alternative agroscience' (LARE became MJX) and it is already looking like it could be going parabolic to me.
Most of their holdings ( portfolios.morningstar.com ) are in canada so it isnt like AG Sessions can do much about the weed boom across the border.
gl hf and if u make a bag be sure to buy an oz of OG kush on me :)
manage your risk
much love
xoxo
sn00p

S&P 500 Index: SPX Longer Term Gann Cycles - Cycle High and Low SandP 500 Index Longer Term Gann Time Cycles
Probably the greatest trader who ever lived, WD Gann , taught us to measure time cycles - from high to low and low
to high as well as high to high and low to low - and look for potential changes in trend as these hiddden cycles tend
to repeat themselves down through time. Previous cycle highs identified the exact date of the high in 2007 as well as
the subsequent high reached in April 2015 just at the point that markets began a 10 month 20+% correction (for more
details please PM) . This current cycle marks the period from 20.03.00 high (as Internet v1 peaked) through to the next
major cycle low on 06.03.09. From major cycle high to low is 9 years, almost exactly...which now brings us, after a 9 year
long bull run, to the coming 23 to 27 days, culminating in the anniversary dates between 3rd march and 10th March 2018...
So if the lows of last week are broken on Monday we can most likely expect the decline to last for the next 23 to 27 days,
culminating in a major cycle low between 3rd and 10th March 2018. Major markets have a challenging 23 to 27 days ahead
of them. Time is piling up. If the SandP breaks below 2525 and holds below here by Monday's close we can expect further pressure on markets until we reach the anniversary dates. It will be interesting to see if Gann's great cycles remain as accurate now as they have done
in the past. As always, time itself will tell us that answer. In fact Monday will.

FTSE 100 Index: UKX - Cycle High - Short Set-Ups with triggersFTSE 100 Index: UKX Long Term Time Cycles in FTSE Index
After rising 10% at the start of the 2018 FTSE has fallen all the way
back its start point for the year. Up 10% and back down 10% in 6 short weeks. The action looks unlikely to stop now.
In fact it could be just beginning. Probably the greatest trader who ever lived, WD 0.61% Gann , told us to measure
time cycles from high tolow and low to high as well as high to high and low to low and look for potential changes in
trend as these hiddden cyclesrepeat themselves down through time. Previous cycle highs identified the exact date of
the high in 2007 as well as thesubsequent high reached in April 2015 just at the point thatmarkets began a 10 month
20+% correction (for more detailsplease PM) . This cycle marks the period from 10.03.09 majorcrash low through to
the next major cycle low on 06.03.09. From major cycle low to low is 9 years ...which now brings us,
after a 9 year long bull run, to the coming 23 to 27 days,culminating in the anniversary dates between 3rd march and
10th March 2018...
FTSE is already teetering on the brink of critical support at 7092. It has to cling on here on Monday for any failure will tip
this index into bearish territory and trigger a short back to 6868 at least - and then if this level in turn gives way back to
6680-6637. Beneath here the next major support potential lies at the lower parallel and below here at 5777.
So if 7090 gives way on Monday by more than 10 points look to short this index with stops above 7099, targeting 6870
initially, then the 6680-6637 range if 6860 fails to hold during Monday. It's quite probable that should 7090 fail come Monday,
this Index will fall away in stages to test the lower parallel at 6004 on around 5th March - and only then bounce away to the
upside again.This will present some wonderful shorting opportunities along the descent. However, in the very near
term it's likely that contrarian traders will look to go long here, simply because the stop is so close (20 points away
maximum now) but ready to reverse short as above if 7090gives way by more than 10 points. Time, as always, tells.

BTC-USD | Short Here | We're going down!As you can see.... we've been stuck inside this channel for.... FOREVER! (at least is feels like forever) If we don't break out of this channel here, we're going back down and continuing the trend that we've been in. I'm praying that this breaks out of this channel so we can start to make some serious gains.... but I DOUBT that will happen. So I would be taking a short position here if I wasn't in the United States... lol Enjoy guys.
This is for information purposes only. Do not make an investment based on what i post here.
Thanks Guys!

Spike when difference between high an low is >5%Spike when difference between high an low is >5%
You can set an alarm if you want to that way
You can shoose/change the intervalyourself

Bytecent [ BYCBTC] | [+335 potential Profit]Idea
Here you can see the same like in my Clams analysis, but with clearer bullish indicators on the 1-day-chart.
The token is in active development with high potential too, price at the bottom and a lot room to grow.
Look at the previous fibonacci levels!
Indicators are hinting a bullish movement.
Technical
1d chart:
MACD: Has turned over !steep!
RSI: Is going up!
STOCH: Is going up too!
= prepare for a bullish movement soon!
weekly chart:
On the weekly side again we have an image of a bitcoin crash and a damaged market.
It will recover and this coin will be one with the higher potentials in the next 8 weeks!
Buy-In
0.000145000 - 0.00018500
Stop-Loss: no
Targets via fibonacci
1 | 0.00020590 = possible first resistance
2 | 0.00030656
3 | 0.00038793
4 | 0.00046929
5 | 0.00058513
6 | 0.00073269 | old all time high
7 | 0.00380195 | new all time high <— Fib. 1.618 extension
Conclusion
I have a mess of coins like this.
Invest relax & earn.
We only trade for profit, never for loss.


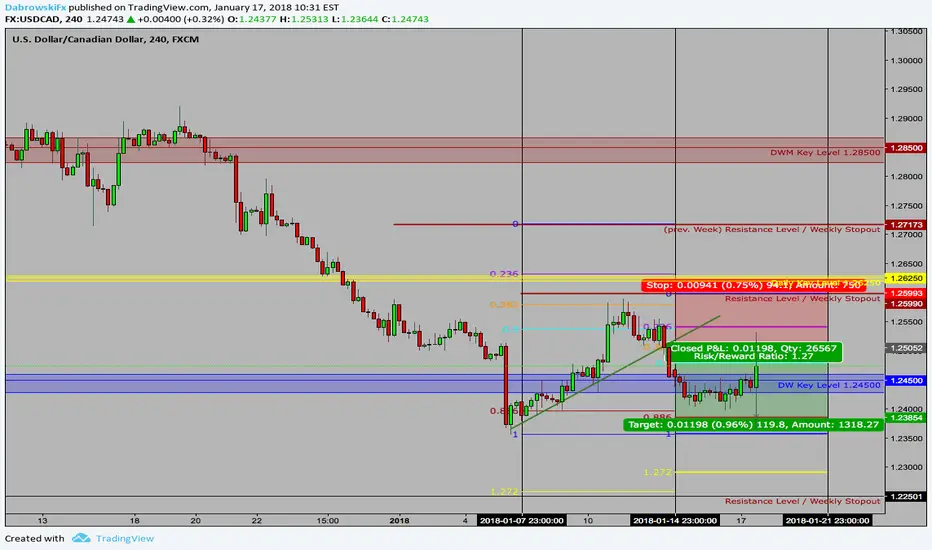
>>USDCAD<< >>January Week 3<< Short SetupUSDCAD just spiked back up from Weekly Key Level at 1.245, we possibly gonna see a drop back to my
Level, bearish price action was very strong in the last couple of weeks.
Broke short-term uptrend to the downside, our stops are at previous highs, our tp Level is at our actual
low.
This will be a quick one, so trade with care and watch out for fundamental news.
Entry: 1.2505
Sl: 1.2600
Tp: 1.2385
Have a good one, I'm always happy about feedback :)
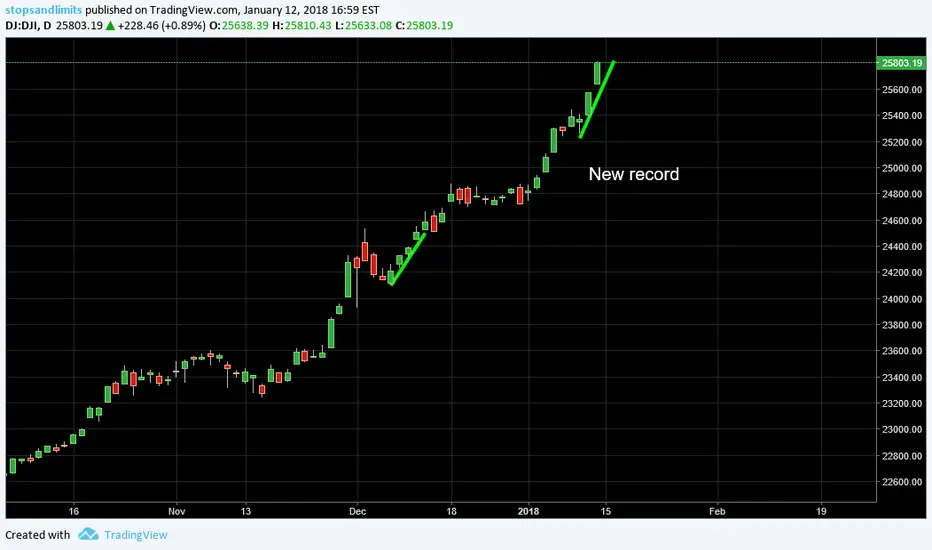
12/01/2018 DOW AnalysisPrice has reached a new high level, due to earinings optimism data. www.reuters.com
Bitcoin at the crossroadBitcoin is at the crossroad. It is swinging around 14642 while the Stochastic indicator suggests that the long-term uptrend is still intact. As long as the Stochastic indicator is above the blue dotted trend line, we can assume a bullish scenario for BTCUSD. However, once that blue dotted trendline will be broken to the downside, a very bearish scenario will take over with a target of 5568 USD per Bitcoin. We know that the governments of the United States of America and of Bulgaria confiscated Bitcoins worth more than 3 billion US-Dollars. They probably want to sell them all. www.coindesk.com The price of the Bitcoin will mainly depend on how they flood the market with their confiscated Bitcoins during the next few months. I expect a high volatility and many good opportunities for buying cheap Bitcoins.

Bullish Pennant on $XRP/$USD. Short-TermIn the words of DJ Khaled , "anotha' one."
We got another Bullish Pennant on the $XRP/$USD 1H Chart.
With highs meeting downtrend resistance and Higher Lows showing strong Bull sentiment. Short Term goal is $2.9 - $3 with expansion to Hi of $3.30 later this week. #XRP #Ripple


4/01/2018 DOW Analysis" The Dow industrials broke above the 25,000 level for the first time on Thursday " www.reuters.com


OMG/USD WHERE TO NEXT?? PROMISE LAND?WE MAY SEE HIGHS OF $17.1+ IF PURPLE SUPPORT LINE IS NOT BROKEN. OR DIP TO ~$12.4 BEFORE MIDDLE BLUE SUPPORT LINE IS TESTED. MAY FALL LOWER OR BOUNCE BACK UP AT THIS POINT.

