Target (TGT) Could be attempting to Reverse Bear TrendThis is an analysis of the 1 Week or Macro timeframe. We zoom out to get a feel for the big picture moves.
Where Target's current price action has reached, it warrants attention and to me is a critical area to watch.
Why critical? Well, we have reached the Upper bounds of Targets Bearish Channel so we either attempt for a break of the resistance holding us down or we continue the Bearish trend downwards.
Why Bearish channel or trend? Because technical analysis 101 says that the observation of Lower Highs and Lower Lows are indicative of a bearish trend.
It can't be any clearer. With this established, its always important to remember:
The Trend Is Your Friend. Probabilities dictate that price action will continue to move in the direction of the established trend. Until ofcourse it doesn't by printing reversal signs/ signals, etc.
Notice the Green rectangle highlighting the Price action of the last 10 months-ish.
In April 2025, we reached a price of around $86.00, bounced from here to around $105.00 and again fell back down to around $86.00 in the Fall of 2025.
Reaching $86.00 twice, is a Double bottom formation. A potential sign of an attempt to reverse trend.
Now in recent Price Action we are currently around $112.00. This is our first Higher high since we began our Bearish trend in October 2021.
The Green Zone can also potentially becoming a multi year consolidation range.
Which is why again i would say is a critical area and warrants attention.
What i'm looking to see is how price action interacts with this current price zone highlighted in Orange, titled "Confluence of Resistance". Its not going to be easy as people will look to unload stock, as many have held stock since the highs of $231.00.
A clear sign that Bullish Trend is getting stronger is if we break above the Red Resistance Trend line and Confirm Support and show clear signs of moving above the Orange zone as well.
Another sign would be a clear HIgher Low Print.
But do keep in mind, probabilities point to Current Trend Continuing unless something big happens.
So its exciting to see what plays out in the coming weeks to months as Target attempts big things or the big things fizzle out.
Follow for more updates.
Higherlow

HL is still intact around 581.FFC Analysis
CMP 596.62 & Lower Locked (29-01-2026 02:54PM)
HL is still intact around 581.
If this breaks, next support is around 568 - 570
It may continue its uptrend after crossing 685.

Seems like confirming HL.29-01-2026
Seems like confirming HL.
It should not break 19 now.
Upside, it may touch 23 - 24 again.

Continuously making HH HL but now..AAPL Analysis
CMP 256.44 (28-01-2026)
Continuously making HH HL.
Now Bearish Divergence on bigger tf; Cautious Approach should be taken.
Trading in a Channel with Channel bottom around 223 - 226 & Channel top around 300 - 304.
Before Channel Support, an immediate support is also available around 246 - 248.

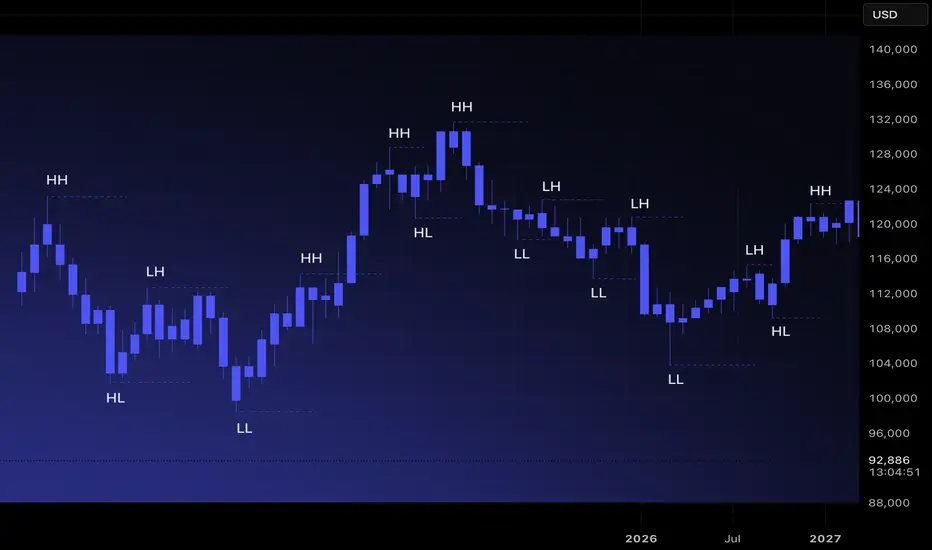
Market Structure 101: Navigating Price ActionMost traders jump directly into indicators, oscillators, or patterns. Yet every chart has a deeper foundation that determines direction long before any tool is applied. Market structure is that foundation. When you understand how price forms highs, lows, and transitions between them, you stop reacting to noise and start reading the market’s intent. It is the base layer that allows you to build a clear, consistent bias.
Price moves because buyers and sellers interact around key levels. Structure highlights where momentum strengthens, weakens, or reverses. By tracking how highs and lows evolve, you can identify trend, consolidation, and shifts in direction with far more clarity than any indicator can offer. Market structure is objective. It gives you a rule-based lens to interpret movement across all timeframes.
Understanding Highs and Lows
There are four structural components every trader must recognize.
Higher High (HH): Price breaks above a previous high, showing buyers in control.
Higher Low (HL): Price pulls back but stays above the prior low, confirming trend continuation.
Lower High (LH): Price rallies but fails to reach previous highs, indicating weakening demand.
Lower Low (LL): Price breaks below the previous low, signaling sellers taking control.
These sequences are the building blocks of trend identification. When mapped correctly, they remove guesswork and reveal underlying momentum.
Identifying Uptrends and Downtrends
Uptrend: A sequence of HHs and HLs. Buyers consistently push price higher and defend higher floors.
Downtrend: A sequence of LHs and LLs. Sellers control direction, rejecting higher prices and driving the market downward.
A trend remains intact until structure breaks. This is why experienced traders avoid predicting reversals and instead follow structural evidence. When the market prints new HHs and HLs, the bias remains long. When LLs and LHs appear, the bias rotates short.
Ranges and Consolidation
Markets do not trend all day. Much of the time, they move sideways. A range occurs when highs and lows stay relatively equal, creating a horizontal zone with equal highs and equal lows. This is where compression happens. Liquidity builds above the range highs and below the range lows, and trend often resumes only after one side of the range is taken.
In ranges, structure becomes neutral. Bias is formed only when price breaks out and retests with confirmation.
Break of Structure(BOS) and Trend Shift
A break of structure occurs when the market violates the pattern of the existing trend. In an uptrend, a break occurs when price prints an LL. In a downtrend, a break occurs when price forms an HH. This signals a potential shift in momentum.
Breaks of structure matter because they identify turning points without relying on subjective signals. They show where one side loses control and the other gains traction. They also create clear invalidation points for risk management.
How to Read Structure Across Timeframes
Market structure becomes even stronger when used across multiple timeframes. The higher timeframe sets the primary bias. The lower timeframe provides entry precision.
Weekly or Daily: Structural trend and major zones.
4H or 1H: Execution windows and key shifts.
15m and 5m: Entry confirmation.
When all levels of structure align, the probability of a clean move increases significantly.
Avoiding Common Mistakes
Many traders misread structure by focusing on every small fluctuation. Structure is defined by meaningful swings, not micro noise. Another common error is assuming a single HH or LL immediately reverses a trend. Context matters. Breaks followed by continuation and retests confirm the shift. A disciplined trader waits for structure to become clear instead of acting on isolated candles.
Turning Structure Into a Bias
Structure simplifies decision-making.
If the market is printing HH and HL formations, you prioritize longs.
If it is printing LH and LL formations, you seek shorts.
If highs and lows are equal, you wait for a breakout.
NOT CLEAR TRADNBINANCE:LTCUSD.P
h
Higher high make and change to break out
rsi d compleat
let see
adx under 25

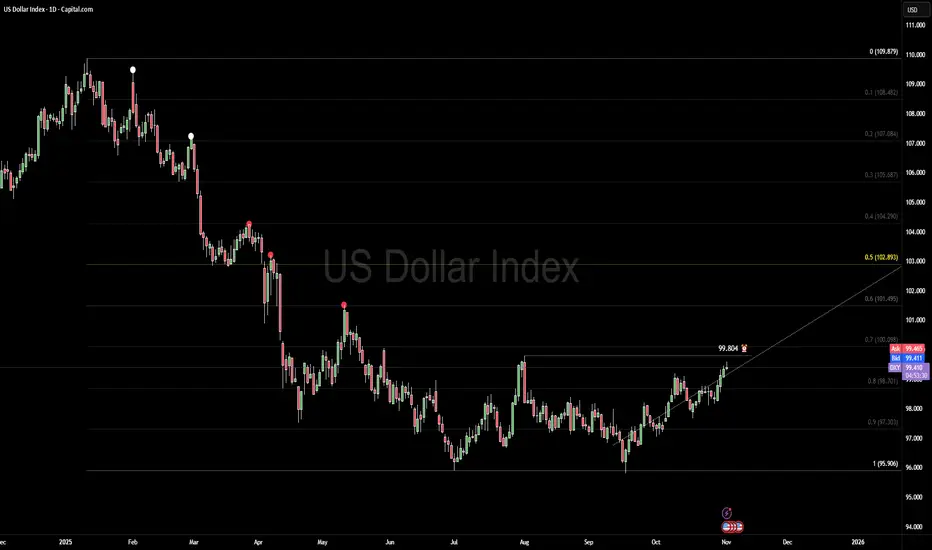
US DOLLAR — Structure Shift in Motion🧭 Context
The dollar continues to push higher while major crosses weaken. Risk sentiment remains defensive as traders lean toward safety going into the new week.
📈 Technical POV
We’re trading into the structural pivot at 99.804, not above it yet. The daily chart shows stretched momentum — near +2 deviation — but buyers still control the short-term rhythm. The broader weekly bias remains bearish, so this move likely forms a counter-rally within the larger range.
🌍 Macro View
Currency Index: DXY advancing toward 100.00, driven by steady demand for USD amid uncertain global data.
Central Bank: The Fed’s 25 bps cut came with a neutral tone, signaling a pause — enough to keep the dollar firm.
Yields: U.S. 10-year yields hover near 4%, maintaining the yield advantage over Europe and Japan.
Seasonality: Early November often favors USD flows as funds rebalance into year-end positioning.
📊 Volume / Order Flow
Liquidity behavior remains balanced near current levels. No clear exhaustion yet — market is simply rotating into the key 99.804 zone, waiting for confirmation before expansion.
🎯 Plan
If we close above 99.804, it could unlock a move toward the weekly discount-zone liquidity, potentially sparking strong reactions across major cross pairs. If rejected, expect short-term pullback before any renewed strength.
🧠 CORE5 Note
Professional traders don’t predict — they prepare. Let price prove conviction before you act.
Institutional Logic. Modern Technology. Real Freedom.
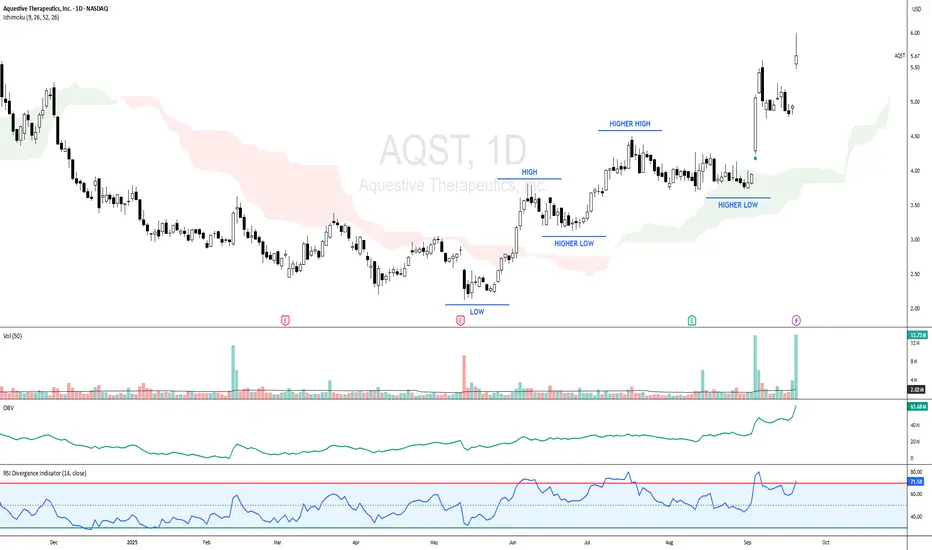
AQST - RISING PRICES is supported by INCREASING VOLUMEAQST - CURRENT PRICE : 5.67
Key Observations :
Uptrend Structure – The chart shows a clear uptrend where both highs and lows are moving higher, confirming bullish price action.
Volume Confirmation – Rising prices are supported by increasing trading volume, which validates the strength behind the uptrend.
OBV Indicator – On-Balance Volume line is trending upward, confirming strong accumulation and participation from buyers.
RSI Momentum – RSI is above 70, reflecting strong bullish momentum with no immediate signs of weakness.
Overall, the combination of higher highs & higher lows, volume confirmation, and bullish indicators (OBV & RSI) suggest that AQST (Aquestive Therapeutics, Inc.) is well-positioned for further upside in the short to medium term.
ENTRY PRICE : 5.47 - 5.67
FIRST TARGET : 6.40
SECOND TARGET : 7.90
SUPPORT : 4.97
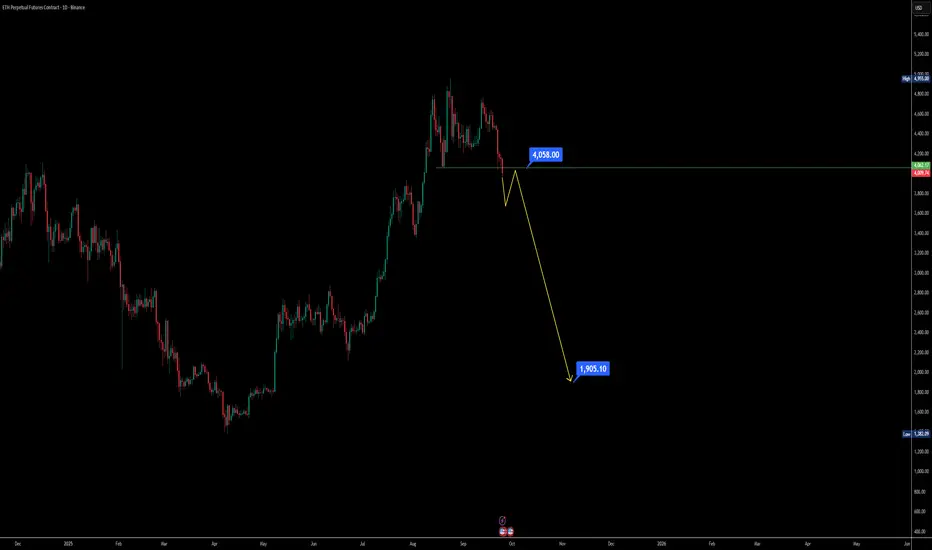
Ethereum Daily Chart Distribution Phase Signals huge dumpIf you’ve been tracking Ethereum on the daily chart, the structure is starting to look heavy — and not in a bullish way. Let’s break this down step by step so it’s easy to follow 👇
Support lost: ETH has already broken its key support zone around $4060, which previously acted as a higher low. Now, the recent dip is printing a new lower low, shifting market sentiment.
Daily close levels matter: If the daily candle closes below $4000, it confirms weakness and opens doors for a further sell-off.
Possible head and shoulders: A pullback toward the $4100 region could simply build the right shoulder of a bearish head and shoulder pattern. The structure matches what we saw earlier on the left shoulder.
Bearish momentum risk: If ETH fails to hold above $4000 after that pullback, we could be looking at extended downside — even a sharp fall toward the $2000 zone based on historical dump patterns.
Market behavior reminder: Over the past two years, whenever ETH started a distribution breakdown, the drop was often fast and violent. That’s why caution is key here.
📌 Key Takeaway: Ethereum is at a make-or-break daily level. Watch $4000 closely — losing this level could accelerate a bearish breakdown. Short-term traders may look for opportunities on the pullback, while long-term holders need to stay cautious of the possible head and shoulders pattern forming.
Bitcoin Bearish Path Toward 110K📉 BTC/USDT Analysis
The market has been under continuous pressure after the earlier bearish divergence played out, leading to sustained downside momentum. Right now, Bitcoin is at a decisive zone, and three possible scenarios can unfold:
1️⃣ Dump Continuation:
Price could extend its fall toward the 110K area. From there, a small bounce toward 115K is possible before further moves unfold.
2️⃣ Rejection at 115K:
If the bounce to 115K faces rejection, BTC will likely form a new higher low and then resume its downward trend.
3️⃣ Break Below 107K:
If the crucial 107K support is lost, this confirms a new lower low, opening the path for a sharper correction, possibly down to the 90K zone.
🔎 Current Outlook:
The bearish pressure is dominant, and a dump looks likely in the immediate short term (within the next 1–2 days). The coming sessions will decide whether Bitcoin holds higher support or sets a new lower low.
⚠️ Key Levels to Watch:
Support: 110K / 107K
Resistance: 115K
Downside Target if breakdown confirms: 90K

Manappuram Buy With Target of 380If Manappuram Closes Above 230 Level in Monthly Candle, Possible to Touch 380 in Long Term

HL printed.SEARL Analysis
Closed at (01-09-2025)
HL printed.
Upside targets can be around 123
& then 130
102 - 107 was a very strong Support level.
However, 106 should be the SL now.

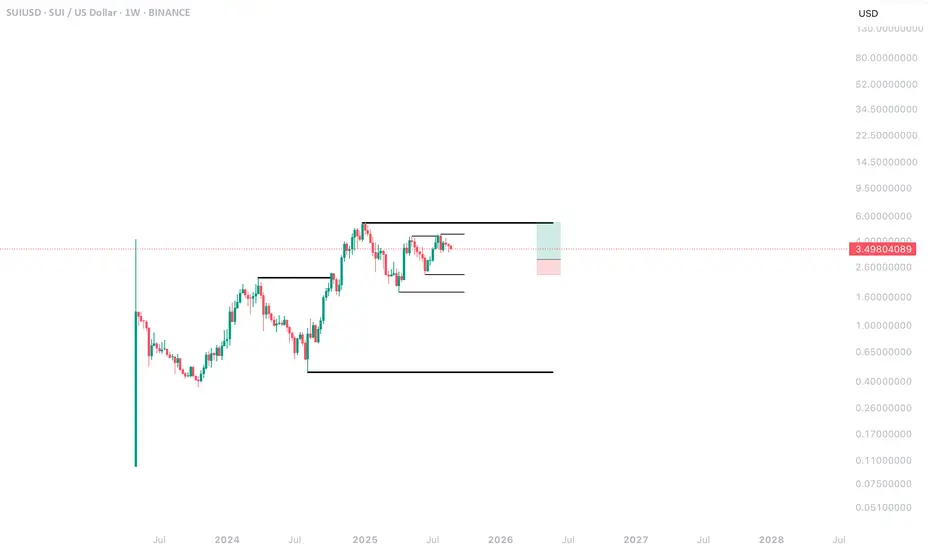
SUI Weekly AnalysisBeen following SUI for a while now and bullish formation still intact.
Being patient for the “right” trade.
What does the “right” trade look like?
I’m looking for price to enter or come close to the last higher low in the most recent fractal. You can see me tracing HH & HL within a higher timeframe to verify direction.
To be more specific, I’m looking to enter around the last sell (supply) on the 4HR/1HR. I should see either a BOS or no new lows being made inside my defined range.
An analogy I like to use is I must trade like Jerome Powell cuts rates. I need to first see evidence that the “economy” (price) is changing.
Risk management is rule #1. If it doesn’t fit, be patient. There will always be another opportunity. ALWAYS!!!
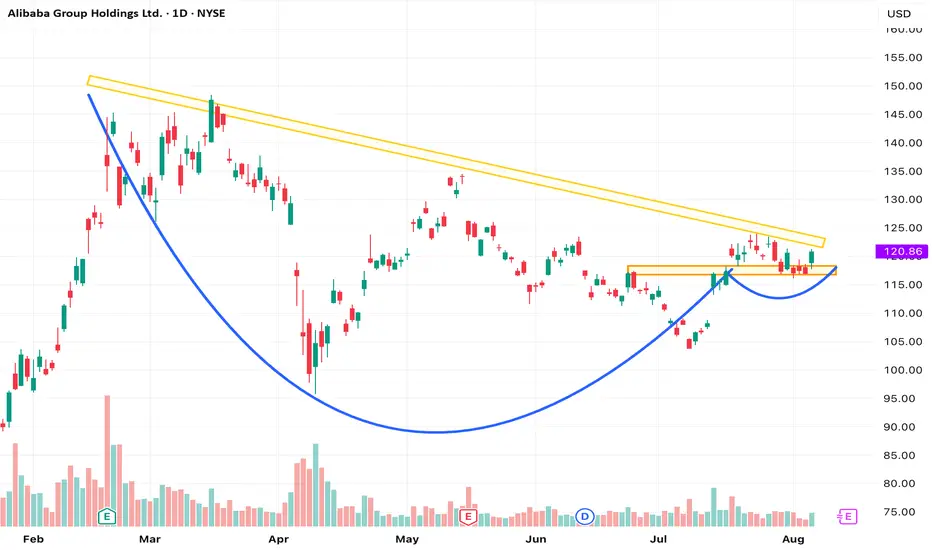
BABA – Cup and Handle Breakout with First HH/HLNYSE: BABA is forming a cup and handle pattern, with price breaking above the previous lower high, marking the first higher high and higher low in this potential trend reversal. Structure is turning bullish with momentum building.
$Btc Bounce Signal is Locking in on the $108.5k Golden Pocket Bitcoin recently formed a higher low around the $111,600 level, which is an important structure to watch. This setup is still bearish in nature because if BTC loses this $111.6K support, it will confirm a deeper bearish trend taking hold. Right now, BTC is pulling back after being rejected at $115,000 and heading towards this crucial $111.6K zone.
If this support holds, we might see some relief or a bounce. But if it breaks, the next key area is the Fibonacci Golden Pocket between $107,000 and $108,000 — a critical level where bulls often try to defend. Failure to hold even the Golden Pocket would strengthen the bearish outlook further.
BTC is at a decisive point, and traders should closely watch how price behaves around these levels to understand if a recovery or a deeper drop is on the cards.

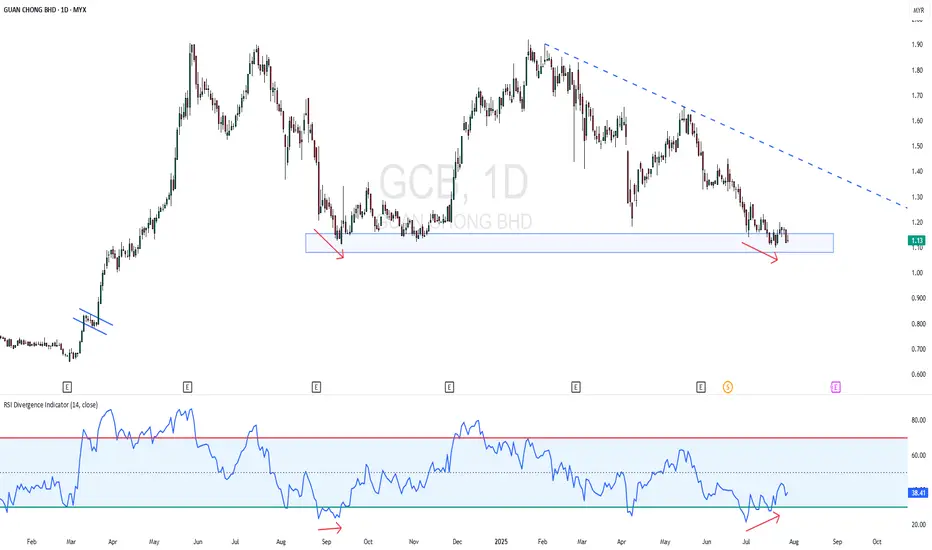
GCB - Near 52 Week LowGCB - CURRENT PRICE : RM1.13
GCB is in a downtrend as the highs and lows both getting low. The stock is near 52 Week Low. However, the stock may rebound higher for short term as there is a bullish divergence in RSI. Price is making lower low while RSI making higher low. Rising in RSI reading indicating there is slightly bullish momentum picking up. Aggressive trader may anticipate for buying with tight stop loss level.
ENTRY PRICE : RM1.13
TARGET : RM1.20 (+6.30%)
SUPPORT : RM1.10 (-2.65)
DRBHCOM - The LOW is getting HIGHER !DRBHCOM - CURRENT PRICE : RM0.815
The stock made a HIGHER LOW recently - this may consider as a half portion of new uptrend is completed. A breakout above RM0.930 will form the higher high structure - which confirm the new uptrend phase.
For short term trading purposes, short term traders may anticipate to buy if the stock breakout nearest resistance of RM0.830 - which will give an entry point at RM0.835. So this is a pending breakout stock. Nearest target will be RM0.870 and RM0.910. While support will be RM0.795. Take note also that MACD give a bullish hint.
ENTRY PRICE : RM0.835
TARGET : RM0.870 and RM0.910
SUPPORT : RM0.795
Notes : If the stock breakout RM0.930 in the future, it is a sign of strong bullish momentum (strong uptrend). So at that particular time, trend follower traders may anticipate to buy at RM0.935 - RM0.940.

Wait for HL to Print.BFAGRO Closed at 40.95 (30-06-2025)
Now wait for HL to print. First support is around 40 and next one is around 38 - 38.50

$BANANOUSDT New ATH possible, nay, plausible??
An extreme local inverse head and shoulders formation can be observed in the area circled in white.
trading just under local VWAP, great entry for anyone lacking potassium.
HL double bottom observable on the daily chart.
if recent trends continue to develop, a strong surge past $0.00162477 could lead to a increase in momentum.
$0.00210914 would be the next resistance, although weaker than the one currently testing. if price continues to develop past $0.00236478, ill be looking for TP1 at $0.00274825, another rough patch through til $0.00339408 follows, about 50% thru that zone would be a good TP2 and 100% thru the zone would be my TP3. the last major resistance would be at $0.00385154 (TP4). after that, a new ATH for COINEX:BANANOUSDT becomes an increasing plausibility. i am long potassium at $0.00143801
ANYONE HAVE MUSCLE CRAMPS?
BLong

Extremely Bullish.Closed at 281.50 (05-06-2025)
Extremely Bullish.
But 289 - 290 is an Important Resistance.
Needs to cross & sustain 295 - 308 Zone for
further upside.
as mentioned in yesterday's video, 277 - 279
may act as Support.
Breaking 272 will bring more selling pressure.

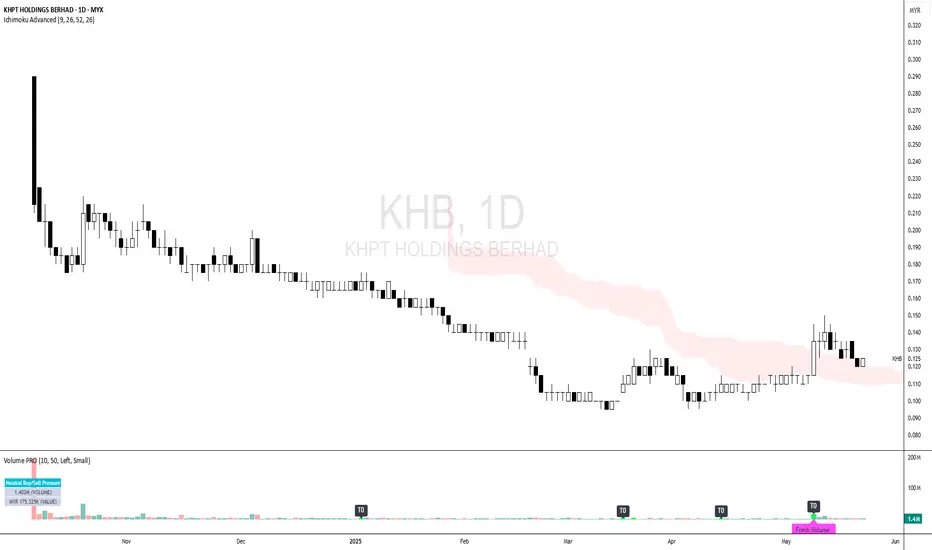
KHB - Downtrend Phase is FINISHED ?KHB - CURRENT PRICE : RM0.125
KHB was in downtrend since its listing day on 08 OCTOBER 2024. Recently the stock price rise with a bullish candlestick on 09 MEI 2025. The stock is making higher high and higher low. This indicates that the downtrend may end. At current price, it gives an attractive RISK REWARD RATIO.
ENTRY PRICE : RM0.125
TARGET PRICE : RM0.140 (+12%) and RM0.150 (+20)
SUPPORT : RM0.115 (-8%) --- The low of long white candle
Though still in Uptrend, but BNL Closed at 37.39 (25-03-2025)
Though still in Uptrend, but
as mentioned earlier, bearish divergence
has started appearing on bigger tf, so
cautious approach should be taken.
It may re-test 35.20 - 36.20 & bounce as this
is an important Support level.
Otherwise next Support seems to be around
32.30 - 32.50

Play on LevelsGGL - Closed at 15.67 (23-05-2025)
Ideal Support levels:
S1 around 15.07 - 15.15
S2 around 13.86 - 14
S3 around 12.80 - 13
Upside targets can be around 17-18
if these supports are respected.
