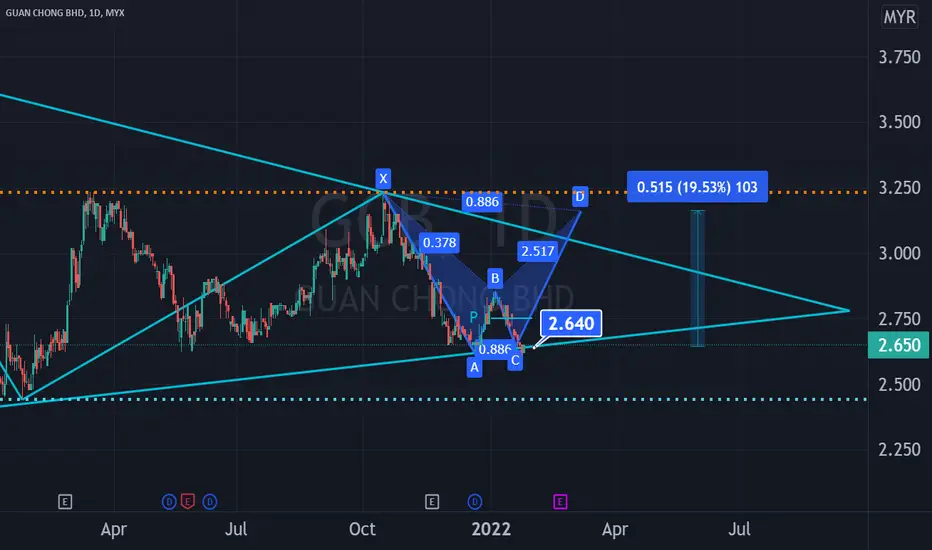
GCG in Triangle and Harmonic PatternConsider to study and monitor GCB's current daily chart which reseombles both a bearish bat harmonic pattern and a triangle pattern.
Next report date
—
Report period
—
EPS estimate
—
Revenue estimate
—
0.14MYR
100.93 MMYR
5.32 BMYR
191.23 M
About GUAN CHONG BHD
Sector
CEO
Hoe Lian Tay
Headquarters
Pasir Gudang
Website
Employees (FY)
1.44 K
Founded
2004
ISIN
MYL5102OO008
FIGI
BBG000BW4T80
Guan Chong Bhd. operates as an investment holding company. The firm engages in the manufacturing, distributing, and trading of cocoa-derived food ingredients, namely cocoa mass, cocoa butter, cocoa cake and cocoa powder. It operates through the following geographical segments: Malaysia, Singapore, Indonesia Germany, and Others. The company was founded on March 22, 2004 and is headquartered in Pasir Gudang, Malaysia.
Guan Chong Berhad. A hidden gemFundamentally strong company. The next financial result is essential as we will be able to assess whether the company is able to increase their dwindling profit margin. I anticipate revenue will be above RM1bil, but as for profits...time will show. A fundamentally strong company, I believe GCB is a


GCB (5102) BURSA MALAYSIA 3/3/21The study is based upon Volume Price Spread Analysis and M omentum
Major Trend-line breached.
Close: 3.02
EP: 3.08-2.96
Sl: 2.65
TP:3.29/Open
Disclaimer: This study does not constitutes Buy/Sell per say. Please consult your financial advisor before making any trading/investing decision.

GCB looking to break trendlinePrice crossed EMA50 and EMA200 with solid volume.
Future ichi cloud going to turn green.

GCB - Up momentumGCB - Up momentum
Note: For Interested to subscribe the VT MCDX Smart Money Plus, and pls contact owner
(Disclaimer: for demonstrate own planned trade records study only and education purpose, not for recommend to buy or sell. Trade at your own risk)

GCB - MID-TERM REBOUND TOWARDS 3.25IDEAS:
1. Mid term rebound
2. BBD +ve
3. MCDX Smart Money entrance
4. Bankers collection started and going strong
4. Target to reach 3.25. A 25% upside.

GCB - V-Shape RecoveryGCB
Rst: 3.48
Spp: Upper BB
On the verge to Fibo Extension first tier resistance at 3.48, the widening of BB and strongly surge RSI suggests further upside to unfold.


See all ideas
An aggregate view of professional's ratings.
Trade directly on the supercharts through our supported, fully-verified and user-reviewed brokers.


Frequently Asked Questions
The current price of GCB is 4.04 MYR — it has increased by 0.50% in the past 24 hours. Watch GUAN CHONG BHD stock price performance more closely on the chart.
Depending on the exchange, the stock ticker may vary. For instance, on MYX exchange GUAN CHONG BHD stocks are traded under the ticker GCB.
GCB stock has fallen by 3.58% compared to the previous week, the month change is a 12.22% rise, over the last year GUAN CHONG BHD has showed a 85.32% increase.
We've gathered analysts' opinions on GUAN CHONG BHD future price: according to them, GCB price has a max estimate of 5.30 MYR and a min estimate of 5.08 MYR. Watch GCB chart and read a more detailed GUAN CHONG BHD stock forecast: see what analysts think of GUAN CHONG BHD and suggest that you do with its stocks.
GCB stock is 3.03% volatile and has beta coefficient of 0.41. Track GUAN CHONG BHD stock price on the chart and check out the list of the most volatile stocks — is GUAN CHONG BHD there?
Today GUAN CHONG BHD has the market capitalization of 4.72 B, it has increased by 0.71% over the last week.
Yes, you can track GUAN CHONG BHD financials in yearly and quarterly reports right on TradingView.
GUAN CHONG BHD is going to release the next earnings report on Aug 19, 2024. Keep track of upcoming events with our Earnings Calendar.
GCB net income for the last quarter is 92.04 M MYR, while the quarter before that showed 15.25 M MYR of net income which accounts for 503.44% change. Track more GUAN CHONG BHD financial stats to get the full picture.
As of Jul 27, 2024, the company has 1.44 K employees. See our rating of the largest employees — is GUAN CHONG BHD on this list?
EBITDA measures a company's operating performance, its growth signifies an improvement in the efficiency of a company. GUAN CHONG BHD EBITDA is 468.77 M MYR, and current EBITDA margin is 7.74%. See more stats in GUAN CHONG BHD financial statements.
Like other stocks, GCB shares are traded on stock exchanges, e.g. Nasdaq, Nyse, Euronext, and the easiest way to buy them is through an online stock broker. To do this, you need to open an account and follow a broker's procedures, then start trading. You can trade GUAN CHONG BHD stock right from TradingView charts — choose your broker and connect to your account.
Investing in stocks requires a comprehensive research: you should carefully study all the available data, e.g. company's financials, related news, and its technical analysis. So GUAN CHONG BHD technincal analysis shows the buy rating today, and its 1 week rating is buy. Since market conditions are prone to changes, it's worth looking a bit further into the future — according to the 1 month rating GUAN CHONG BHD stock shows the buy signal. See more of GUAN CHONG BHD technicals for a more comprehensive analysis.
If you're still not sure, try looking for inspiration in our curated watchlists.
If you're still not sure, try looking for inspiration in our curated watchlists.