Higher Highs Higher Lows - EICHERMOT📊 Script: EICHERMOT
📊 Sector: Automobile
📊 Industry: Automobiles - Motorcycles / Mopeds
Key highlights: 💡⚡
📈 Script is trading in Upward moving channel and forming Higher Highs Higher Lows on daily chart.
📈 One can go for Swing Trade.
⏱️ C.M.P 📑💰- 4941
🟢 Target 🎯🏆 - 5073
⚠️ Stoploss ☠️🚫 - 4808
⚠️ Important: Always maintain your Risk & Reward Ratio.
✅Like and follow to never miss a new idea!✅
Disclaimer: I am not SEBI Registered Advisor. My posts are purely for training and educational purposes.
Eat🍜 Sleep😴 TradingView📈 Repeat 🔁
Happy learning with trading. Cheers!🥂
Higherlow

Unlock the Secrets of Gold Trading: Pericles' Ancient WisdomIn this video, we explore the profound perspectives on fear from historical figures like Pericles and modern thinkers like Ryan Holiday. Pericles, the esteemed Athenian statesman, saw fear as a natural emotion that should not paralyze us. He believed in confronting fear with courage, rational thought, and strategic planning, using it as a tool for effective decision-making.
Ryan Holiday, drawing on Stoic philosophy in his works, echoes these sentiments with stories of historical figures who turned fear into fuel for success. He recounts how John D. Rockefeller faced market crashes with calm calculation and how Theodore Roosevelt overcame health challenges by embracing adversity.
Both Pericles and Holiday teach us that fear, when managed correctly, can become a powerful ally. By acknowledging fear, confronting it with rationality and courage, and using it to sharpen our focus and strategy, we can transform challenges into opportunities for growth and success. This approach is especially relevant in the realm of trading, where mastering fear can lead to better decision-making and greater resilience.
Key Levels and Patterns:
Higher Highs (HH) and Higher Lows (HL):
The chart shows a series of higher highs (HH) and higher lows (HL), indicating an overall uptrend. This pattern suggests that the bullish momentum is still in play.
Ascending Channel:
There is a well-defined ascending channel where the price has been moving upwards within parallel trendlines. This channel can act as a guide for potential support and resistance levels.
Reversal Points (LQZ):
1-Hour LQZ / Reversal Point: Located at 2,429.190. This level is a potential area where price may reverse or find support.
4-Hour LQZ / Reversal Point: Located at 2,391.394. This level also serves as a significant support zone.
Take Profit (TP) Levels:
TP 1: 2,319.385
TP 2: 2,288.085
TP 3: 2,265.369
Recent Price Action:
The price recently reached a higher high at around 2,458.755 and then pulled back slightly, indicating a potential short-term correction within the overall uptrend.
The ascending channel suggests that if the price remains above the lower boundary of the channel, the uptrend is likely to continue.
If the price breaks below the 1-hour LQZ / Reversal Point at 2,429.190, it could test the 4-hour LQZ / Reversal Point at 2,391.394. A further breakdown below this level might lead to the next support at TP 1.
Analysis Summary:
Bullish Scenario: The price could bounce from the current levels or the lower boundary of the ascending channel, aiming for new highs. Traders might look for buying opportunities near the support levels of the channel and reversal points.
Bearish Scenario: If the price breaks below the identified reversal points and the ascending channel, it might signal a deeper correction, potentially heading towards the TP levels for possible buying opportunities at lower prices.
By applying Pericles' wisdom of confronting fear with rationality and Ryan Holiday's insights on turning fear into strategic advantage, traders can approach these levels with a clear, disciplined mindset, making informed decisions even in volatile market conditions.

SWING IDEA - RBAPrice Action made a retest @ 90 levels and MACD started making a Higher Low Pattern formation, which took the stock up to 50%+ profits.
Another MACD Cross is in play now at a good zone.
Ideally it should take the stock easily to its previous Swing High and possible even higher.
Stock is currently at a good buying zone. Let's see how the Price Action plays out for the new MACD Cross now.

GOLD - NEW BREAKOUT 📉
As we talked in the previous analysis:
The GOLD price reached a strong resistance level (2399.695 - 2431.590).
Currently, the higher low is broken!
So, i predict a bearish move📉
---------------
TARGET: 2304.000🎯

EURUSD - BEARISH SCENARIO 📉
As We Talked in The Previous Analysis:
The Price Has Pulled Back to The Resistance Line.
Currently, The Market Created a New Higher Low.
So, Let's Expect The Bearish Scenario:
if The Price Breaks The Higher Low and Closes Below That,
We Will See a Bearish Move📉
_________
TARGET 1: 1.06670🎯
TARGET 2: 1.05755🎯

Higher Highs Higher Lows - Short Sell - VTL📊 Script: VTL
📊 Sector: Textiles
📊 Industry: Textiles - Cotton/Blended
Key highlights: 💡⚡
📈 Script is forming Higher Highs Higher Lows patterns on daily chart.
📈 We may see stock price at 422 on downwards.
📈 One can go for Short Swing Trade.
⏱️ C.M.P 📑💰- 438
🟢 Target 🎯🏆 - 422
⚠️ Important: Always maintain your Risk & Reward Ratio.
✅Like and follow to never miss a new idea!✅
Disclaimer: I am not SEBI Registered Advisor. My posts are purely for training and educational purposes.
Eat🍜 Sleep😴 TradingView📈 Repeat 🔁
Happy learning with trading. Cheers!🥂

Ethereum - Forming A Base Like So Many Times Before ?#ETH
Ethereum is forming higher lows and a higher high while bouncing off support ATM
This bottoming structure has been formed similarly many times in this pair.
All while sentiment is a like a funeral procession & ETH ETFs are loading in the background
Probably Nothing...

EURCAD - NEW BREAKOUT 📉Hello Traders !
On Thursday 25 April, The EURCAD Price Reached The Resistance Line and Failed To Break it !
The Last Higher Low is Broken (Change of Character).
So, I Expect a Bearish Move 📉.
-----------
TARGET: 1.45965🎯

#HIGH/USDT#HIGH
The price is moving in a downward channel on a 1-hour frame, about to break upward
We have a downtrend on the RSI indicator about to occur. Bounce up
We have a higher stability moving average of 100
Entry price: 2.16
First goal 2.23
Second goal 2.30
Third goal 2.37

AUDNZD: Bullish Divergence Sparks Reversal Potential📈 Overview:
AUDNZD, previously bearish, now displays bullish divergence with the formation of the first higher low and higher high on the 1-hour timeframe. Market sentiment at 94% long adds strength to the reversal signal.
📊 Technical Analysis:
Bullish divergence, coupled with higher lows and higher highs, indicates a potential trend reversal.
📉 Market Sentiment:
With 94% long sentiment, there is strong support for the anticipated bullish reversal.
📉 Trade Strategy:
Consider long positions, aligning with the bullish signals, and anticipate further upward movement.
🛑 Risk Management:
Mitigate risks with effective stop-loss orders to protect capital.
📈 Conclusion:
AUDNZD offers a concise opportunity for a bullish trend reversal, supported by bullish divergence and strong market sentiment. Monitor for confirmation and adjust positions accordingly.

USDCAD potential buyusdcad is making higher highs and higher lows on higher time frames and on the 4hr intraday time frame price is respecting support so i decided to get in at a one hour engulfing i also gave an update on AUDCAD.While AUDCAD is moving in a downward direction showing selling pressure at the moment i am waitin fot it to play out as planned.

Higher High Higher Lows - VARDHMAN ACRYLICS📊 Script: VARDHACRLC
📊 Sector: Textiles
📊 Industry: Textiles - Manmade
Key highlights: 💡⚡
📈 Script is trading at upper band of BB and giving breakout of it.
📈 MACD is giving crossover .
📈 Double Moving Averages giving crossover.
📈 Right now RSI is around 67.
📈 Script is making Higher High Higher Lows as shown in chart.
📈 One can go for Swing Trade.
⏱️ C.M.P 📑💰- 72
🟢 Target 🎯🏆 - 80
⚠️ Stoploss ☠️🚫 - 68
⚠️ Important: Always maintain your Risk & Reward Ratio.
✅Like and follow to never miss a new idea!✅
Disclaimer: I am not SEBI Registered Advisor. My posts are purely for training and educational purposes.
Eat🍜 Sleep😴 TradingView📈 Repeat 🔁
Happy learning with trading. Cheers!🥂

Is this the start of bull run in IRFC?Irfc was consolidating right from its listing in 2021. However, few months back, it gave a huge breakout from its supply zone of 25 to go upto 37 levels.
It has recently given a retest of same level and going up to test the levels of 37 again.
If 37.1 is broken, a higher high, higher low trend can be confirmed on weekly basis and it will indicate that a bull run might finally start in IRFC.
Definitely, a safe bet for long term considering the huge developments taking place in railway field.

EURAUD BUYEuraud is making higher highs and higher lows all acorss the board.
* I'm predicting Euraud to be making a new higher low
* lower timeframes 4hr to be exact has broken structure to the upside showing bullish pressure

GBPUSD - 2 SCENARIOS 📉📈Hello Traders !
Today, The GBPUSD Price Reached A Resistance Level (1.24980 - 1.25484)
Currently We Have 2 Scenarios:
Bullish Scenario📈
If The Price Breaks and Closes Above The Resistance Level !
We Will See a Bullish Move📈
TARGET: 1.27000🎯
Bearish Scenario📉
If The Market Breaks Higher Low and Closes Below That
I Will Sell On Retest...
TARGET: 1.22260🎯

XAUUSD - Bearish Scenario📉Hello Traders !
The GOLD Price Reached a Resistance Level (2003.916 - 2009.565)
So We Have a Bearish Scenario:
If The Market Breaks The Higher Low and Closes Below That
I Will Sell On Retest...
TARGET: 1969.000🎯

When Madras Fertilizer is set to be a quick Riser.Madras Fertilizers Limited is engaged in the manufacturing of Urea and Complex Fertilizers. It is also involved in manufacturing Bio-fertilizers and trading eco-friendly Agro Chemicals, Organic Manure, and City Compost under the brand name ‘Vijay’
The Co has proposed to set up a 20 MW gas-based power plant with Gas turbine along with Heat recovery by steam generation. It is expected to be funded through the sale of vacant Land in Guindy and Manali and the rest through internal accruals
The Co has changed feedstock from Naptha to RLNG which has resulted in reduction in the cost of production of urea.
The Co is concentrating on product diversification under which two new projects have emerged which are under the study of technical feasibility and financial viability.
Market Cap 1,216 Cr.
Stock P/E 6.56
Industry P/E 10.2
ROCE 26.8 %
EPS 11.5
EPS preceding year 10.1

EURUSD IDEAMy next trade will be eurusd,we see large bearish candles so sellers are in control,as pullback occurs it should show small bull candles,wait for a confirmation beafore entry.
We can se price before rejected the blue line,so bearish candles broke the lowest point.
Happy trading everyone! As always risk menagment is the key to sucess!

USDJPY IDEASo after a long time,i wanted to publish this trading idea,we see clear uptrend on a 1hr chart,but didnt manage to break hh,made hl,so now we wait for a break and retest,and of course a confirmation candle to enter a short position for around 100pips

NQ1! 100 E-mini Futures 1HNQ1! 100 E-mini Futures 1H
Signals:
1. Market structure : Higher High, Higher Low.
2. Mommentum channel PULLISH.
3. Indicator: RSI - hidden divergence RSI
4. Gap

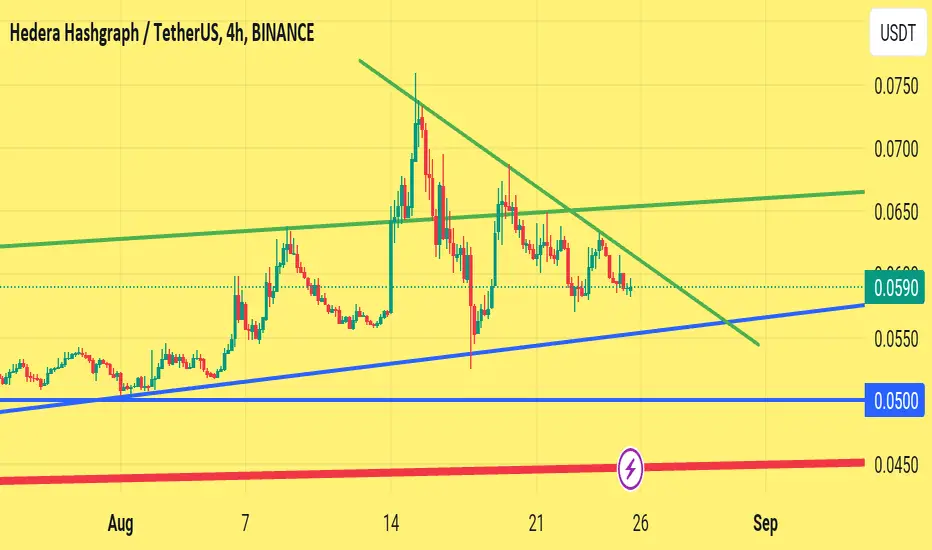
Hbar Decision time#Hbar, if it breaks any green trendline then it pump.
If it breaks any blue trendline then it will dump because a trend of higher high higher low will breakdown.
Decision time is coming soon.
SAIL-DAILY/WEEKLY/MONTHLY-BreakoutNSE:SAIL
Stock is near verge of breakout 90-91 level. It has formed a rounding bottom near support levels.
As per the weekly chart it is creating higher lows from past few weeks. Currently there is a inside candle formed in weekly timeframe. However, it needs 3 more days to get confirmed how it will appear.
I still believe that the stock is bullish above 87-86 levels. If it goes for retest, it will be good opportunity to accumulate some qty around 88.50.
We can keep SL around 85, it has potential to go upside T- 100, T2- 110.
This is only for educational purpose, please manage your risk accordingly.

CASTROLIND-DAILY/WEEKLY/MONTHLY-BREAKOUTNSE:CASTROLIND
Stock is consolidating in a channel from past 8 years. From last year it’s started to making higher low in weekly/Monthly Chart.
Monthly : As per monthly analysis stock has shown a bullish engulfing at bottom levels.
Weekly:
• June 2nd week we can see a big green candle engulfing past multiple weeks.
• June 3rd week there is rejection candle (Inverted Hammer). Things get interesting over here. The rejection candle didn’t get follow through.
• If we look carefully whole week the stock was trading between the range. July first week we can see a boom!
Daily: We can see buying from 122-123 levels from last few days and on Friday (7th July) We can see a big green candle with good volume.
It’s good time to go long for 155-160 targets.
SL: 117
I have already taken this trade.
This is only for educational purpose, please manage your risk accordingly.
