ADANI ENTERPRISES STAGES!!BLUE CIRCLE: is the consolidated market after the nifty 50 gave its bull run recently after June 20th.
ORANGE CIRCLE: is the buying and selling, basically the manipulation of stocks for the short period.
RED CIRCLE: and now the current stage, where the stock is forming A HIGHER LOWS PATTERN, chance to give a breakout.
PURPLE LINE: is a support.
Higherlow

CDAY - will earnings be the catalyst?CDAY has formed an inverse H&S and is now trading close to it's 200 day moving average. However, the stock might not be on a sustainable uptrend just yet until it can clear the neckline around 70.80.
With earnings expected on 2nd Nov (AMC), let's see if it could propel the stock above the neckline. When it does, it is still prudent to place an initial stop loss (say) just 5% below the neckline (to avoid sharp drawdowns). It is always better to keep losses small and re-enter when technicals look right again.
Disclaimer: Just my 2 cents and not a trade advice. Kindly do your own due diligence and trade according to your own risk tolerance and don't forget that money management is important! Take care and Good Luck!
C

USDCHF Target Price 1.00739Take Profit at price level 1.00739 for USDCHF. Higher lows in the market indicates bullish activity.

Market is Going CrazyHey Everyone,
My last post about BTCUSDT talked about how a major pullback could happen after closing above the trendline. I mentioned some bullish factors and bearish factors, even though I leaned toward a bullish move, the price has not stopped dropping until it retested the longer time frame trendline that it broke above.
Right now, the price has been very volatile. However, looking at the H4 time frame, the price has just made a higher low following the retest of the trendline, which is a shift in market structure.
Looking at the H1 time frame, we are seeing a double bottom followed by huge volatile moves. (Market is Going to Crazy)
In conclusion, I think that we are going to witness some bullish moves until we reach the 20350 level.


AUDCAD Target Price 0.896AUDCAD currency pair is moving as expected. Expect AUDCAD price to increase.

WIX: Bear market rally?Wix.Com
Short Term - We look to Buy at 65.69 (stop at 58.33)
Although the bears are in control, the stalling negative momentum indicates a turnaround is possible. The trend of higher lows is located at 60.00. A weaker opening is expected to challenge bullish resolve. Support is located at 65.00 and should stem dips to this area. Preferred trade is to buy on dips.
Our profit targets will be 84.99 and 92.00
Resistance: 85.00 / 110.00 / 200.00
Support: 65.00 / 53.00 / 34.00
Please be advised that the information presented on TradingView is provided to Vantage (‘Vantage Global Limited’, ‘we’) by a third-party provider (‘Signal Centre’). Please be reminded that you are solely responsible for the trading decisions on your account. There is a very high degree of risk involved in trading. Any information and/or content is intended entirely for research, educational and informational purposes only and does not constitute investment or consultation advice or investment strategy. The information is not tailored to the investment needs of any specific person and therefore does not involve a consideration of any of the investment objectives, financial situation or needs of any viewer that may receive it. Kindly also note that past performance is not a reliable indicator of future results. Actual results may differ materially from those anticipated in forward-looking or past performance statements. We assume no liability as to the accuracy or completeness of any of the information and/or content provided herein and the Company cannot be held responsible for any omission, mistake nor for any loss or damage including without limitation to any loss of profit which may arise from reliance on any information supplied by Signal Centre.

CL1! sellSMC ;
Maybe a higher low to build a bear flag or retest for the trend broken and goes up .
Note : PLEASE do your own analyse befor u take this trade cause it's my first time in tradingview
thanks for your support and welcome for any advices
god bless u all

higher low ETH Hey ETH dipped its weekly RSI at higher low log scaled - should be bullish for sure. Lets hope it marks some nice trend again #doggonacci

Pip Goal: 246.1 Pips (EURNZD)EURNZD appears to be bullish due to the previous higher low that formed.

Upst is going up?Curious about your opinion.
What is you're analysis?
What I see:
- support on the volume shelf (daily chart)
- Volume is rising (daily chart)
- support on the moving averages (daily chart)
- higher high (daily chart)
- moving averages are rolling over
- broke the 4 sma on the weekly
- support at the all time low on the montly
- higher highs, higher lows on the 4 h chart
- rising trendline on the 4 h chart
- trading at the bottom of the channel that started 26-july, could serve as support
- soared 42% over 15 days so it could be an overbought situation
What is your opinion?
This is no financial advice.
NASDAQ:UPST

BTC HH-HL TREND UPDATE!!Hello everyone, if you like the idea, do not forget to support with a like and follow.
Welcome to this BTC update. BTC is once again rejected from the $24.2k resistance area and currently trading around the $23k level.
As you see in the chart, BTC is trading in an uptrend. It is clearly forming Higher highs and higher lows. The previous higher low was BTC made around the $20.8k level. So now there are two possible scenarios.
BTC has two important supports at $22.6k and $$21,5k so these two could be our new higher low. And after making this new higher low I'm expecting a good pump in the market and BTC might reach up to the $26k-$27k level by the end of August.
If you like this idea then do support it with like and follow.
Also, share your views in the comment section.
Thank You!

AORT Double Top?We see higher lows since mid may and in recent weeks some consolidation in the $18-$20 range. Price recently tested short term support at 17.95 and rebounded testing the .61 fibonacci level.
Several bullish signals:
1. MACD cross
2. D+ crossing D- on the ADX
3. On balance volume confirming price
The most recent candle made a potential double top so I would like to see an increase in volume and a close above $20.10 to initiate a swing trade to the long side.
targeting: 21.37, 22.99

GlenmarkHello and welcome to this analysis
Glenmark after consolidating near its monthly support attempted a fresh upmove from 350 to 400, Post that it has made a sideways corrective forming a Bullish Harmonic ABCD.
The current reversal from 375 could be a higher low of the new uptrend in it and it could rally till 410-425-450 as long as it does not breach 374. Confirmation if it sustains above 390.
Good risk reward set up scenario of a higher low formation which could lead to a higher high thereon till its falling trendline

xela double top breaklooking for a higher low near previous pivot (0.1170) and an intraday pattern for entry for
(0.1364) pivot break.
XLong

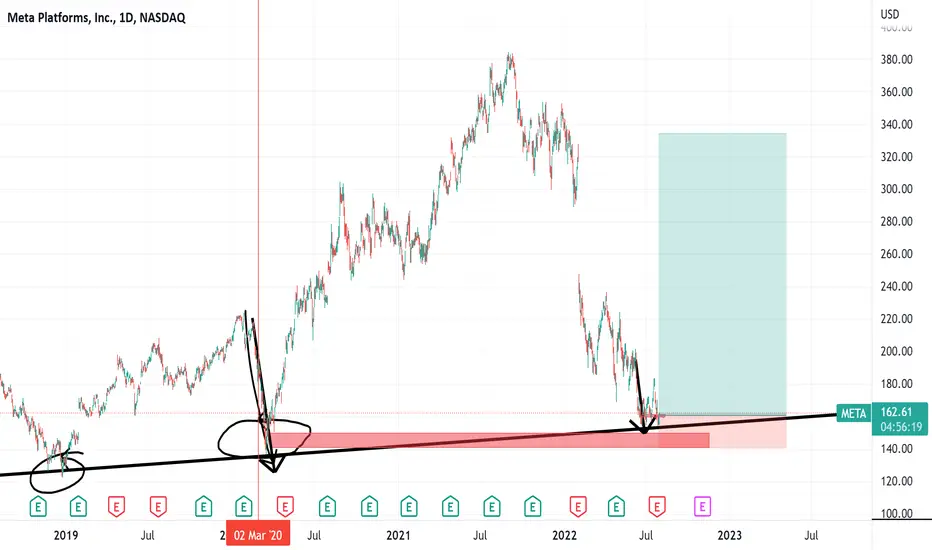
META: Higher low is a good signal!Meta
Short Term - We look to Buy at 164.56 (stop at 150.26)
Although the bears are in control, the stalling negative momentum indicates a turnaround is possible. There is scope for mild selling at the open but losses should be limited. Prices expected to stall near trend line support. Further upside is expected although we prefer to set longs at our bespoke support levels at 160.00, resulting in improved risk/reward.
Our profit targets will be 200.00 and 210.00
Resistance: 200.00 / 220.00 / 250.00
Support: 160.00 / 140.00 / 120.00
Please be advised that the information presented on TradingView is provided to Vantage (‘Vantage Global Limited’, ‘we’) by a third-party provider (‘Signal Centre’). Please be reminded that you are solely responsible for the trading decisions on your account. There is a very high degree of risk involved in trading. Any information and/or content is intended entirely for research, educational and informational purposes only and does not constitute investment or consultation advice or investment strategy. The information is not tailored to the investment needs of any specific person and therefore does not involve a consideration of any of the investment objectives, financial situation or needs of any viewer that may receive it. Kindly also note that past performance is not a reliable indicator of future results. Actual results may differ materially from those anticipated in forward-looking or past performance statements. We assume no liability as to the accuracy or completeness of any of the information and/or content provided herein and the Company cannot be held responsible for any omission, mistake nor for any loss or damage including without limitation to any loss of profit which may arise from reliance on any information supplied by Signal Centre.

GOOG: Have we reached the bottom?Alphabet
Intraday - We look to Buy at 2214 (stop at 2105)
Buying pressure from 2150 resulted in prices rejecting the dip. This is positive for sentiment and the uptrend has potential to return. There is scope for mild selling at the open but losses should be limited. Prices expected to stall near trend line support. Dip buying offers good risk/reward.
Our profit targets will be 2549 and 2600
Resistance: 2555 / 2860 / 3032
Support: 2140 / 1900 / 1600
Please be advised that the information presented on TradingView is provided to Vantage (‘Vantage Global Limited’, ‘we’) by a third-party provider (‘Signal Centre’). Please be reminded that you are solely responsible for the trading decisions on your account. There is a very high degree of risk involved in trading. Any information and/or content is intended entirely for research, educational and informational purposes only and does not constitute investment or consultation advice or investment strategy. The information is not tailored to the investment needs of any specific person and therefore does not involve a consideration of any of the investment objectives, financial situation or needs of any viewer that may receive it. Kindly also note that past performance is not a reliable indicator of future results. Actual results may differ materially from those anticipated in forward-looking or past performance statements. We assume no liability as to the accuracy or completeness of any of the information and/or content provided herein and the Company cannot be held responsible for any omission, mistake nor for any loss or damage including without limitation to any loss of profit which may arise from reliance on any information supplied by Signal Centre.

BTCUSDT needs to create the new Higher high!
the price bounced on the 33k area on the monthly support and got the liquidity until the 0.382 Fibonacci level as new resistance.
On the weekly timeframe, the price is testing the dynamic support.
On the daily timeframe, the price had a breakout from the dynamic support and now the price is testing the previous support as new resistance.
On the 4h timeframe the price had a breakout from the falling wedge and now it's trying to create a new higher high.
How we can approach it?
For a bullish scenario, the price needs to create a new higher high from that area above the 0.5 Fibonacci level (41k) with volume and momentum.
IF the price is going to lose the 4h support we could see a new bearish impulse until the next demand zone


ALPINE-Less sell pressure & higher lowsHello everyone
On Alpine daily chart ,we don't have much of perspective or structure,but we have a well preserved daily trend line, so if we consider the last 4 bars on daily chart a last bear flag (see in 4 hours), and that combined withe the higher lows that we see in daily,from here of in the next 2 candle we may see reversal happening.
For now,it's better to be traded in lower time frames.
our support levels are a trend line & price level of 5.25$, possible resistance level 6.2$

GOLD- bull flag on weekly Hello everyone
As I explained last time, there was possibility of lower prices here,and well we had a small bear flag on 4 hours .As for this week, we might have a small swing to the lower channel and a touch on 1920$ as the context implies we may face a steep bear market in the future, but for the structure on weekly, we have big bull flag and on daily If current support level hold the price we will have higher high's, and can see better future for XAUUSD.
Current support level 1930$, key support level 1920$, and our resistance level is 1960$.

Jublfood near breakout Jubilant Food which runs Dominos in India is trading near breakout zone.
Breaking above 2890 will make it a successful breakout.
Potential target is 3150.
