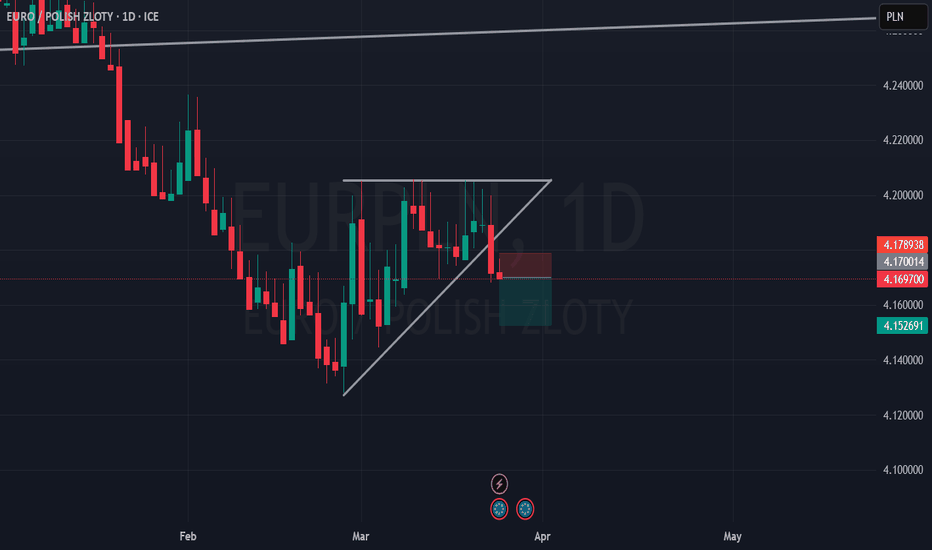
EUR/PLN 4H SHORT Selling Opportunity
Hello, I am Trader Andrea Russo and today I want to show you a SHORT investment opportunity on EUR/PLN. We are currently in a 4-hour chart (4H) and my indicator "WaveTrend + Multi-Timeframe Alerts", published in the SCRIPT section of my TradingView profile, signals an overbought situation both at
EURO / POLISH ZLOTY
4.258600PLNR
+0.036700+0.87%
At close at Apr 4, 21:15 GMT
PLN
No trades
Key data points
No news here
Looks like there's nothing to report right now
Zloty Long Trade SetupCurrent Position:
FPMARKETS:EURPLN recently approached the lower bound of its trading range for the past year, presenting an attractive entry point for a long trade.
Supporting Factors:
NBP Hawkishness: The National Bank of Poland's hawkish guidance at its December meeting has supported the
EURPLAN MARKET ANALYSIS AND PRICE PREDICTIONEURPLAN has started consolidating at the renegotiation zone. I think the final decision will favor the Bull. In few days if there is an order in favor of the Bulls, the it will retrace a little to retest the order block and give the Bulls a good entry position. Lets watch and see what will happen!
Polish Zloty target and trend channel supportFacts:
1) This is a third time price is testing the trend channel support.
2) We see on MACD oscillator is the reversal is started.
There is a possibility that the support will be broken, but the previous Global financial crisis, the EURPLN pair acted in the opposite direction. If this time mech
EURPLN Trade Signal: SellWe are issuing a Sell signal for the EURPLN currency pair. The entry price is set at 4.28464 , with a Take Profit target at 4.26977667 and a Stop Loss at 4.30147667 . This prediction is made using the EASY Quantum Ai strategy.
Trade Parameters:
Direction: Sell
Enter Price: 4.28464
Ta
EURPLN Short Trade SetupAfter conducting an analysis on EURPLN, we are excited to present our trade setup.
This opportunity boasts a favorable risk/reward ratio, although it does require patience due to a longer waiting period.
Nevertheless, swing traders may find this setup intriguing and worth considering.
EUR/PLN Bearish Momentum Building Below 200 EMA
⚫Back in April 2024, the EUR/PLN pair tested the 4.2500 support zone, where a triple bottom was established. Over the past five months, the price has consistently failed to break below this level. Simultaneously, we can identify a resistance area near 4.3750, where a double top was formed, indicati
See all ideas
Summarizing what the indicators are suggesting.
Oscillators
Neutral
SellBuy
Strong sellStrong buy
Strong sellSellNeutralBuyStrong buy
Oscillators
Neutral
SellBuy
Strong sellStrong buy
Strong sellSellNeutralBuyStrong buy
Summary
Neutral
SellBuy
Strong sellStrong buy
Strong sellSellNeutralBuyStrong buy
Summary
Neutral
SellBuy
Strong sellStrong buy
Strong sellSellNeutralBuyStrong buy
Summary
Neutral
SellBuy
Strong sellStrong buy
Strong sellSellNeutralBuyStrong buy
Moving Averages
Neutral
SellBuy
Strong sellStrong buy
Strong sellSellNeutralBuyStrong buy
Moving Averages
Neutral
SellBuy
Strong sellStrong buy
Strong sellSellNeutralBuyStrong buy
Displays a symbol's price movements over previous years to identify recurring trends.
Frequently Asked Questions
The current rate of EURPLN is 4.258600 PLN — it has increased by 0.87% in the past 24 hours. See more of EURPLN rate dynamics on the detailed chart.
The value of the EURPLN pair is quoted as 1 EUR per x PLN. For example, if the pair is trading at 1.50, it means it takes 1.5 PLN to buy 1 EUR.
The term volatility describes the risk related to the changes in an asset's value. EURPLN has the volatility rating of 1.29%. Track all currencies' changes with our live Forex Heatmap and prepare for markets volatility.
The EURPLN showed a 1.70% rise over the past week, the month change is a 2.54% rise, and over the last year it has decreased by −0.64%. Track live rate changes on the EURPLN chart.
Learn how you can make money on rate changes in numerous trading ideas created by our community.
Learn how you can make money on rate changes in numerous trading ideas created by our community.
Currencies are usually traded through forex brokers — choose the one that suits your needs and go ahead. You can trade EURPLN right from TradingView charts — just log in to you broker account. Check out the list of our integrated brokers and find the best one for your needs and strategy.
When deciding to buy or sell currency one should keep in mind many factors including current geopolitical situation, interest rates, and other. But before plunging into a deep research, you can start with EURPLN technical analysis. The technical rating for the pair is buy today, but don't forget that markets can be very unstable, so don't stop here. According to our 1 week rating the EURPLN shows the buy signal, and 1 month rating is sell. See more of EURPLN technicals for a more comprehensive analysis.


