(AFN) Long-Term Setup | Price: $ 23→ Target: Around $ 40📈🔭 Long-Term Forecast – AFN
⏳ This is a long-term outlook for AFN, which is currently trading near its lowest price levels since 2010 🕰️.
🔻 Price History & Pullback
📉 The stock declined from approximately $60 ➝ $20, representing around -66 % drop 🔻.
⚠️ This decline coincided with two consecutive years of revenue stagnation (2024–2025), showing .
💼 Fundamental Growth (Long-Term View)
🚀 Revenue expanded from $137M in 2007➝ $1.4B,in 2024 representing a +922% total increase over the long run 📊.
⛔ However, in 2024–2025 🕰️, revenue fell ~8–10% 🔻, leading to a bearish market reaction 📉.
🔮 Forward forecasts point to a return to +10–12% growth 📈, offsetting prior losses and supporting a bullish long-term outlook 🐂📊.
🧱 Major Long-Term Support Zone
📅 On the monthly timeframe, the $15 – $20 range represents a strong historical support zone 🛡️.
⏱️ This zone has held for 15+ years (0% breakdown rate), reinforcing its structural importance.
📊 Volume Profile Confirmation
🔵 The highest historical traded volume (100% peak volume node) is concentrated in this price range.
✅ This suggests maximum historical participation, confirming the area as a high-probability pullback zone.
📉➡️📈 Momentum & RSI Shift
📍 Monthly RSI reached ~30 (oversold) and has now started turning upward ⤴️.
⚡ This transition often precedes a positive momentum shift (%) after extended consolidation.
🔄 Cyclical Behavior & Seasonality
🔁 AFN historically forms major peaks every 1–4 years.
📆 Seasonality shows January–March frequently deliver 3 consecutive positive months, often producing double-digit % gains 📈📈📈.
🎯 Price Targets (2026)
🎯 Base target: $35 – $45 → +75% to +125% upside from $20
🚀 Extended target: $60 (previous high) → +200% upside, possible by late 2026, assuming forecasted growth resumes.
✅🧠 Conclusion
⭐ This setup represents a high-quality long-term opportunity, supported by:
✔️ –66.7% historical correction already priced in
✔️ 0% growth period fully absorbed by the market
✔️ Around 1000 % long-term revenue expansion
✔️ Oversold momentum + heavy volume accumulation
⏱️ At current levels, the risk-to-reward strongly favors long-term positioning (%) 💎📈
Highvolume

Fast Bounce Setup | Price: 53.98 $ → Target: 56.67 $ (+5%)📈 Stock: MDLZ – Mondelez International 🍫🏭
🟢 Entry: 53.98 ⚡
🎯 Exit / Target: +5% → ~56.67 💰📈
🧱 Technical Support Strength
Price is holding a strong demand zone 🧱🟢
Repeated buyer reactions = solid support ✅✅
High-confidence base 🔒📉
📊 Weekly RSI Reset
RSI is deeply oversold, signaling potential rebound.
🔽⚡📈Momentum reset = fuel reload ⛽🔥
Often leads to next bullish push 🚀📈
📍 Pivot + Structure Confluence
Both Weekly & Dayly pivot support + prior structure 🎯
Confluence = higher bounce probability 📈💥
Bullish reaction favored 🟢❌
📉➡️📈 Short-Term Outlook
🚀 Expected move: ~5% upside
🔄 Mean reversion in progress
⚖️ Risk / reward favors longs 👍
📆 Mid / Long-Term Outlook
✔️ Higher-timeframe trend intact 📈
✔️ Healthy pullback, not a breakdown 🔄
✔️ Swing & position friendly 🟢📊
💼📊 Fundamental Strength
📈 Consistent revenue & earnings growth
💰 Strong cash flow & defensive business model 🛡️
🌍 Global brand power + pricing strength 🍫🏆
🔮 High expected future growth based on analyst forecasts 🚀
Fundamentals + technicals = high-conviction setup 💎
✅ Final Summary
🧱 Strong support
📊 RSI reset
🎯 Pivot confluence
💼 Solid fundamentals
🔮 Growth outlook strong
➡️ Entry: 54.03 ⚡
➡️ Target: 56.67$ 💰🚀
➡️ Bias: Bullish continuation 📈🔥

(AAPL)Fast Bounce Setup | Price:$ 260.92→ Target:$274(+ 5 %)AAPL is showing signs of a short-term pullback after a strong upside move 🚀. Price is currently testing the EMA 100, which is acting as a major resistance level on the daily timeframe 🧱⚠️.
🕯️🕯️🕯️ Candle Confirmation
Three or more candles have already confirmed rejection near this EMA zone ❌📉, strengthening the pullback scenario.
📊⚙️ Momentum Check (RSI)
On the daily chart, RSI previously dropped to around 26 😮💨 and has now bounced back to 31 🔄. This behavior usually confirms a healthy pullback, not a trend reversal ✅.
📰✨ Fundamentals in the Background
Positive news remains supportive:
📦⬆️ ~10% increase in iPhone 17 shipment demand
🤖🤝 Reported AI partnership with Google for iPhone 18
Despite the good news 🌞, price is still respecting technical resistance — suggesting much of this optimism may already be priced in 📌.
🎯📍 Short-Term Expectation
After this pullback completes ⏳, a short-term move toward the 274 area 🎯📈 is possible.
⚠️🔍 Reminder
This is a pullback within the trend, not a bearish trend change 🐂➡️🐂.

APLD: Momentum Confirms Triangle BreakoutAPLD - CURRENT PRICE : 37.68
APLD Breaks Symmetrical Triangle – Momentum Confirms Trend Continuation
Applied Digital Corporation (APLD) continues to trade within a strong long-term uptrend, with price holding well above the rising EMA 200 , signaling sustained institutional support and a structurally bullish market environment.
From a price-structure perspective, APLD has broken out of a bullish symmetrical triangle , supported by clear volume expansion, confirming genuine buying interest rather than a false breakout. This pattern reflects a period of healthy consolidation before trend continuation, with price now attempting to resume its prior upside trajectory.
Momentum further reinforces the bullish setup. The three highlighted green vertical lines mark previous instances where RSI crossed above 70, and in each case, price continued to rise afterward, demonstrating that overbought readings in this stock have historically acted as trend-confirmation signals rather than reversal warnings. RSI has once again moved above 70, aligning with the current breakout and strengthening the case for continued upside.
Based on the technical structure, the first upside target is $47, while the second target at $58 represents the x-to-x measured move of the symmetrical triangle . On the downside, $28 remains the key support and invalidation level. As long as price holds above this level and the EMA 200, the technical bias remains firmly bullish, with pullbacks viewed as opportunities within an ongoing uptrend.
ENTRY PRICE : 35.00 - 37.68
FIRST TARGET : 47.00
SECOND TARGET : 58.00
SUPPORT : 28.00
Notes : On 09 Jan 2026, major Wall Street analysts update their ratings for Applied Digital Corporation (APLD), with price targets ranging from $40 to $58. (Source: moomoo)

ARDX – Double Rising Window Hints Bullish ContinuationARDX – CURRENT PRICE : 6.06
The stock has broken above its long-term downtrend line accompanied by strong volume (look at red arrow). This breakout was confirmed by the formation of a Rising Window (1), signaling the end of the previous bearish phase.
Another Rising Window (2) appeared recently, again on high trading volume, reinforcing bullish sentiment and indicating the likelihood of a continuation in the uptrend. Take note also that the RSI has climbed into bullish territory (above 50), suggesting a shift in momentum towards buyers’ control and further room for upside before reaching overbought conditions.
ENTRY PRICE : 5.80 - 6.10
FIRST TARGET : 7.00
SECOND TARGET : 8.00
SUPPORT : 5.11 (bottom of the Rising Window area)

FTAI – Momentum & Volume Align for Trend ContinuationFTAI – CURRENT PRICE : 196.85
FTAI remains in a strong bullish trend, supported by recurring momentum and volume behavior. The two vertical green lines highlight previous periods where RSI entered extreme bullish territory above 70, and in both instances, price continued to advance rather than form a top. The same momentum condition is now present again, suggesting RSI strength is acting as trend confirmation, not exhaustion.
Look at the volume pointed by red arrow. On 30 July 2025, there was a gap up with high volume, from there the stock continue rises - indicating strong buying interest. Now same scenario happens (30 DECEMBER 2025 candle) - gap up with strong volume (hint a strong bullish momentum). Take note also that there is a rising support line - indicating demand is getting higher. There is possibility that the stock may trend higher in near term.
ENTRY PRICE : 195.00 - 197.00
FIRST TARGET : 216.00
SECOND TARGET : 226.00
SUPPORT : 176.00

Fast Bounce Setup | Price: 536.00 → Target: 562.08 (+5%)Fundamentals 💼
MSCI maintains strong recurring revenue and solid margins. Earnings forecasts show steady growth, supporting a short-term bounce.
Repeated Behaviour 🔍
MSCI often rebounds 5–20% after clean corrections or oversold conditions.
Today’s setup mirrors previous quick-recovery cycles ⚡📈.
Volume & Price Action 📉➡️📈
Selling pressure is fading while accumulation volume is rising.
Price is sitting exactly on a historical rebound zone, where MSCI has shown multiple fast pops.
Entry: 536.00
Target: 562.08
Profit: +5% expected 💰🚀
Disclaimer:
Not financial advice. For educational purposes only.

Fast Bounce Setup | Price: 63.33 → Target: 66.49 (+5%)Fundamentals 📊
HALO continues to show strong revenue and profit forecasts, with steady growth expectations.
The fundamental outlook remains supportive for short-term upside.
Repeated Behavior 🔍
This stock has a repeated pattern of delivering at least a 5% bounce from similar oversold or congested zones.
The current structure matches previous cycles.
Price Action 📉➡️📈
Price action at this level is reacting to a resistance zone, which historically leads to a quick 5% reaction move before continuation or pullback.

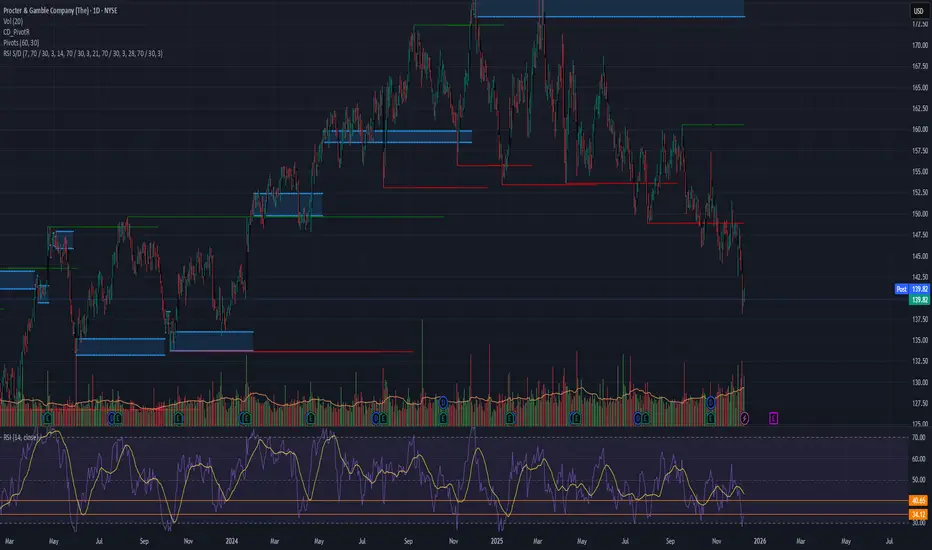
Fast Bounce Setup | Price: 139.78. → Target: 146.76 (+5%) 🌱 New Setup Forming on PG
⚡ Oversold Signal Triggered — Bounce Just Starting
📉 Strong fundamentals + behavioral dip pattern
📈 Watching for the first 3–5% move
#BehaviorBasedTrading 🔥 #LavinSignals 🚀
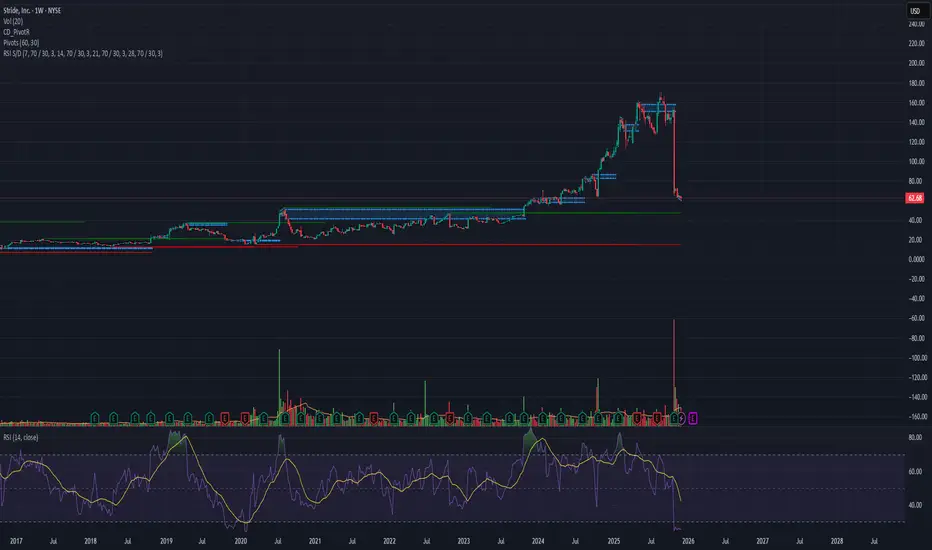
Fast Reversal Setup | Price: 62.68 → Target: 65.81 (+5%)
After the recent lawsuit-related news, LRN dropped sharply from $155 → $62 and is now deep in the oversold area 📉🔥
Volume Signal 📊
This week’s traded volume is higher than anything since its IPO, which often marks a reversal zone.
Repeated Patterns 🔍
Across the daily, weekly, and monthly intervals, the stock is showing its typical reversal pattern, matching previous bounce cycles.
Entry: 62.68
Target: 65.81
Profit: +5% 💰⚡
Fast Bounce Setup | Price: 3.61 → Target: 3.79 (+5%)Fundamentals 📊
STKL shows improving revenue and margin forecasts, indicating gradual recovery.
Even though long-term movement has been unstable, the short-term fundamental outlook supports a bounce.
Repeated Behaviour 🔍
Historically, STKL has shown a clear behavioural pattern:
after deep pullbacks or oversold conditions, it regularly produces 5%–1000% bounces before stabilizing.
Today’s setup matches those previous repeated cycles.
Volume & Price Action 🔥
Recent volume activity suggests seller exhaustion and early accumulation.
Price is sitting exactly in a zone where STKL has shown multiple fast rebounds in the past.
Entry: 3.61
Target: 3.79
Profit: +5% expected 💰⚡

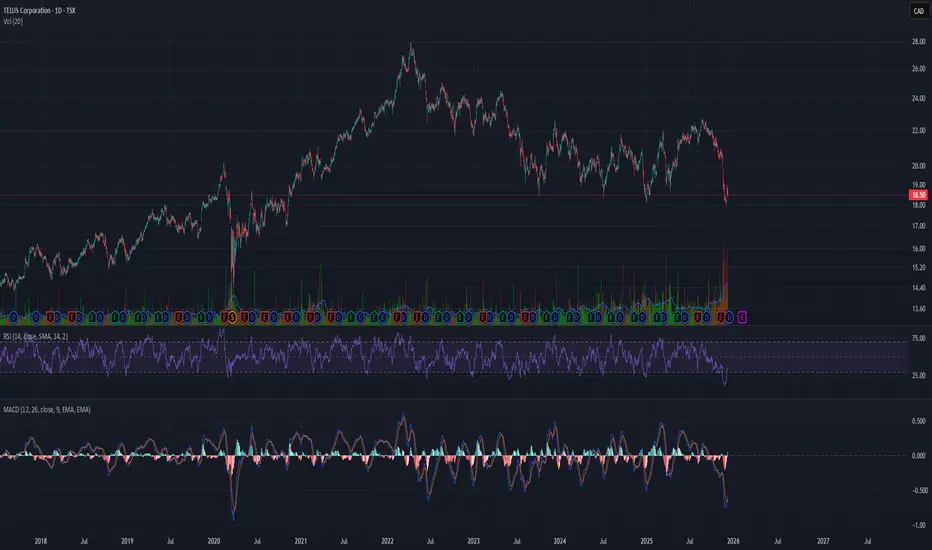
Fast Bounce Setup | Price: 18.53 → Target: 19.46 (+5%)
Fundamentals 📊💼
TELUS shows stable revenue forecasts and long-term growth in telecom and digital services.
Even during pullbacks, fundamentals remain supportive for short, quick moves.
Repeated Behavior 🔁📉➡️📈
Historically, T reacts with 5%–20% quick bounces after deep drops or oversold conditions.
Current pattern is similar to previous reversal cycles.
Volume & Price Action 🔥📊
Volume shows buyer interest, and price is sitting at a classic TELUS bounce zone.
Entry: 18.53 💵
Target: 19.46 🎯
Profit: +5% expected 💰⚡
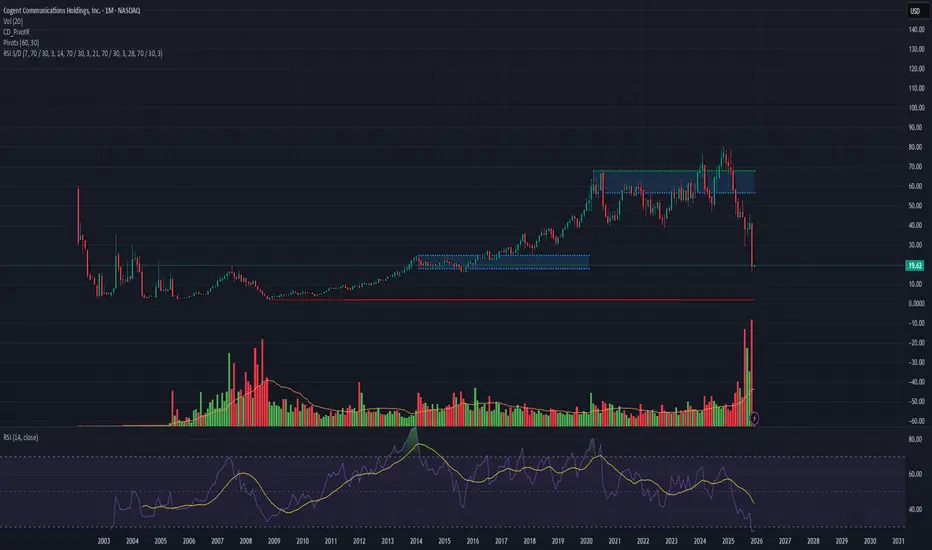
CCOI Fast Bounce Setup | 19.62 → 20.60(+5%)
CCOI just printed the highest monthly volume in its entire history since IPO 🔥
This type of volume spike often signals a short-term reversal or momentum bounce.
RSI Behavior 🔍
Across the daily, weekly, and monthly intervals, RSI has shown a repeated pattern of bouncing 10%–100% after oversold conditions.
Based on this history, a 5% bounce from here is completely reasonable and aligned with previous cycles 🎯📉➡️📈
Fundamentals 📊
Revenue forecasts are improving and gradually compensating for weaker past years.
This supports the upside even during a downtrend.
Risk Note ⚠️
Catching profit in a downtrend is always aggressive.
But the volume structure + RSI behaviour build a strong short-term case.
As always, we only select stocks with predicted revenue growth, that are oversold, and that show a repeated behavioural pattern in similar conditions.
Our strategy is not based on one fixed formula for all stocks.
Each symbol has its own unique pattern that repeats historically, and we focus only on that repeated behaviour. This is why every setup is different — it must match the stock’s own history. 🔍📈
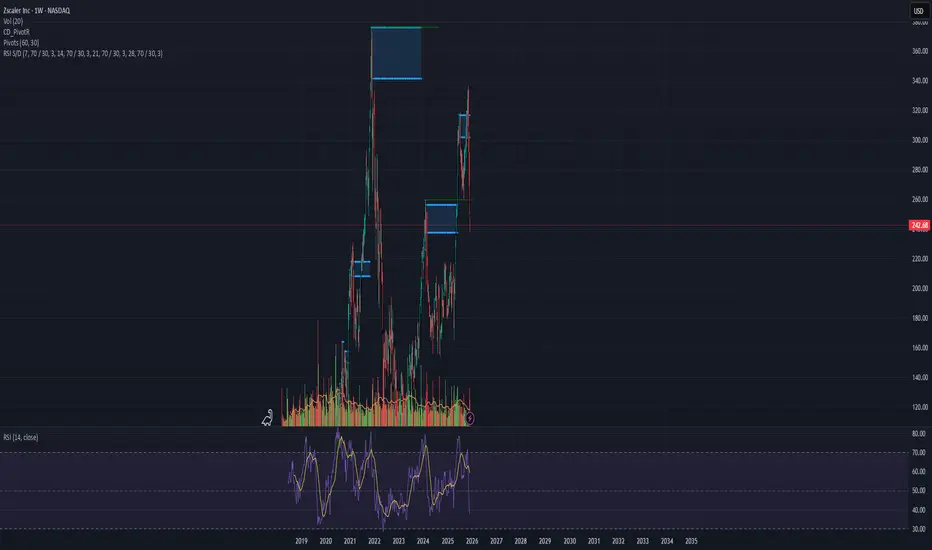
Fast Bounce Setup | Price: 242.68 → Target: 254.81 (+5%)Fundamentals 📊💼
Strong revenue growth from rising demand in cloud security and zero-trust solutions.
Forecasts support short-term upside momentum.
Repeated Behavior 🔁📉➡️📈
ZS often makes 5%–30% quick bounces after oversold drops.
The current pattern strongly matches earlier reversal cycles.
Volume & Price Action 🔥📊
Volume shows buyer accumulation, and price is sitting at a familiar bounce zone where ZS reacts quickly.
Entry: 242.68 💵
Target: 254.81 🎯
Profit: +5% expected 💰⚡
Fast Bounce Setup | Price: 242 → Target: 254.10 (+5%)Fast Bounce Setup | Price: 242 → Target: 254.10 (+5%) 📈⚡
Fundamentals 📊
VEEV shows steady revenue and profit growth, supported by strong demand for its cloud solutions in the life sciences sector.
Repeated Behavior 🔍
Historically, VEEV produces 5%–25% quick bounces after oversold or sharp pullback zones.
Current price action matches those previous reversal patterns.
Volume & Price Action 🔥
Volume shows accumulation and the price is sitting on a familiar bounce level.
Entry: 242
Target: 254.10
Profit: +5% expected 💰⚡

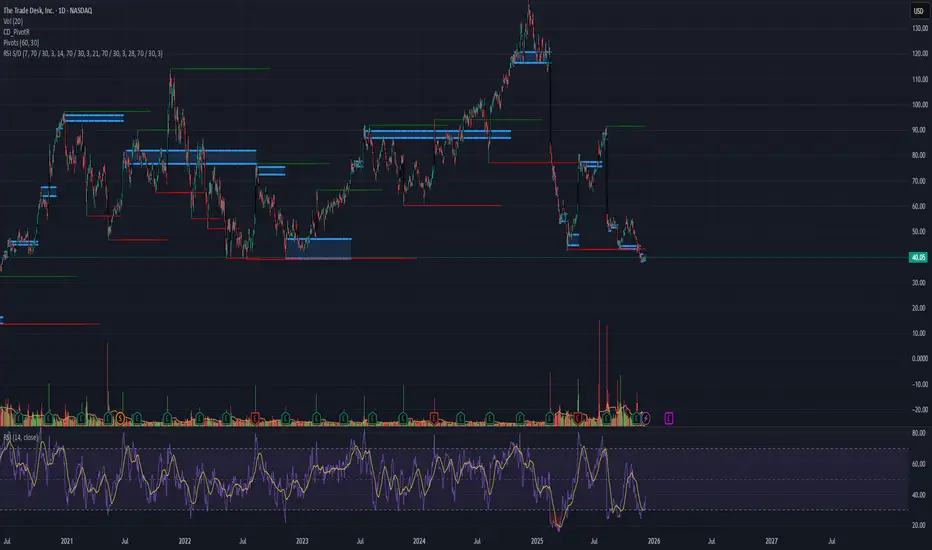
Fast Bounce Setup | Price: 40.05 → Target: 42.05 (+5%)Fast Bounce Setup | Price: 40.05 → Target: 42.05 (+5%) 📈⚡
Fundamentals 📊
TTD maintains strong long-term revenue growth, driven by rising digital ad spending and increasing adoption of programmatic advertising.
Profit forecasts also show healthy growth, strengthening the short-term upside potential.
Repeated Behavior 🔍
TTD has a well-defined behavioral pattern historically:
after sharp selloffs or oversold conditions, the stock often delivers 5%–100% quick bounces before consolidating.
Today’s setup fits the same repeated cycle seen in prior reversals.
Volume & Price Action 🔥
Recent volume indicates buyer accumulation after a wave of selling pressure.
Price is currently sitting at a familiar zone where TTD has shown fast short-term rebounds multiple times.
Entry: 40.05
Target: 42.05
Profit: +5% expected 💰⚡
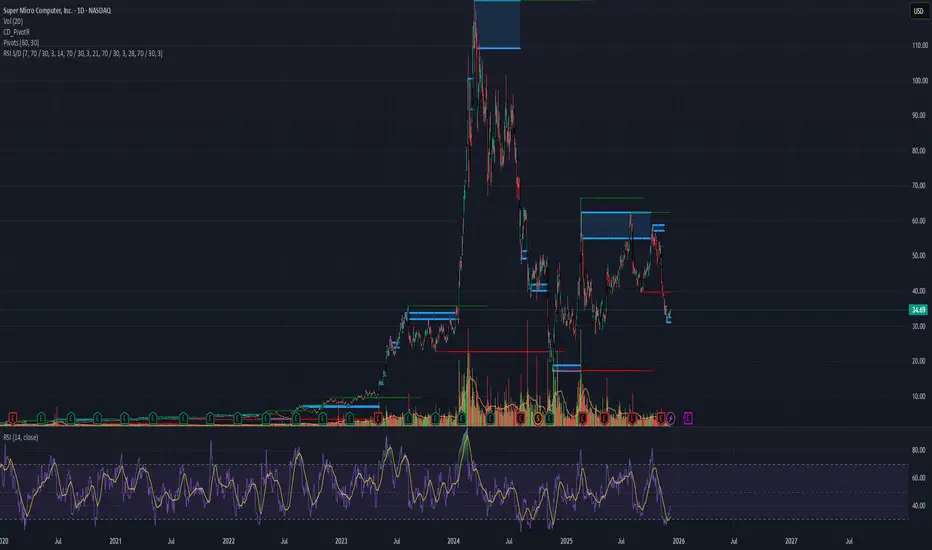
Fast Bounce Setup | Price: 34.69 → Target: 36.42 (+5%)Fundamentals 📊
SMCI continues to show strong revenue and profit forecasts, supported by growing demand in AI servers and high-performance computing hardware.
The long-term outlook is strong, which also supports short-term bounce setups.
Repeated Behavior 🔍
Historically, SMCI has shown a clear behavioral pattern: after sharp pullbacks or oversold phases, it typically produces 5%–50% bounces before stabilizing.
The current structure matches those previous behavior cycles.
Price Action 🔥
Recent volume spikes and the pullback zone align with previous SMCI reversal phases.
Price is reacting at a familiar technical level where the stock has shown fast rebounds.
Entry: 34.69
Target: 36.42
Profit: +5% 💰⚡
This setup is based entirely on the repeated behavioral pattern of SMCI itself.
Each stock has its own cycle — we do not use one fixed formula.
All signals come from pure behavior analysis.
#BehaviorBasedTrading 🔍📈
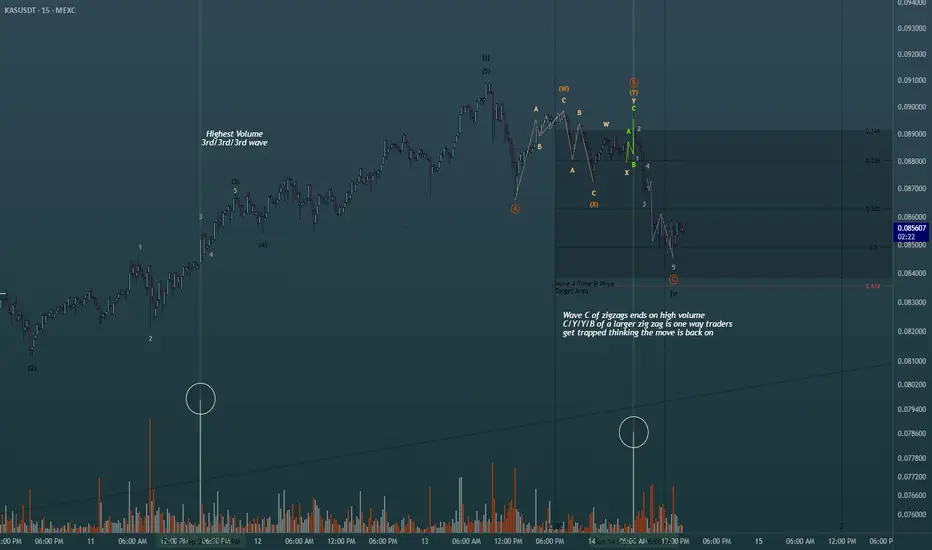
Using simple volume for added confluence in Elliott Wave Theory!Shown on the chart is 2 of the ways you can use the highest volume spikes on the chart to find out where you are in the wave count. Easiest way is to find the highest volume with the steepest slope of trend to label as your third wave. Same concept whether its bearish bars printing or bullish bars. The highest volume shown is actually part of the retracement, albeit in one of the actionary waves (moving with trend), alot of buying happened at the termination of the wave C of the zig zag shown in green. Perfect scenario to rake in buy orders from retail then dump on them to finish out the WXY pattern. This is just 2 of the many scenarios in which you can find help from the volume oscillator to give you a directional bias in Elliott Waves. Happy Trading
“BNBUSD Educational Breakdown – Support Rejection “BNBUSD Educational Breakdown – Support Rejection with $846 Target in Sight”
Market Structure Overview:
BNBUSD is exhibiting a bullish market structure after forming a textbook higher low at the major demand zone near $740–$750. This zone has been historically significant, offering strong rejections and triggering aggressive bullish rallies.
A new bullish wave appears to be forming after price respected the ascending trendline and reclaimed the supertrend level, now acting as dynamic support around $782.2.
⸻
🔧 Technical Confluences:
• Support Zone: Highlighted between $738–$750, serving as a demand base. Recent price rejection here confirms buyers’ dominance.
• Trendline Support: Price has respected an ascending trendline, signaling short-term trend continuation.
• Supertrend Confirmation: Trend flip has occurred—price is now trading above the Supertrend line, indicating a fresh bullish momentum phase.
• Break of Structure (BoS): Minor resistance around $784–$790 was breached, suggesting bullish continuation.
⸻
🎯 Target Projection:
Using recent swing highs and market symmetry, the next logical resistance lies at $846.9, aligning with the previous supply zone. This target also fits within the measured move from the support base to previous highs.
⸻
📈 Trade Plan (Educational Only):
• Long Bias Zone: Between $770–$780
• Invalidation Level: Below $738 (loss of support structure)
• Target: $846.9
• Risk-Reward: Roughly 1:2.5 – favorable for swing traders
⸻
📚 Educational Note:
This chart is an excellent example of:
• Structure trading (support/resistance)
• Trend confirmation using a dynamic indicator (Supertrend)
• Risk-managed entries with clearly defined stop-loss and take-profit zones.

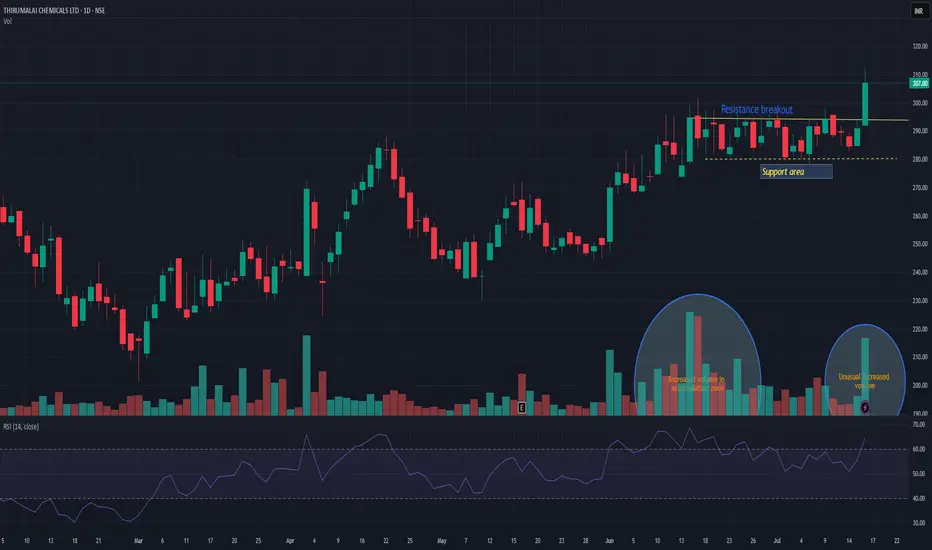
TIRUMALCHMTIRUMALCHM has given resistance breakout with decent volume. Another good thing is unusual volume increased in accumulation zone. Support can be seen near 280 levels. There is high probability that this time it may push the stock in to trend change and may take momentum to the next level. Keep it on radar.
NQ Power Range Report with FIB Ext - 12/20/2024 SessionCME_MINI:NQH2025
- PR High: 21429.25
- PR Low: 21363.00
- NZ Spread: 148.25
Key scheduled economic events:
08:30 | Core PCE Price Index (YoY|MoM)
Value decline continues below daily Keltner avg cloud
- QQQ gap filled
- Maintaining vols since FOMC triggered selling
- Next key pivot, 20920 zone from Nov 27
Session Open Stats (As of 12:40 AM 12/20)
- Weekend Gap: N/A
- Gap 10/30/23 +0.47% (open < 14272)
- Session Open ATR: 345.51
- Volume: 51K
- Open Int: 237K
- Trend Grade: Bull
- From BA ATH: -5.2% (Rounded)
Key Levels (Rounded - Think of these as ranges)
- Long: 22667
- Mid: 21525
- Short: 19814
Keep in mind this is not speculation or a prediction. Only a report of the Power Range with Fib extensions for target hunting. Do your DD! You determine your risk tolerance. You are fully capable of making your own decisions.
BA: Back Adjusted
BuZ/BeZ: Bull Zone / Bear Zone
NZ: Neutral Zone

Analysis of Moving average stock (25/Nov/2024) Analysis of Moving average stock (25/Nov/2024)
follow for more updates and information

NQ Power Range Report with FIB Ext - 11/6/2024 SessionCME_MINI:NQZ2024
- PR High: 20364.75
- PR Low: 20335.75
- NZ Spread: 65.0
Key scheduled economic events
10:30 | Crude Oil Inventories
13:00 | 30-Year Bond Auction
High vol session open, 317 point (~1.43%) range
- AMP temp margin increase remains in place for expected volatility
- Strong auction lift back towards 20800 pivot
Session Open Stats (As of 12:15 AM 11/6)
- Weekend Gap: -0.13 (filled)
- Gap 10/30/23 +0.47% (open < 14272)
- Session Open ATR: 307.30
- Volume: 81K
- Open Int: 251K
- Trend Grade: Bull
- From BA ATH: -2.9% (Rounded)
Key Levels (Rounded - Think of these as ranges)
- Long: 20954
- Mid: 19814
- Short: 17533
Keep in mind this is not speculation or a prediction. Only a report of the Power Range with Fib extensions for target hunting. Do your DD! You determine your risk tolerance. You are fully capable of making your own decisions.
BA: Back Adjusted
BuZ/BeZ: Bull Zone / Bear Zone
NZ: Neutral Zone
