HIMS Nice Double Bottom, Looks To Be Moving UpwardWe have a nice double bottom formation and we are oversold on the weekly timeframe. This could take a while to play out but I have mapped out a target above. This could also be a nice long term hold. Not financial advice.
Hims & Hers Health (HIMS) presents a compelling bullish case as a high-growth telehealth disruptor expanding beyond GLP-1 weight loss into a broader "hormonal empire" with durable moats in personalized medicine.
Explosive Revenue Trajectory
HIMS has delivered triple-digit growth in recent years, with analysts projecting 62% revenue jump to $2.4B in 2025 and 18% to $2.8B in 2026, fueled by subscriber additions surpassing 2M and average revenue per user climbing through personalized offerings like Hers for women and UK/Canada expansions.
The core model—direct-to-consumer subscriptions for hair loss, ED, skincare, and now weight management—benefits from network effects and sticky retention, with margins expanding as fixed costs dilute over scale.
GLP-1 Tailwinds Persist Despite Noise
While Novo Nordisk tensions create near-term FUD, HIMS' compounded semaglutide volumes remain robust, and diversification into oral non-GLP meds, labs testing (heart, hormones), and acquisitions like YourBio positions it for multi-year category leadership amid obesity treatment demand.
Even conservative forecasts see EPS rising 27% to $0.60 in 2026, trading at ~58x forward earnings that could compress to 40x on execution, implying 50%+ upside to $45-50 consensus targets.
Asymmetric Setup at Depressed Levels
Shares have pulled back 30-40% from peaks amid insider sales and valuation debates, yet trade at a discount to intrinsic value (~$44 fair value per models) with Strong Buy ratings from Barclays ($48 PT) and undervaluation narratives gaining traction.
Long-term, HIMS builds defensible platforms in telehealth adjacencies (mental health, hormones), offering 3-5x potential if it captures 1-2% of its addressable market, fitting aggressive traders like you alongside MSTR/BYND positions.
HIMS

$HIMS - RSI+MACD Divergences for Bullish PlaysI think that NYSE:HIMS has an upside potential considering there are clear positive divergences in RSI and MACD. These have also been highlighted at various instances in the past where the price rocketed upwards after giving divergences in RSI and MACD; the price, at that point, either consolidated or gave a rough double bottom. Furthermore, the shrinking volumes add some fuel to fire.
I think that the upside potential is up to $47 which I have calculated by using an AVWAP (anchored at its all-time high). This also sort of makes this a mean-reversion trade.
So, fingers crossed! Hope to see it up now; otherwise, it'll probably fall to $25 which happens to be an extreme low given after making the all-time high.

Telehealth Boom and Hims & Hers Growth StrategyWhile the transformative potential of artificial intelligence dominates contemporary market narratives, it is crucial to recognize that other generational megatrends continue to offer substantial growth opportunities. Among these, the telehealth revolution stands out, poised to fundamentally reshape the delivery of healthcare. Analysts at J.P. Morgan project the burgeoning "Internet of Medical Things" to achieve a remarkable compound annual growth rate of 24% through 2030. This acceleration is driven by a decisive and lasting shift toward virtual care for a wide spectrum of needs, from psychiatric consultations to routine medical appointments.
In this dynamic and expanding landscape, Hims & Hers Health has carved out a distinctive and leadership position. The company’s success is largely attributable to its innovative, direct-to-consumer approach and its resonant, contemporary branding that effectively engages Gen Z and millennial demographics. Moving beyond the traditional transactional model of healthcare, Hims & Hers has masterfully curated an integrated experience. It focuses intentionally on personal and often stigmatized areas—such as sexual health, hair loss, weight management, and mental wellness—where patients may seek discretion and avoid the potential discomfort of in-person doctor visits. This strategy is complemented by product innovations like offering established medications in discreet, consumer-friendly formats (e.g., chewable mints for generic erectile dysfunction treatment), further lowering barriers to care.
The company’s robust growth metrics underscore the powerful demand for its model. In the third quarter, revenue surged an impressive 49% year-over-year to $600 million, fueled by a subscriber base that expanded approximately 21% to 2.5 million. A key to its model is the concept of a comprehensive healthcare ecosystem; users increasingly rely on the Hims & Hers platform as a one-stop shop for multiple, personalized treatment plans. A single patient might seamlessly manage sexual health, mental wellness, and weight loss through the integrated platform, yielding significant savings in both time and cost.
However, this rapid top-line expansion has not yet fully translated into substantial bottom-line profitability. Third-quarter operating income, for instance, declined by about half to $11.8 million—a figure that appears modest relative to the $600 million revenue haul. This dynamic should not necessarily alarm long-term investors. Management is deliberately prioritizing aggressive investment, channeling hundreds of millions into sales and marketing to solidify brand dominance and capture critical market share. This strategy reflects a calculated trade-off, where forgoing short-term profits is viewed as an investment in securing a commanding, durable position within the telehealth megatrend. The company has maintained its full-year revenue guidance of $2.335-$2.355 billion, signaling continued confidence in its growth trajectory.
Looking ahead, Hims & Hers is strategically evolving from a core telehealth provider into a broader digital health platform. The company is leveraging its foundation to expand into adjacent services and specialties, aiming to deepen user engagement and increase lifetime value. Significant strategic initiatives, including international expansion and an $870 million convertible note offering, are designed to fund advancements in artificial intelligence, diagnostics integration, and entry into new care categories. Furthermore, the recent announcement of a $250 million share repurchase program demonstrates management's confidence in the company’s long-term value creation and a disciplined approach to capital allocation.
Of course, Hims & Hers operates in a competitive and complex environment. The digital health sector faces ongoing regulatory scrutiny, and the company’s margin profile can experience volatility due to shifts in product mix and service costs. For investors, key metrics to monitor in upcoming earnings reports will include the sustainability of subscriber growth, trends in average revenue per user, and the path toward operating leverage. From a technical perspective, the stock has demonstrated strong performance, gaining 44.9% year-to-date in 2025, with a major level of chart support identified around the $25 price point. This combination of explosive growth, strategic reinvestment, and platform expansion positions Hims & Hers as a potentially transformative player at the intersection of healthcare, technology, and consumer experience.

$HIMS - Hims & Hers Now Serving Customers in Canada. PT - $45Hims & Hers Health, Inc. (NYSE: HIMS) has executed a significant strategic expansion by formally entering the Canadian market, marking a pivotal step in its mission to democratize personalized healthcare on a global scale. This move was catalyzed by the recent acquisition of Livewell, an established Canadian digital health platform specializing in weight management. By integrating this local foothold with its proven, scalable technology and operational model, Hims & Hers is poised to introduce a new era of accessible, affordable, and comprehensive digital health care to millions of Canadians.
The expansion directly addresses a critical and underserved public health need in Canada. With approximately two-thirds of Canadian adults classified as overweight or living with obesity, effective treatment options have remained inaccessible for many. Hims & Hers aims to bridge this gap by launching its comprehensive weight loss program in Canada next year. The timing is strategically aligned with a major industry catalyst: the anticipated first availability of generic semaglutide anywhere in the world. By combining its innovative digital platform with upcoming, more affordable pharmaceutical options, Hims & Hers is uniquely positioned to deliver a high-impact, cost-effective solution at scale.
To ensure cultural relevance and medical excellence, the company is establishing a dedicated, country-first leadership team in Canada. This localized approach underscores a deep commitment to understanding the specific nuances of the Canadian healthcare landscape. Austin Kouri will lead the market as General Manager, supported by the newly appointed Chief Medical Officer in Canada, Dr. Sandy Van, a distinguished obesity medicine physician. Furthermore, Livewell co-founders Antoine Arbour and Patrick Duffy are joining the Canadian leadership team, ensuring a seamless integration of local expertise and trusted patient relationships.
"Our expansion into Canada is a direct response to critical public health needs, particularly around the obesity crisis," stated Andrew Dudum, Co-founder and CEO of Hims & Hers. He framed the move as a "fundamental next step" in the company's core promise and a blueprint for future international growth. The leadership team uniformly emphasized that this investment is about complementing the existing health system to provide specialized, timely, and affordable care for prevalent, persistent conditions.
From a technical analysis and investment perspective, this strategic expansion occurs as the stock navigates key price levels that define its current risk-reward structure.
Primary Support & Take Profit: The share price has established a notable primary support zone near $25.00. This level is considered a foundational floor for the stock's current trend. On the upside, the next major resistance and a logical take-profit target is identified at $45.00. A successful reach toward this target would likely require sustained execution on the Canadian growth strategy and positive market reception to upcoming milestones.
Critical Intermediate Support: A crucial intermediate support level sits at $33.00. This price point acts as a key defensive line for the stock's near-term bullish structure. A decisive and sustained break below $33.00 on a weekly closing basis would signal weakening momentum and would necessitate a more cautious stance.
Risk Management Scenario: In such a scenario where the $33.00 support fails, the focus would sharply shift to the stronger primary support at $25.00. A breach of this main support would represent a significant technical breakdown, invalidating the current bullish premise and likely triggering a deeper correction. Therefore, while the $25.00 level is the main support, a break below $33.00 serves as an critical early warning to reassess the investment thesis.
In summary, Hims & Hers' Canadian foray is a bold growth initiative that merges strategic acquisition, savvy market timing, and localized execution. It presents a tangible opportunity to capture a substantial new market and drive long-term shareholder value. For investors, monitoring the stock's interaction with the defined technical levels—particularly the $33.00 support and the $45.00 profit target—will be essential in gauging market confidence in this expansion plan as it unfolds. The company has indicated this is just the beginning, with plans to expand into more healthcare specialties in Canada as demand grows.

$HIMS BEARISH SENTIMENT If we can look into actions on volume and price. Institutional traders are luring retails to fomo with this surges which are basically traps to rekt em. Smart money are spoofing volume,$50 is a area that has acted as a supply zone multiple times not until it got broken downwards and the overall sentiment on NYSE:HIMS is indicating more bearish momentum, for price to continue it’s downside movement it has to test that area which is also in between the 50% and 61.8 % retracement level on the fib. Initially we saw a bearish divergence but with lots of retail fomo on longs were expected to see another bearish divergence whereby price will be low but volume is showing strength.

Worthy Stocks Above 100M TTM RevenueTo follow up from my previous post, here's a more comprehensive list of stocks worth your attention with at least 100M revenue in the last year.
These stocks are picked for being money printers that are rewarded for R&D and buybacks.
I hope this is helpful and good luck!

Stocks Worth Your AttentionI wanted to share a list of high growth, high margin stocks that are worth looking into. This is where I pull a lot of my core positions from.
HIMS is noteworthy as it's also one of the most heavily shorted stocks at the moment and THE best performer on my ranking.
These stocks are essentially cash cows dominating their space. Please do look into each one carefully. This list is algo generated and not combed through by me yet. So make sure the stock's earnings and trend are to your liking.
Enjoy and good luck!

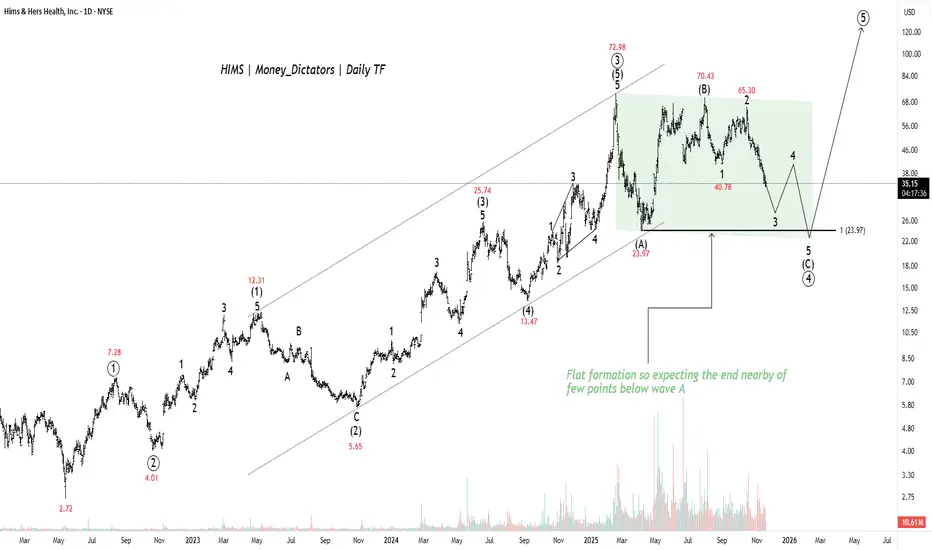
HIMS - Bulls Finding Demand to climb 120+ LevelsHIMS strongly suggests the stock is currently in the final phase of a large decline before initiating a major upward move. According to Elliott Wave principles, the stock is completing a correction labeled as wave (4), which has formed a "Flat" pattern.
The final downward leg of this pattern, wave (C), is projected to conclude around the prior wave (A) low of $23.97 , or potentially slightly below this level. Once the price reaches and holds support near the $24 area, the analysis anticipates the start of a new, highly significant bullish impulse wave (5), which is expected to drive the price to 57, 95, and 120+ levels.
Stay Tuned!
@Money_Dictators
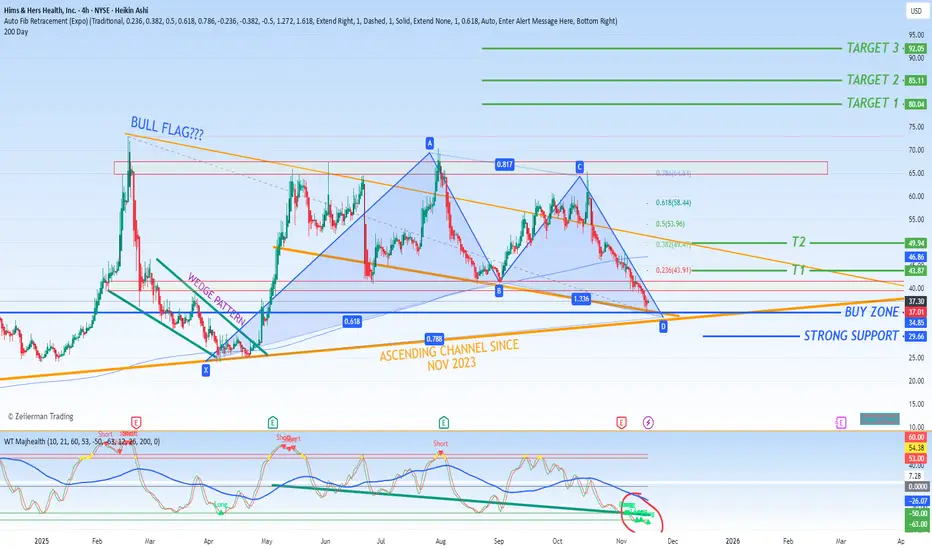
Technical Analysis Update: $HIMS Showing Signs of a Major Trend.The technical structure for NYSE:HIMS is aligning to form a compelling bullish narrative, suggesting the prolonged downtrend may be concluding and a significant new upward cycle could be beginning. The convergence of a key reversal level, a classic continuation pattern, and strong momentum indicators warrants close attention.
1. The Macro View: A Potential Bottom Formation
Your previous identification of the $35.00 level as a potential bottom appears increasingly prescient. This price level has acted as a formidable support floor, repelling multiple bearish attempts to drive the price lower. The ability to hold this level is the first and most critical step in establishing a new bullish trend. It indicates that selling pressure has been exhausted at this valuation and buyers are consistently stepping in, building a solid foundation for a potential recovery.
2. The Pattern: A Promising Bull Flag Consolidation
Currently, the price action is shaping into what technical analysts recognize as a Bull Flag pattern. This pattern typically forms after a sharp upward move (the flagpole) and is characterized by a slight, downward-sloping consolidation channel (the flag).
Interpretation: This pattern is not a sign of weakness, but rather a period of healthy consolidation. It indicates that the market is pausing to digest the initial gains from the bounce off the $35.00 low, shaking out weak hands, and preparing for the next leg up. A decisive breakout above the upper trendline of this flag would be the confirmation that the next phase of the bull run has commenced.
3. Momentum Confirmation: Indicator Alignment
Adding significant weight to the bullish structure is the signal from your momentum indicators. The MACD (Moving Average Convergence Divergence) is showing a very strong buy signal. This typically manifests as a bullish crossover and a rising histogram, indicating that underlying short-term momentum is accelerating and supporting the thesis of a trend change. This alignment between price pattern and momentum oscillator significantly strengthens the overall bullish conviction.
4. Strategic Trade Setup: Zones for Entry, Exit, and Risk
For Swing Traders:
Profit-Taking Targets: Based on Fibonacci retracement levels of the prior major downtrend, logical areas to secure profits are:
Primary Target: $43.91 (0.236 Fib). This is the initial resistance level and a logical zone for the first wave of profit-taking.
Secondary Target: $49.47 (0.382 Fib). A break above the first target opens the path to this more significant resistance level, which often acts as a key test in a new bull trend.
Risk Management & Entry Strategy:
Buy Zone & Primary Support: The current levels within the bull flag pattern, and specifically the $35.00 zone, represent the primary buy zone and critical support. This is the level that must hold to keep the bullish thesis intact.
Secondary Support: As you astutely noted, a valid second support level exists slightly below the flag. A pullback to this level that finds a bounce would present a high-probability secondary entry opportunity, offering a better risk-reward profile. A breakdown through this secondary support, however, would force a re-evaluation of the short-term bullish outlook.
Conclusion: A Call for Patience and Discipline
The setup for NYSE:HIMS is indeed promising. The potential double-bottom at $35.00, the developing bull flag, and the strong MACD buy signal collectively paint a compelling picture for a sustained bull run.
The key now, as you rightly stated, is patience. We must allow the market to confirm this setup by providing a decisive breakout above the flag's resistance. Until then, the strategy is to respect the defined support levels, manage risk accordingly, and be prepared to act when the market gives its final confirmation.
$HIMS growth is moderating starting 2025- NYSE:HIMS had explosive growth in 2025 but it will grow only 20% yoy going forward.
- Their eps really sucks and will moderate as well. There is no point in giving a multiple more than 30.
Fair value :
year : 2025 , eps: 0.48 , fair value: 30 x 0.48 =~ $15
year : 2027 , eps: 0.68 , fair value: 30 x 0.68 =~ $21
year : 2028 , eps: 0.88 , fair value: 30 x 0.88 =~ $27

WHATS NEXT FOR $HIMS?Technical & Fundamental Outlook for NYSE:HIMS : Positioning for a Sustained Bull Run
A comprehensive review of the charts for NYSE:HIMS reveals a compelling narrative of building bullish momentum, suggesting the stock may be on the cusp of its most significant upward move to date. The technical structure, combined with a pivotal upcoming catalyst, paints a highly optimistic picture for both the near and long term.
The Macro View: A Foundation of Strong Growth
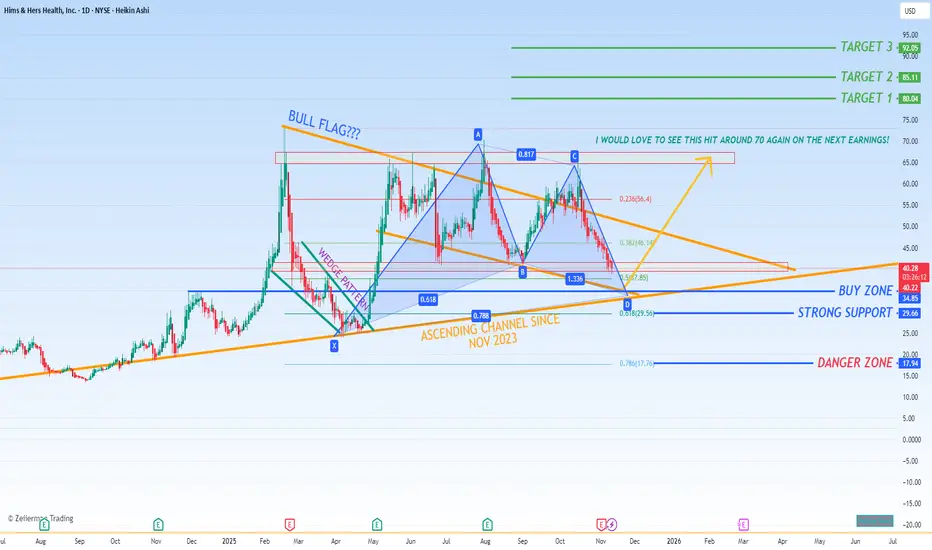
Since its notable low in November 2023, NYSE:HIMS has been trading within a well-defined Ascending Channel. This pattern is characterized by consistently higher lows and higher highs, indicating a healthy and steady uptrend that has provided a reliable foundation for the stock's price action over the past year. This establishes a clear and positive macro trajectory, confirming that the bulls have been in control for an extended period.
Consolidation Phase: The Bullish Wedge and Impending Breakout
Within this broader ascending channel, the price action over the last several months has formed a distinct Bullish Wedge (or Pennant) pattern. This tightening consolidation typically occurs after a strong upward move and represents a period of equilibrium where the market catches its breath. The coiling nature of this wedge suggests that energy is being built up for a powerful directional move. The timing of this pattern is critical, as it is converging perfectly with the company's upcoming earnings release on Monday, February 24, 2025. This event is widely anticipated to be the fundamental catalyst that triggers the anticipated technical breakout from this wedge, potentially initiating the next major leg up.
Harmonic Patterns and Measured Moves: The XABCD Bullish Scenario
Adding further credence to the bullish thesis is the emergence of a classic XABCD harmonic pattern (often manifesting as a "Bat" or "Gartley" pattern) on the charts. These patterns are revered by technical analysts for their precision in identifying potential reversal zones with high probability. The completion of this pattern suggests that the recent consolidation is not a sign of weakness but rather a strategic pause before another significant bull run, aligning perfectly with the wedge analysis.
The Immediate Setup: A Forming Bull Flag
On a shorter time frame, we can observe what appears to be the early stages of a Bull Flag pattern forming. While this pattern is not yet fully confirmed and requires a decisive breakout above the flag's upper boundary on strong volume, it is a highly encouraging structure to monitor. A confirmed bull flag breakout often projects a move equal to the length of the prior "flagpole," which in this case would imply a substantial upward surge, providing a powerful near-term signal.
Critical Price Levels: Support and Resistance
Current Support & Buy Zone: The most immediate and robust support rests at the $37.85 level, which aligns with the 0.5 Fibonacci retracement level of a key prior move. This creates a strong foundation. Our primary "Buy Zone" is strategically defined around the $40.00 psychological level, offering a high-risk-to-reward entry point.
Secondary Support: Should a broader market pullback exert temporary pressure, the next significant support floor is situated around the $30.00 mark. This represents a deeper, yet still strong, area of historical buying interest.
Danger Zone: A breach below $30.00 would lead us to our "Danger Zone" near $20.00. However, given the overwhelming strength of the ascending channel and the confluence of bullish patterns, the probability of a decline to this level in the foreseeable future is considered exceptionally low.
Price Targets and Forward Projections
Our immediate focus is on the resistance at the all-time high of $72.98. A confirmed breakout above this level, especially on the heels of a strong earnings report, would open the path for a powerful advance.
Post-Earnings Target (Near-Term): Following the February 24th earnings, we anticipate a strong move that could propel NYSE:HIMS toward the $70.00 range as an initial target.
Primary Bull Run Target (Medium-Term): The main objective, based on the measured moves of the ascending channel and the harmonic pattern projections, is a price target band between $92.00 and $98.00. This range represents the next major resistance area and would signify a period of clear market domination for the company.
In summary, NYSE:HIMS is exhibiting a rare and powerful confluence of multiple bullish technical indicators, all aligning with a high-impact fundamental catalyst. The strategic setup suggests that any pullback towards the $40.00 support zone presents a favorable opportunity to position for a significant upward revaluation, with a clear trajectory first towards its previous highs and ultimately toward the primary target zone approaching $100.
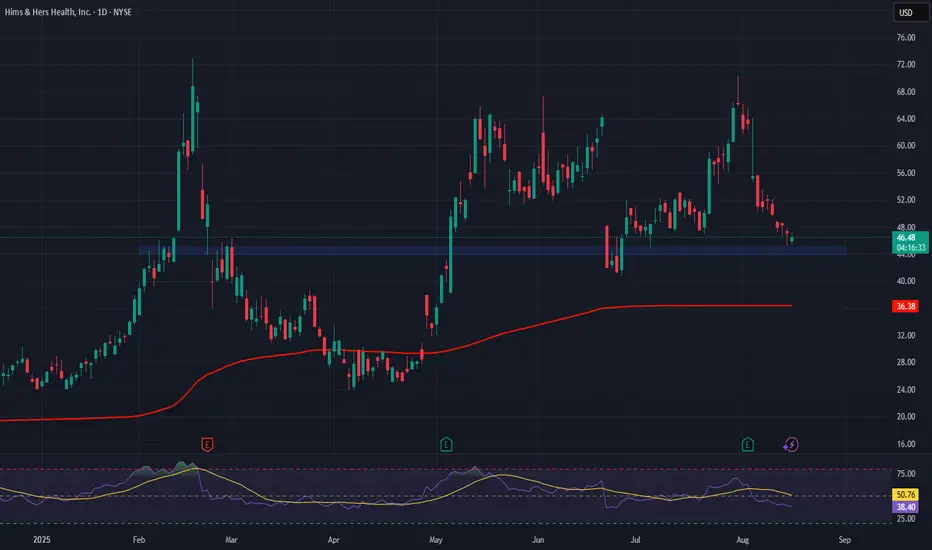
$HIMS - Heading to support! The positive reaction in after-hours trading was driven by HIMS's impressive earnings, with revenues nearing the $600 million mark. From a technical analysis perspective, all eyes are now on the 200-day Moving Average. The critical test will be whether the stock can successfully break through and reclaim this level from below. If it succeeds, the price would re-enter its former trading range, creating a promising setup for a future upward breakout.
On the downside, a failure to overcome the 200-day MA could lead to a pullback. The most likely target in that scenario would be the $37.45 level, which aligns with the 0.618 Fibonacci retracement and has proven to be a reliable support zone in the past.
My investment stance remains firmly long-term. The company's solid fundamentals, underscored by newly announced growth initiatives and a strategic global expansion into markets like Europe, Brazil, and Australia, provide strong conviction to hold through near-term price fluctuations. KalaGhazii
Support and Resistance -
Support - $37.50 - $40.00
Resistance - $60 - $65

HIMS to $76HIMS is incredibly profitable and also a highly shorted stock (33%). It might tap support here, but if not just below the trend line seems like a nice entry.
Good luck!

Put sale on HIMS over earningsI like HIMS and OSCR A LOT in this market and environment right now.
:)
So, getting HIMS at $38 seems like a gift. JUST closed .80 gain on a put sale. So cost basis would be a tad lower than $37 if I get put shares...

HIMS put saleTHIS HAS BEEN such a fun stock to trade. BIG DOWN DAY. This put sale is before earnings. AMAZING premiums. Puts the cost basis at $44.
GORGEOUS

HIMS THROUGH LABOR DAYThis is my speculative technical analysis of what I believe could unravel with $HIMS.
$45.00 has been crossed twice, and I believe this is where the line on the sand is drawn. A Strong close above this mark and we could see $47.40, $48.94, and then a gap fill to $50.00 which is a big psychological level.
An area where I would expect some price consolidation before picking direction once again.

$HIMS growth slowdown ahead- NYSE:HIMS is quite overvalued. There's no moat to a business model.
- They got a good branding that's all. There are 10-15 other startups selling the same things under different umbrella.
- They even stole NYSE:NVO flagship weight loss drugs. These cheap alternatives will risk lives of people and will open plethora of lawsuits.
- Growth is slowing down to low 20s which calls for correction in the multiple.
- Anyone paying more than 20x will likely suffer from massive losses within an year timeframe.
- Fundamentally,
Year | 2025 | 2026 | 2027 | 2028
EPS | 0.57 | 0.79 | 1.05 | 1.40
EPS% | 5.76% | 38.31% | 32.59% | 33.25%
Giving benefit of doubt and being generous, 30x multiple as a base case. Fair stock value:
Year | 2025 | 2026 | 2027 | 2028
Price | $17 | $23 | $31 | $42
- We should visit the $23-26 range somewhere in 2026
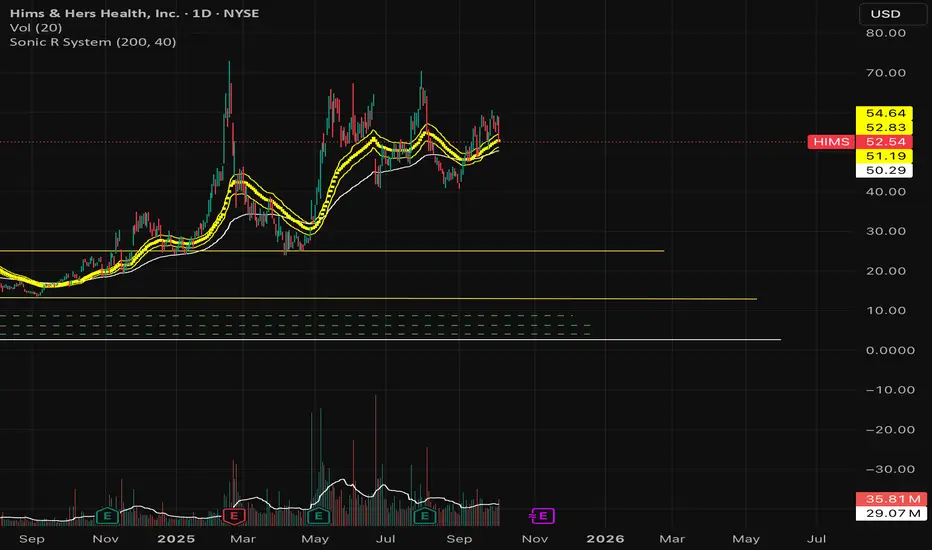
HIMS 1D: time to heal the trend?On the daily chart, Hims & Hers Health is testing a descending trendline, while MA50 and MA200 provide strong support from below. Buyers are clearly in control. The highlighted buy zone sits around $54.40, but the real signal comes only after a confirmed breakout and retest of the trendline.
Technically , the targets are set: first stop at $73.23, then $86.64, and if momentum holds, the extension points to $103.69. That would mark a strong continuation of the bullish move.
From the fundamental side, the company keeps expanding its product portfolio and growing its presence in telehealth — a sector known for resilience even during market turbulence.
The tactical play: wait for the breakout and retest, then ride the bullish wave.
Just don’t confuse HIMS with a real doctor - if you ask for a prescription for profits, all you’ll get is a smile.

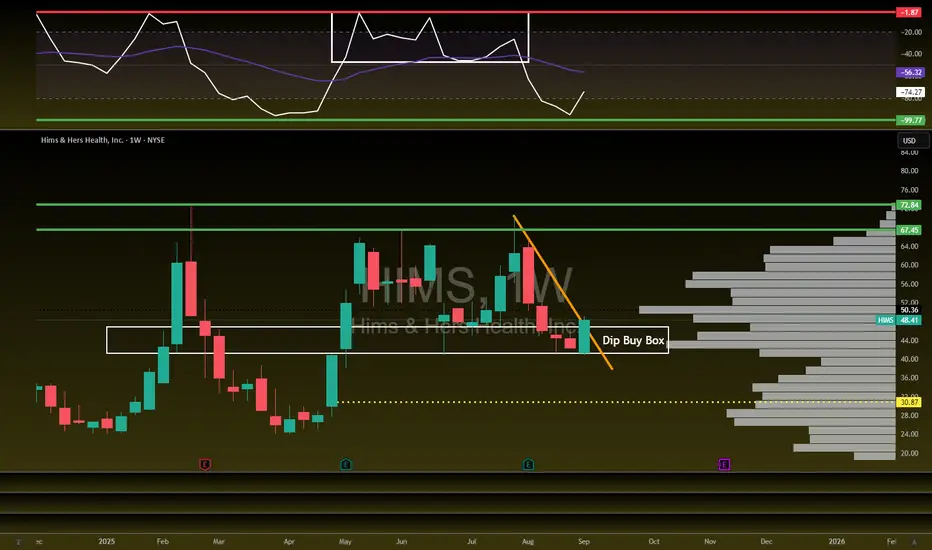
HIMS Setting up AGAIN...NYSE:HIMS - Dip Buy Box Wins Again!
Second time bouncing off our $40-45 support.
Breaking out of downtrend with a strong bullish candle.
Target $67 then $73 🎯
New Bear Market? Heavy Tech SelloffToday the markets were shattered by weakness in mega cap tech.
All major leading companies in the QQQ were severely down.
We saw the majority of the S&P 500 sectors green with health care leading the charge.
Despite all indices closing negative this was not a full fledge market sell.
Commodities were hit across the board. Gold, Nat gas, Oil, Uranium, Silver were all down.
It seems the market is de risking into J Powell Jackson Hole meeting on Thursday / Friday.
Today we closed out NASDAQ:MSFT NASDAQ:PLTR short & trimmed AMEX:MSOS puts for over 105%
We were very active on the option and swing trading side of the market.

Hims & Hers Health (HIMS) AnalysisHims & Hers Health NYSE:HIMS is a leading telehealth platform delivering personalized care in sexual health, hair loss, dermatology, mental health, and weight loss.
Growth Drivers:
Weight Loss Service Momentum ⚡
Q1 2025 launch of a GLP-1 prescription program with coaching & diagnostics has unlocked a major new revenue stream.
Strong adoption is fueling accelerated growth.
Subscriber & Revenue Growth 📊
Q2 2025 subscribers surged 31–38% YoY to 2.4M.
Monthly revenue per subscriber jumped 30% to $74, reflecting deeper engagement.
Operational Leverage 🤖
AI-driven care and pharmacy automation are enhancing scalability and margins.
Partnership expansions are broadening reach and improving efficiency.
Investment Outlook:
Bullish Case: We remain bullish above $54.00–$55.00, supported by high-margin recurring revenue and strong subscriber momentum.
Upside Potential: Target: $110.00–$115.00, driven by continued adoption of GLP-1 programs, tech-enabled scalability, and strategic partnerships.
📢 HIMS—Scaling Digital Healthcare with AI, Innovation, and Strong Subscriber Economics. #HIMS #Telehealth #GLP1 #DigitalHealth #GrowthStocks
$NVDA - $280-300 YEAR END TARGET Trend is your friend, just keep it simple. Lots of runway ahead accompanied with improved gross margins of mid 70% during back half of the year on already high margins. Technical trend channel has a price objective between $280 to almost $300.

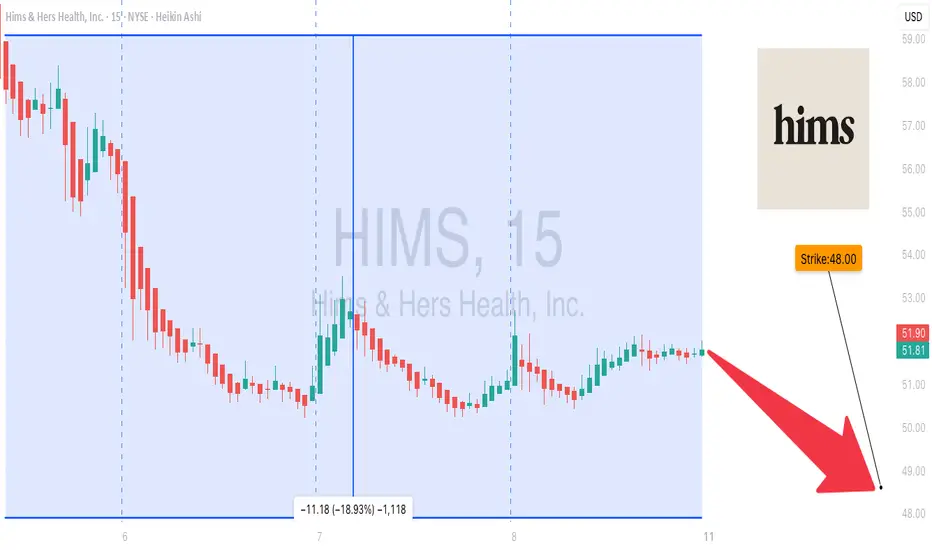
HIMS Bearish Breakdown — Weekly Put Option Setup🚨 HIMS Bearish Breakdown — Weekly Put Option Setup**
Hims & Hers (HIMS) shows strong institutional selling pressure with a clear breakdown below key support levels. Multiple models (Google Gemini, DeepSeek, Claude) confirm bearish momentum fueled by heavy volume, insider selling, and ongoing legal concerns. While a short-term bounce is possible, the bias remains firmly bearish into next week.
**🛠 Trade Setup:**
* **Instrument:** HIMS
* **Direction:** PUT (SHORT)
* **Strike:** \$48.00
* **Expiry:** 2025-08-15
* **Entry Price:** \$0.94
* **Profit Target:** \$1.35 (50% gain)
* **Stop Loss:** \$0.40
* **Size:** 1 contract
* **Entry Timing:** Market open
* **Confidence:** 75%
**📊 Key Factors:**
* Heavy institutional distribution
* Breakdown of weekly support
* High selling volume with low VIX environment (favorable for directional trades)
* Lawsuits + insider selling adding downside risk
**⚠ Risks:**
* Rising daily RSI could spark a temporary bounce
* Event-driven volatility could shift trade direction quickly
---
**#HIMS #OptionsTrading #PutOptions #WeeklyOptions #BearishSetup #SupportBreakdown #TechnicalAnalysis #TradingView #InstitutionalSelling #VolatilityPlay #SwingTrade #OptionsStrategy**