RobinHood - Urgent News - Afterhours SelloffOn June 6, 2025, S&P Dow Jones Indices announced no changes to the S&P 500 index in its quarterly rebalance, marking the first such instance since March 2022. This decision notably excluded Robinhood Markets Inc., despite speculation that it might be included due to its market capitalization exceeding $20.5 billion and recent strong performance. Following the announcement, Robinhood's stock declined over 5% in after-hours trading
The next S&P500 quarterly rebalancing is set for September 2025....perhaps the next leg higher needs to wait until them
As of June 6, market close, Robinhood's stock is trading at $74.88, with a market capitalization of approximately $36.85 billion. The company has experienced significant growth, with a 365% increase in stock price over the past 12 months and a 50% surge to start 2025. Analysts project continued revenue and earnings growth, with an average one-year price target of $51.19 per share
We issued put option alerts to our members and shorted this live stream on Friday afternoon.
HOOD

Why is ROBINHOOD dropping in afterhours? Robinhood's stock (HOOD) is dropping in after-hours trading due to several factors:
1. Regulatory Scrutiny: The company is facing increased attention from regulators, particularly regarding its expansion into unconventional financial offerings like sports betting-related features.
2. Analyst Downgrade: Wolfe Research recently downgraded Robinhood's stock from "Buy" to "Hold," citing valuation concerns and suggesting that the stock's upside potential has already been priced in.
3. Competitive Pressure: Traditional banks and fintech startups are ramping up their offerings, making it harder for Robinhood to maintain its market dominance.
4 Investor Uncertainty: Some investors are skeptical about Robinhood's new ventures, such as its push into banking services and prediction markets, which blur the lines between trading and gambling.
5. Technical Resistance: A clear parallel channel is bringing Hood back to planet earth. This stock has had a 160% run with minimal pullback, profit taking is highly likely.

Why is HOOD still 1/3rd of SCHW? Wealth management remains the last bastion of success for Charles Schwab. Long-term cash, mutual fund, and retirement accounts create an enormous balance sheet, which accures value and reduces fees across the board. I'm hard pressed to see however how NASDAQ:HOOD will not inherit that class of customers as baby boomers pass on their generational wealth to the millenial generation. Do we begin to see a transition of assets from megacaps like NYSE:SCHW in the next 24 - 36 months? I'd say most likely.

$hood is challenging AH!If hood manages to break previous ATH, it will gap up to the 1.272. I seea big target of the next golden ratio at 1.618.

HOOD Weekly Options Outlook — June 3, 2025📈 HOOD Weekly Options Outlook — June 3, 2025
🚨 AI Model Consensus: Moderately Bullish Into June 6 Expiry
🧠 Model Summary
🔹 Grok (xAI)
Bias: Moderately Bullish
Setup: Near 10 EMA, RSI oversold (34.7), strong 5-min EMA alignment.
Trade: Buy $72C @ $0.78 → PT +50%, SL −20%
🔹 Claude (Anthropic)
Bias: Moderately Bearish
Setup: Price below M5 10 EMA, high sell volume; RSI overbought daily.
Trade: Buy $69P @ $2.63 → PT +50%, SL −30%
🔹 Llama (Meta)
Bias: Moderately Bullish
Setup: RSI oversold (5-min), MACD mixed; Daily RSI high.
Trade: Buy $73C @ $0.60 → PT $0.90, SL $0.30
🔹 Gemini (Google)
Bias: Moderately Bullish
Setup: RSI oversold intraday; resistance near $73.15
Trade: Buy $74C @ $0.44 → PT $0.80–0.88, SL $0.22 or below $71
🔹 DeepSeek
Bias: Moderately Bullish
Setup: Oversold bounce potential in strong trend
Trade: Buy $73C @ $0.60 → PT $0.90–1.20, SL $0.30
✅ Consensus Summary
📈 Daily uptrend remains strong across all models
📉 Short-term RSI is oversold → bounce setup likely
📰 Bullish news + falling VIX = supportive backdrop
🧲 Max Pain @ $65 = caution for Friday pin
4 out of 5 models favor bullish call plays
🎯 Recommended Trade Setup
💡 Strategy: Bullish Naked Weekly Call
🔘 Ticker: HOOD
📈 Direction: CALL
🎯 Strike: $73
💵 Entry: $0.60 (limit order suggested)
🎯 Profit Target: $0.90 (+50%)
🛑 Stop Loss: $0.30 (−50%)
📏 Size: 1 contract
📅 Expiry: 2025-06-06
⏰ Entry Timing: Market Open
📈 Confidence: 70%
⚠️ Risk Factors to Watch
📉 Daily RSI >79 = potential for broader pullback
🔄 Max Pain @ $65 could act as drag near expiration
📉 Break below $71.10 invalidates bullish thesis
⌛ Theta decay accelerates after Wednesday

HOOD updateBeautiful weekly cup and handle breakout on $HOOD. With the potential inclusion into the S&P 500 on Friday, we could see price hit IPO high and possibly make new highs before it pulls back. PT $85

$HOOD great product but short term pull back here $58-$60Hello, I have multiple time frames up here: Daily, Weekly, and Monthly. I love Robinhood NASDAQ:HOOD as a broker, product and revolutionary company in the financial space. This is a great long term hold equity wise in my opinion but right now I am looking to short this name for a necessary pullback into $58-$60. It's overbought on the big time frames as you can see highlighted, it is possible it can break out of course but I believe with declining weekly volume this name will resort to some pullback. Also, Bitcoin can have some downside as well which will bring this name down with it. This ticker is volatile and can move 5-8% in either direction in just one session. I am looking for $60p about 3 weeks out, 6/20 date.
WSL

$HOOD weekly cup and handleNASDAQ:HOOD trying to play out a weekly cup and handle formation. Looking for bullish confirmation with a candle close over $66.89. Inverse head and shoulders pattern played out on the daily chart already so a pullback to 60 may play out first.

OptionsMastery: Looking for a breakout on HOOD!🔉Sound on!🔉
📣Make sure to watch fullscreen!📣
Thank you as always for watching my videos. I hope that you learned something very educational! Please feel free to like, share, and comment on this post. Remember only risk what you are willing to lose. Trading is very risky but it can change your life!

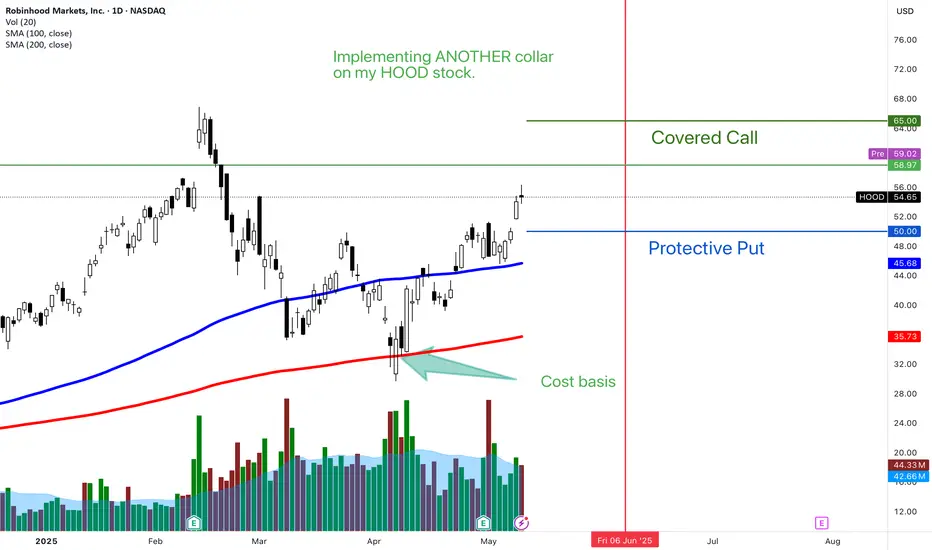
HOOD COLLAR againA collar is when you use options to protect your downside. The perfect collar , you have a put option above your cost basis and a sold call that pays for it. This expires first Friday in June. Looking for HOOD to continue higher over time. BUT , a great stock to buy low, sell high.
HOOD daily chart: breakout or fakeout? Key zone approaching.Robinhood's stock has formed a falling wedge pattern on the daily chart, indicating a potential bullish reversal. The price has broken above the 0.618 Fibonacci level at $44.00, suggesting further upside potential. Next targets are $48.40, $52.79, $58.22, and $67.00. RSI and MACD indicators confirm bullish momentum.
Fundamental Factors:
Robinhood continues to show revenue and profit growth, supporting positive investor sentiment. The company is expanding its services and attracting new users, strengthening its market position.
Scenarios:
Main scenario: continued rise to $48.40, then to $52.79 and higher.
Alternative scenario: pullback to $39.71 with potential decline to $36.00.

Collar I am in on HOODBought of the 200 sma. It's at the 100 sma. Both on the daily. Buy low, sell high, right?
I am getting into a NET PROFITABLE collar over earnings. :-)
CAN'T LOSE from here.

why Robinhood’s stock ($HOOD) could be considered bullish:Analyst Upgrades : Robinhood has received positive upgrades from analysts, with a target price suggesting a significant upside. The company's growth in digital wealth management, AI-powered investing, and new banking features contributes to these bullish forecasts.
Strategic Investments : High-profile investors, such as Cathie Wood’s ARK Invest, have increased their stake in Robinhood, signaling strong confidence in its future growth potential.
Product Diversification: The company continues to expand its services, with new offerings like Robinhood Strategies, an affordable robo-advisor, which is expected to attract a broader customer base seeking wealth management solutions.
Positive Analyst Sentiment: Robinhood has an average "Buy" recommendation from analysts, reflecting general market optimism and the stock's positive outlook over the next 12 months.
Strong Earnings Growth: Robinhood's robust revenue growth rate (over 58% in the last 12 months) reflects its expanding market share and the potential for continued financial success.
Analyst Price Targets: Multiple analysts have set a price target for Robinhood with significant upside potential, indicating that there is room for further price appreciation in the coming year.
Market Positioning: Following political shifts, Robinhood's stock has benefited from increased interest in cryptocurrency trading and favorable market conditions, showing how external factors can favor its performance.
Technological Advancements: Robinhood’s investment in AI tools like Robinhood Cortex enhances its platform’s value proposition, improving user experience and engagement, which could lead to increased retention and growth.
Diversified Revenue Streams: Robinhood’s move into banking, offering high-yield savings accounts, allows the company to tap into new revenue streams, reducing its reliance on traditional brokerage commissions.
Favorable Market Sentiment: Robinhood is seen as part of a broader trend of stocks benefiting from shifts in market sentiment, particularly around the "Trump trade," showing how political and economic cycles can impact stock performance positively.
These factors together suggest a promising outlook for Robinhood’s stock, positioning it for continued growth and potential upside.

cup and handle pattern may be forming on the weekly chart HOOD"Potential Cup and Handle Pattern on NASDAQ:HOOD
A cup and handle pattern may be forming on the weekly chart of HOOD. The cup formation can be seen from August 2024 to February 2025, with a high point of around $55.00 and a low point of around $14.00. The handle formation started in late February 2025 and is currently ongoing.
Key levels to watch:
Resistance: $50.00
Support: $39.00
A breakout above the resistance level could confirm the pattern, potentially leading to a bullish trend. Keep a close eye on this stock! Weekly Daily and Monthly all look good.
#HOOD #cupandhandle #stockmarket #trading"

Robinhood’s Moment of Truth! Breakout, Retest, and Go? Hi,
Robinhood is one of the potential candidates to be included in the S&P 500 index. The new grouping will take place in 21. March
From a technical perspective, this is one of the possible zones where, after a short pause, we saw a breakout and now the price has come back to retest the consolidation area.
Of course, fundamentals play a big role here, but historically, a similar setup has worked well last year.
So, the zone is set—let’s see if this move repeats itself. Technically, the key range is $35 - $44.
Cheers,
Vaido

The HOOD is readyHood looks to be getting ready for its move higher. This is one of the stocks I follow that hasn't done anything and I have used the opportunity to add to my long time holdings.
This is not a financial advice.

Magnificent Seven & Hot Stocks: A Technical OverviewHello,
The past few days and weeks have brought a lot of movement in the stock market, and things seem a bit more redish than before. However, these kinds of moments also bring good opportunities—if you know where to look.
That’s why I decided to take a closer look at the some stocks from Magnificent Seven, scan some of the top market cap stocks, and give a short overview of what’s happening and what to watch.
Since technical analysis helps bring clarity in uncertain times, I will go over some key levels and liquidity zones that could present good opportunities. I will also cover a few stocks that are currently making headlines and generating a lot of interest in the investment world—such as Robinhood (HOOD) and Palantir (PLTR).
Let’s see what the market has to offer.
Microsoft (MSFT)
Microsoft has not made any major moves in the past few weeks, but selling pressure has started to build up, and the stock is now trading at its lowest levels in the past six months.
The most interesting and strongest support area is between $290 and $300. This is a level worth keeping an eye on.
--------------
Amazon (AMZN)
Yesterday, I got an alert from TradingView that AMZN has dropped into an interesting price zone after a small correction. If you don’t already use alerts, I highly recommend setting them up—keeping track of every stock manually is nearly impossible.
The $175–$210 zone is technically solid. Yes, it’s a wide range but there are different strategies you can use here.
Amazon (AMZN) – What to do?
If you don’t own AMZN yet, this could be a good spot to start building a position slowly. Buy a little in the upper part, a little in the middle, and a little in the lower part of this zone to get a balanced entry.
If you already own AMZN, I’d rather wait and aim for the middle of the range if you want to add more. If the stock takes off from here, you already have a position, so there’s no real FOMO. No need to rush.
Of course, this is just a technical view—you should still analyze the fundamentals and your investment thesis. The technicals have spoken and now it’s time to listen to the fundamentals. That way, you get the full picture and can react accordingly.
--------------
Alphabet (GOOG)
GOOG failed to break through the psychological $200 level. It has tested this level multiple times since the start of the year, but the result has been red candles.
If you already own the stock and are considering adding more, or if you are thinking about an entry, the $140–$160 zone is worth watching. At the moment, I don’t see a more logical technical entry.
--------------
Meta Platforms (META)
META has dropped 12% from its all-time high in just a few weeks. The stock has now slowly come to, what I call, a "picking zone" (if you have a better name for it, let me know! :D)—meaning a price range where those who make regular buys might want to pay attention.
Right now, the key levels to watch are ~$612 and ~$500, with $500 being the stronger level. The price has consolidated there a bit longer than around $612, and it also acts as a psychological support level.
--------------
Berkshire Hathaway (BRK.B)
Berkshire has reached what I consider a profit-taking zone. If your fingers are itching and your wallet is waiting for a top-up, then why not? This doesn’t mean selling everything, but it could be a good spot for a partial exit—especially if you need capital for something else.
Why is this a logical profit-taking point?
Looking at previous price behavior around round numbers, we can see a pattern that works every time and your money can be “stuck” for years.
When a stock approaches a big round number for the first time, it tends to:
Consolidate – move sideways for a long time.
Get a strong correction – like Berkshire has done before.
Let’s make the round number concept clearer.
Imagine a stock price starts moving up from $30 and eventually reaches $1000.
Within this range, the key round numbers for me are: $50, $100, $200, $500, and $1000. These are levels where major market reactions often occur or levels that I trust the most as a criterion.
Let’s take Berkshire for example, touching these numbers for the first time:
$50 → 50% drop, took 5 years to recover.
$100 → Another 50% drop, also took 5 years to break higher.
$200 → Multi-year consolidation, 20% drop.
$500 → And now we’re here—your choice!
In a long-term portfolio, there are essentially two types of sales:
The investment thesis is no longer valid
Capital is needed for another purpose
If neither of these conditions is met, there’s no real reason to sell. However, if you need capital within the next six months, this could be a good point to do so. Historically, we’ve seen a pattern where the stock either undergoes a correction or remains stagnant for an extended period.
That makes it a perfect candidate for profit-taking—and if a correction does happen, there’s always the opportunity to buy back at lower prices.
At the moment, buying this stock could mean it stays within this price range for a few years, so I wouldn’t rush into new purchases.
--------------
Tesla (TSLA)
Historically, Tesla has followed technical analysis well due to its high volatility. It reflects market psychology very clearly, leaving visible footprints on the chart...
-----
I also cover these topics in-depth over on my Substack channel, where I break down the full picture and share my insights on the rest. If you want the complete breakdown and my take on what’s next, head over to my Substack (ENG).
🔗 Find the link in my BIO under the Website icon or simply copy and paste it directly.
See you there! 👀
Cheers,
Vaido

RobinHood - A bounce looks imminent!A bounce looks imminent on NASDAQ:HOOD
- At previous S/R Zone ✅
- At volume shelf ✅
- At green support beam ✅
I see a snapback higher to $56 🎯
Not financial advice

ROBINHOOD’S Q4 2024—TRADING BOOM FUELS RECORD GAINSROBINHOOD’S Q4 2024—TRADING BOOM FUELS RECORD GAINS NASDAQ:HOOD
(1/9)
Good morning, Tradingview! Robinhood’s Q4 2024 earnings are out 📈🔥—$1.01B in revenue, up 115% YoY, smashing $945M estimates. Post-election trading frenzy in equities and crypto lit the fuse. Let’s break down HOOD’s monster quarter! 🚀
(2/9) – REVENUE & EARNINGS HIGHLIGHTS
• Q4 Revenue: $1.01B, +115% YoY 💥
• Q3 Recap: $637M, +36% YoY
• Q4 EPS: $1.01, beats $0.43 est. 📊
• Net Income: $916M, up 510% from Q3’s $150M
• ARPU: $164, +102% YoY
Record profits, driven by a trading surge!
(3/9) – KEY WINS
• Net Deposits: $16.1B, +42% QoQ 🌍
• New Tools: Index options, futures, Robinhood Legend launched late 2024 🚗
• SEC Settlement: $45M in Jan 2025 clears past compliance woes ✅
HOOD’s expanding fast and cleaning house!
(4/9) – SECTOR SHOWDOWN
• Market Cap: $56.4B, Stock: $65.28 🌟
• Trailing P/E: 40.9x vs. IBKR (50x), SCHW (20x)
• Revenue Growth: 115% YoY crushes sector avg (5.7%)
Outpaces peers in growth, but valuation’s a hot debate!
(5/9) – RISKS ON DECK
• Market Volatility: Trading boom could fade 📉
• Regs: $45M SEC hit flags ongoing scrutiny 🏛️
• Competition: Schwab, Coinbase closing in ⚔️
• Economy: $1.21T credit card debt, layoffs loom ⚠️
Big gains, big risks—tightrope ahead!
(6/9) – SWOT: STRENGTHS
• Revenue: 115% YoY, $916M profit shines 🌟
• User Loyalty: $16.1B deposits, 2.2M+ Gold subs 🔍
• Innovation: Futures, options expand the game 🚦
HOOD’s firing on all cylinders!
(7/9) – SWOT: WEAKNESSES & OPPORTUNITIES
• Weaknesses: Trading reliance, reg baggage 💸
• Opportunities: Futures growth, crypto-friendly regs, global push 🌍
Can NASDAQ:HOOD turn momentum into a dynasty?
(8/9) – HOOD’s Q4 is a banger—where’s it headed?
1️⃣ Bullish—Growth keeps roaring.
2️⃣ Neutral—Solid, but risks loom.
3️⃣ Bearish—Peak’s in, fade coming.
Vote below! 🗳️👇
(9/9) – FINAL TAKEAWAY
Robinhood’s Q4 is a SEED_TVCODER77_ETHBTCDATA:1B thunderclap—trading, deposits, and profits soar 🌍. But volatility and regs lurk. Undervalued or overhyped?

Robinhood (HOOD) AnalysisCompany Overview:
Robinhood NASDAQ:HOOD is a pioneer in commission-free trading, catering to younger investors with its intuitive, mobile-first platform. The company’s ecosystem includes 25.1 million investment accounts and $152 billion in assets under custody, creating opportunities for recurring revenue streams and cross-selling financial products.
Key Catalysts:
CME Futures Integration 📊
The recent integration of CME Group futures trading allows users access to commodities and index futures, expanding Robinhood’s offerings for more advanced traders. This could add over $200 million in annual revenue, enhancing platform monetization.
Crypto Market Expansion ₿
With a strong presence in bitcoin and ether trading, Robinhood is well-positioned to capitalize on growth in crypto adoption, particularly as regulatory clarity improves in the U.S.
Recurring Revenue Streams 💵
Robinhood’s diversified revenue base includes interest income, premium subscriptions (Robinhood Gold), and securities lending, all of which provide consistent income and bolster financial stability.
Expanding User Base 📈
Continued growth in Robinhood’s user base and account activity drives the platform’s potential for monetization, supported by new product launches and user engagement strategies.
Investment Outlook:
Bullish Case: We are bullish on HOOD above the $46.00-$47.00 range, supported by product expansion, crypto growth, and increasing user engagement.
Upside Potential: Our price target is $80.00-$82.00, reflecting confidence in Robinhood’s ability to diversify revenue streams and capitalize on new financial products.
📢 Robinhood—Redefining Retail Trading with Innovation and Expansion. #CommissionFreeTrading #HOOD #Crypto

ROBINHOOD has a solid Double left in it.There are speculative doubles
and there higher probability plays.
I like HOOD as a firm play to accelerate into the $50 region sometime in Q4
great chart for Momentum players
while the true believer should already had their bags packed long ago.

#Robinhood heading to the death pointas long as the price above 54 $
targets will be
66 $
79 $
if the price reached 79 $ by the 17th of march I'll be watching for top formation

Renaissance of FinTech and $ARKF recent outperformanceSince the bear market lows of 2022, ARK ETF have gained some ground since then. Today we specifically look at the AMEX:ARKF which holds the fintech stocks. Since then, the ETF has seen a renaissance and has broken out of various Fib retracement levels. When we look at the fintech stocks like NASDAQ:UPST , EURONEXT:ADYEN , NASDAQ:PYPL , NYSE:LMND , NASDAQ:HOOD , $ COIN, NASDAQ:SOFI , $XYZ. Even the traditional stocks like NYSE:ICE and NASDAQ:NDAQ have a similar chart.
In terms of chart there was a huge bottom formation, and the recent price action has shown that the Fintech ETF is breaking out of the huge base. The next levels to watch will be 0.618 and 0.786 Fib levels with up to 25% upside potential in price.
Long $ARKF.
